

Wastewater surveillance of SARS-CoV-2 across 40 U.S. states from February to June 2020
- PMID: 34274898
- PMCID: PMC8249441
- DOI: 10.1016/j.watres.2021.117400
Wastewater surveillance of SARS-CoV-2 across 40 U.S. states from February to June 2020
Abstract
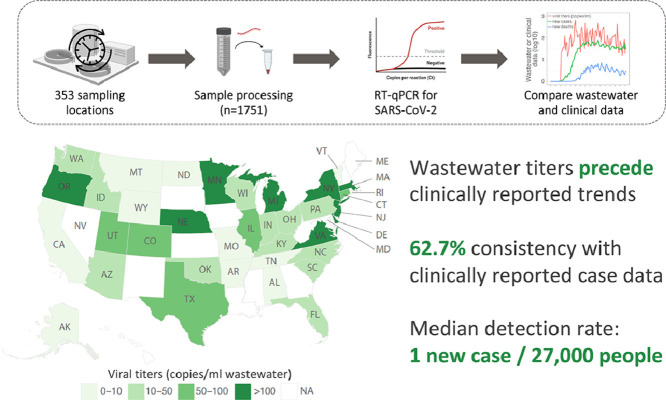
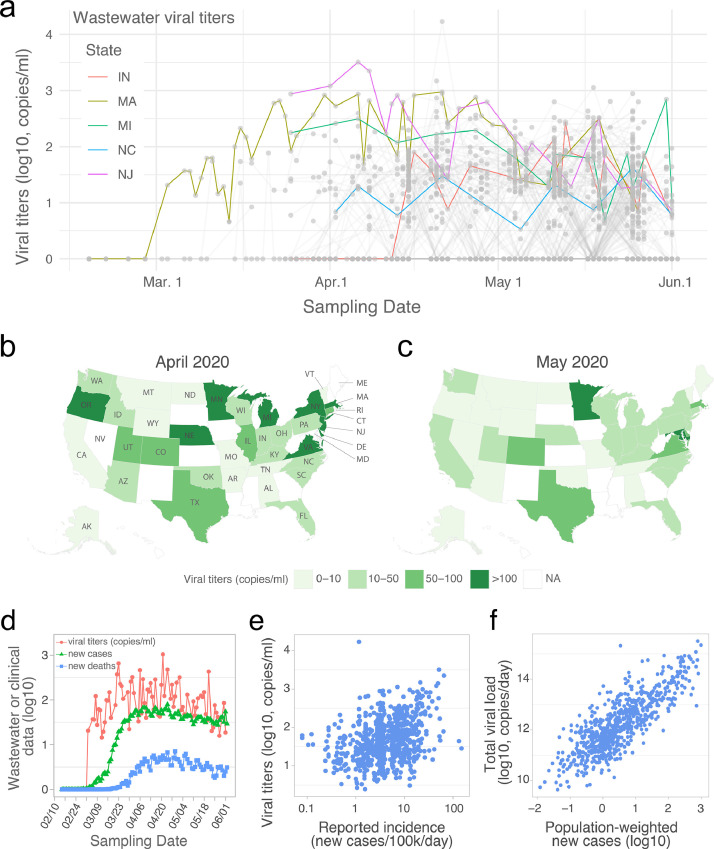
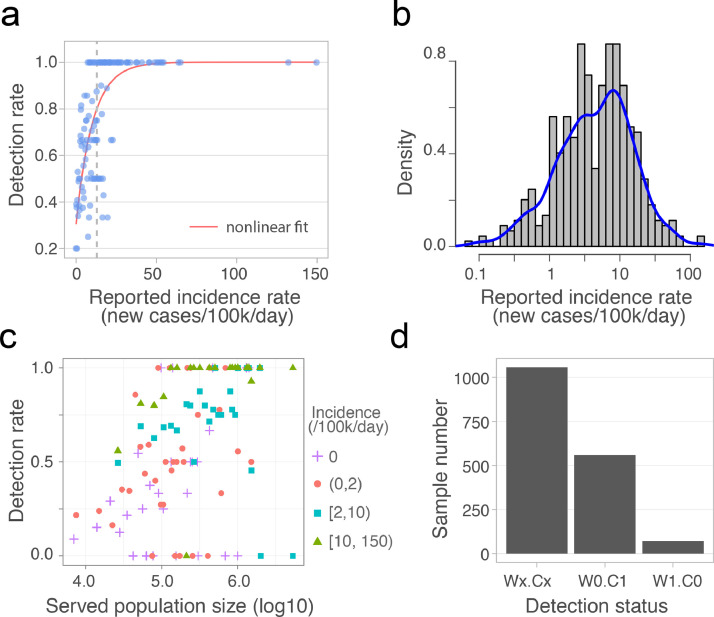
Wastewater-based disease surveillance is a promising approach for monitoring community outbreaks. Here we describe a nationwide campaign to monitor SARS-CoV-2 in the wastewater of 159 counties in 40 U.S. states, covering 13% of the U.S. population from February 18 to June 2, 2020. Out of 1,751 total samples analyzed, 846 samples were positive for SARS-CoV-2 RNA, with overall viral concentrations declining from April to May. Wastewater viral titers were consistent with, and appeared to precede, clinical COVID-19 surveillance indicators, including daily new cases. Wastewater surveillance had a high detection rate (>80%) of SARS-CoV-2 when the daily incidence exceeded 13 per 100,000 people. Detection rates were positively associated with wastewater treatment plant catchment size. To our knowledge, this work represents the largest-scale wastewater-based SARS-CoV-2 monitoring campaign to date, encompassing a wide diversity of wastewater treatment facilities and geographic locations. Our findings demonstrate that a national wastewater-based approach to disease surveillance may be feasible and effective.
Keywords: Detection rate; SARS-CoV-2; Spatiotemporal dynamics; United States; Wastewater surveillance.
Copyright © 2021. Published by Elsevier Ltd.
Conflict of interest statement
MM and NG are cofounders of Biobot Analytics. EJA is advisor to Biobot Analytics. CD, KAM, KF, and NE are employees at Biobot Analytics, and all these authors hold shares in the company. PRC and TBE have a financial interest in Biobot Analytics, a company engaged in the collection and analysis of wastewater to develop epidemiological data. PRC and TBE’s interests were reviewed and are managed by Brigham and Women’s Hospital and Mass General Brigham in accordance with their conflict of interest policies.
The authors declare that they have no known competing financial interests or personal relationships that could have appeared to influence the work reported in this paper.
Figures
Update of
-
Wastewater Surveillance of SARS-CoV-2 across 40 U.S. states.medRxiv [Preprint]. 2021 Mar 14:2021.03.10.21253235. doi: 10.1101/2021.03.10.21253235. medRxiv. 2021. Update in: Water Res. 2021 Sep 1;202:117400. doi: 10.1016/j.watres.2021.117400. PMID: 33758888 Free PMC article. Updated. Preprint.
References
-
- Ahmed W., Angel N., Edson J., Bibby K., Bivins A., O’Brien J.W., Choi P.M., Kitajima M., Simpson S.L., Li J., Tscharke B., Verhagen R., Smith W.J.M., Zaugg J., Dierens L., Hugenholtz P., Thomas K.V., Mueller J.F. First confirmed detection of SARS-CoV-2 in untreated wastewater in Australia: a proof of concept for the wastewater surveillance of COVID-19 in the community. Sci. Total Environ. 2020;728 doi: 10.1016/j.scitotenv.2020.138764. - DOI - PMC - PubMed
-
- Ahmed W., Bertsch P.M., Bivins A., Bibby K., Farkas K., Gathercole A., Haramoto E., Gyawali P., Korajkic A., McMinn B.R., Mueller J.F., Simpson S.L., Smith W.J.M., Symonds E.M., Thomas K.V., Verhagen R., Kitajima M. Comparison of virus concentration methods for the RT-qPCR-based recovery of murine hepatitis virus, a surrogate for SARS-CoV-2 from untreated wastewater. Sci. Total Environ. 2020;739 doi: 10.1016/j.scitotenv.2020.139960. - DOI - PMC - PubMed
-
- Albastaki A., Naji M., Lootah R., Almeheiri R., Almulla H., Almarri I., Alreyami A., Aden A., Alghafri R. First confirmed detection of SARS-COV-2 in untreated municipal and aircraft wastewater in Dubai, UAE: the use of wastewater based epidemiology as an early warning tool to monitor the prevalence of COVID-19. Sci. Total Environ. 2021;760 doi: 10.1016/j.scitotenv.2020.143350. - DOI - PMC - PubMed
-
- Bivins A., North D., Ahmad A., Ahmed W., Alm E., Been F., Bhattacharya P., Bijlsma L., Boehm A.B., Brown J., Buttiglieri G., Calabro V., Carducci A., Castiglioni S., Cetecioglu Gurol Z., Chakraborty S., Costa F., Curcio S., de los Reyes F.L., Delgado Vela J., Farkas K., Fernandez-Casi X., Gerba C., Gerrity D., Girones R., Gonzalez R., Haramoto E., Harris A., Holden P.A., Islam Md.T., Jones D.L., Kasprzyk-Hordern B., Kitajima M., Kotlarz N., Kumar M., Kuroda K., La Rosa G., Malpei F., Mautus M., McLellan S.L., Medema G., Meschke J.S., Mueller J., Newton R.J., Nilsson D., Noble R.T., van Nuijs A., Peccia J., Perkins T.A., Pickering A.J., Rose J., Sanchez G., Smith A., Stadler L., Stauber C., Thomas K., van der Voorn T., Wigginton K., Zhu K., Bibby K. Wastewater-based epidemiology: global collaborative to maximize contributions in the fight against COVID-19. Environ. Sci. Technol. 2020 doi: 10.1021/acs.est.0c02388. - DOI - PubMed
MeSH terms
Substances
Grants and funding
LinkOut - more resources
Full Text Sources
Medical
Miscellaneous
