. 2022;49(5):1265-1293.
doi: 10.1007/s11116-021-10210-7. Epub 2021 Jul 13.

Easing or tightening control strategies: determination of COVID-19 parameters for an agent-based model

Affiliations

Easing or tightening control strategies: determination of COVID-19 parameters for an agent-based model

Ali Najmi et al. Transportation (Amst). 2022.

Abstract

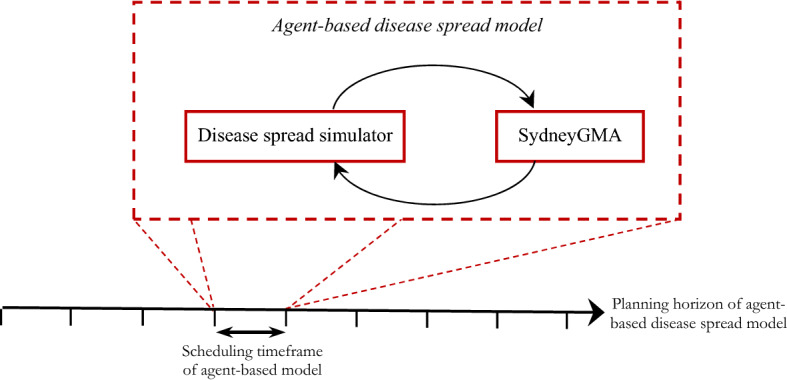
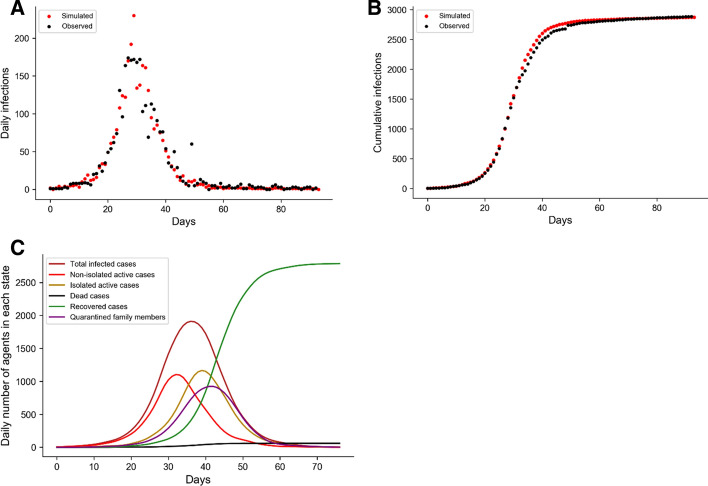
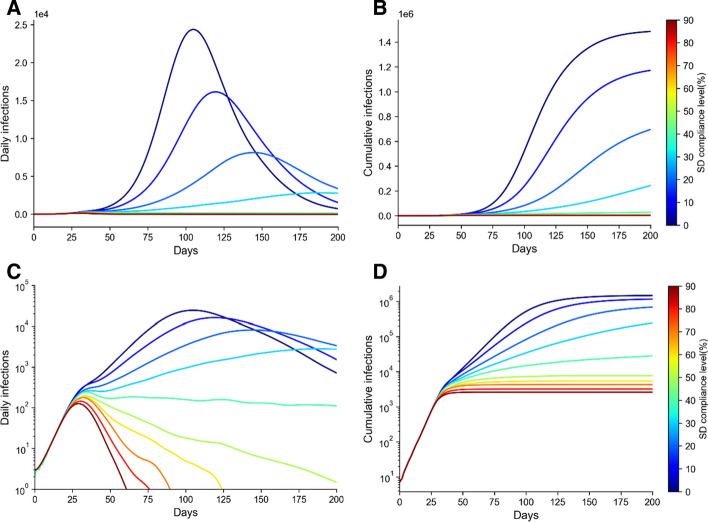
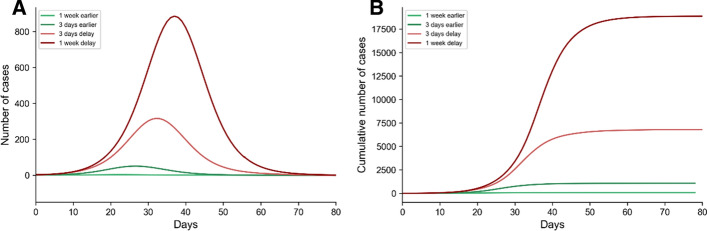
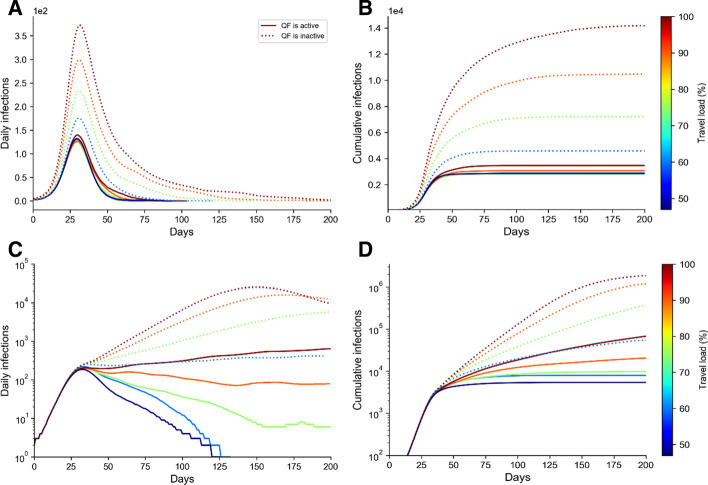
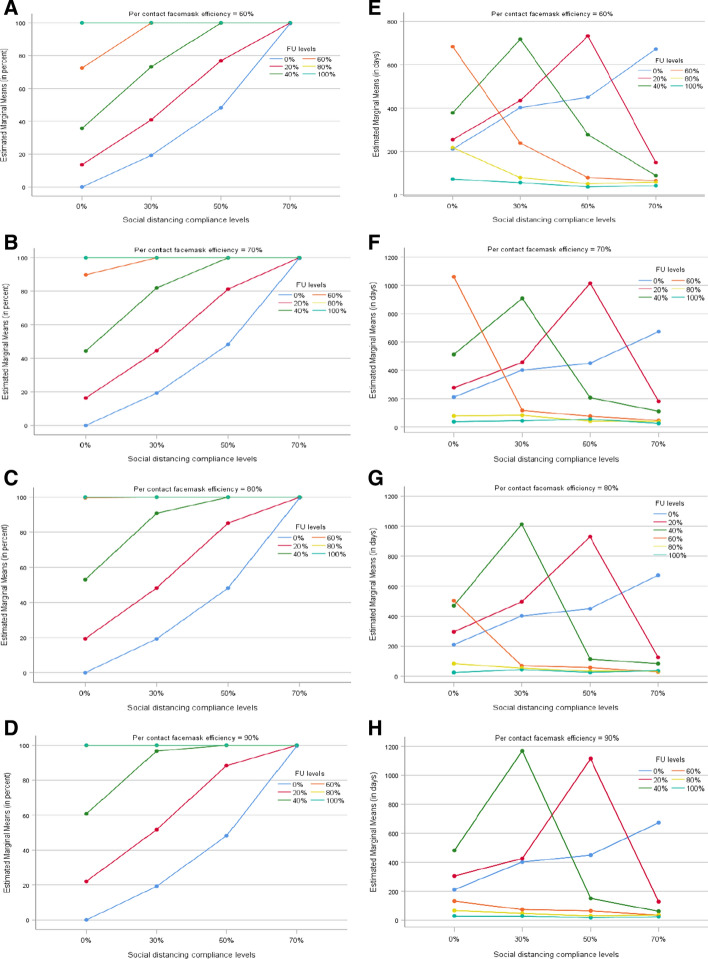
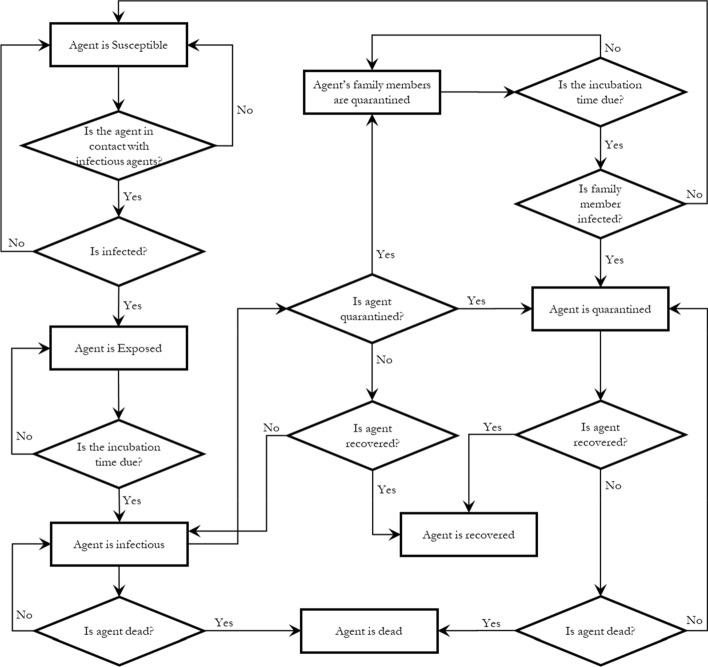
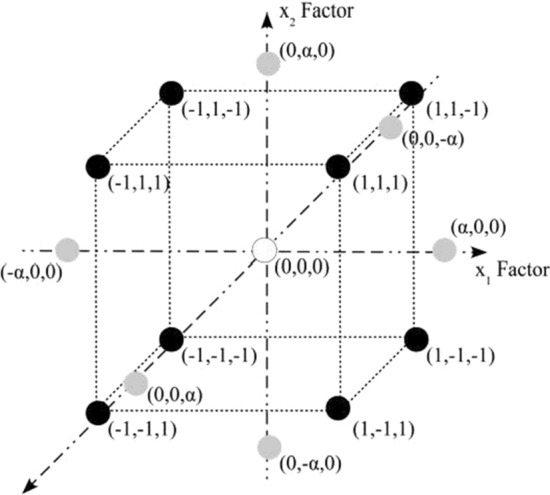
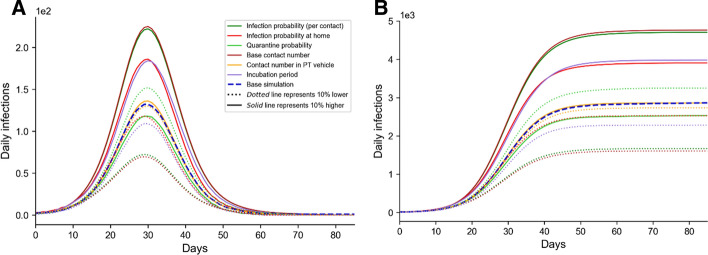
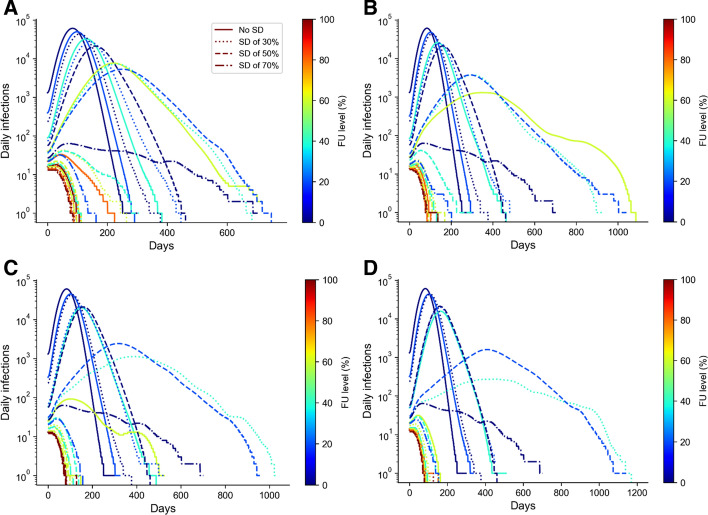
Some agent-based models have been developed to estimate the spread progression of coronavirus disease 2019 (COVID-19) and to evaluate strategies aimed to control the outbreak of the infectious disease. Nonetheless, COVID-19 parameter estimation methods are limited to observational epidemiologic studies which are essentially aggregated models. We propose a mathematical structure to determine parameters of agent-based models accounting for the mutual effects of parameters. We then use the agent-based model to assess the extent to which different control strategies can intervene the transmission of COVID-19. Easing social distancing restrictions, opening businesses, speed of enforcing control strategies, quarantining family members of isolated cases on the disease progression and encouraging the use of facemask are the strategies assessed in this study. We estimate the social distancing compliance level in Sydney greater metropolitan area and then elaborate the consequences of moderating the compliance level in the disease suppression. We also show that social distancing and facemask usage are complementary and discuss their interactive effects in detail.

Keywords: Agent-based disease spread model; Compliance level; Control strategies; Facemask; Social distancing.


Conflict of interest statement

Conflicts of interestAll authors have seen and approved the manuscript and have contributed significantly to the paper. Also, the authors declare that they have no conflict of interest.

Figures

Fig. 1
Fig. 1
The structure of agent-based disease spread models
Fig. 2
Fig. 2
Power of the calibrated SydneyGMA -based disease spreading model in reproducing the daily number of cases a, the cumulative number of cases b and the number of cases at each state of the pandemic modelling c in the base-case scenario
Fig. 3
Fig. 3
A comparison of different SD compliance levels. The settings for other control strategies are the same as in the base scenario. a daily number of cases (linear), b cumulative cases (linear), c daily number of cases (logarithmic), and d cumulative cases (logarithmic). Note: Responding to the skewness of large values, (A) and (B) are plotted in logarithmic scale in (C) and (D)
Fig. 4
Fig. 4
A comparison between the influence of implementing the lockdown earlier (in greenish) and later (in reddish) while all the strategies are in place as in the base case scenario. a Daily number of cases, and b Cumulative number of cases
Fig. 5
Fig. 5
A comparison of different travel load and its interaction with home quarantine strategy at two social distance compliance levels of 85.9% and 60%. a daily number of cases at the SD compliance level of 85.9%, b cumulative cases daily number of cases at the SD compliance level of 85.9%, c daily number of cases at the SD compliance level of 60%, and (D) cumulative cases daily number of cases at the SD compliance level of 60%. Note: Responding to the skewness of large values, (C) and (D) are plotted in logarithmic scale
Fig. 6
Fig. 6
A comparison of different levels of wearing facemask, at different per contact efficiencies, and their interactions with social distancing levels when the TL is the same as pre-COVID. a-d The reduction rate in the number of infections at different per contact efficiencies, eh The time it takes the disease spread getting under control at different per contact efficiencies
Fig. 7
Fig. 7
Disease spread simulator
Fig. 8
Fig. 8
Schematic diagram of a three-factor central composite design (CCD)
Fig. 9
Fig. 9
Sensitivity analysis of the model by adjusting different calibrated parameters by 10% above and below their calibrated values. a Daily number of cases, and b Cumulative number of cases
Fig. 10
Fig. 10
Daily number of cases (logarithmic) at different FU and SD levels under per contact efficiencies of 60% a, 70% b, 80% c, and 90% d

References

    1. Ahn H. Central composite design for the experiments with replicate runs at factorial and axial points. Springer; 2015. pp. 969–979.
    1. Aleta A, Martín-Corral D, Piontti APY, Ajelli M, Litvinova M, Chinazzi M, Dean NE, Halloran ME, Longini IM, Merler S, Pentland A, Vespignani A, Moro E, Moreno Y. Modeling the impact of social distancing, testing, contact tracing and household quarantine on second-wave scenarios of the COVID-19 epidemic. MedRxiv. 2020 doi: 10.1101/2020.05.06.20092841. - DOI - PMC - PubMed
    1. Anastassopoulou C, Russo L, Tsakris A, Siettos C. Data-based analysis, modelling and forecasting of the COVID-19 outbreak. PLoS ONE. 2020;15:e0230405. doi: 10.1371/journal.pone.0230405. - DOI - PMC - PubMed
    1. Anderson RM, Heesterbeek H, Klinkenberg D, Hollingsworth TD. How will country-based mitigation measures influence the course of the COVID-19 epidemic? Lancet. (london, England) 2020;395:931–934. doi: 10.1016/S0140-6736(20)30567-5. - DOI - PMC - PubMed
    1. Anderson RM, Vegvari C, Truscott J, Collyer BS. Challenges in creating herd immunity to SARS-CoV-2 infection by mass vaccination. Lancet. 2020 doi: 10.1016/S0140-6736(20)32318-7. - DOI - PMC - PubMed

LinkOut - more resources