. 2021 Jul 1:15:683769.
doi: 10.3389/fncel.2021.683769. eCollection 2021.

BK Channel-Mediated Microglial Phagocytosis Alleviates Neurological Deficit After Ischemic Stroke

Affiliations

BK Channel-Mediated Microglial Phagocytosis Alleviates Neurological Deficit After Ischemic Stroke

Shuxian Huang et al. Front Cell Neurosci. .

Abstract

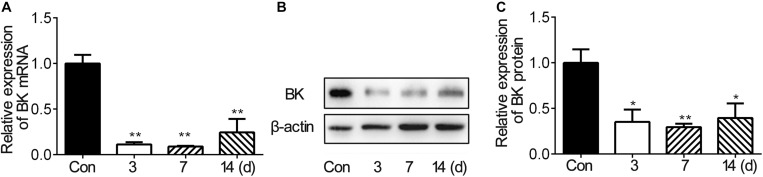
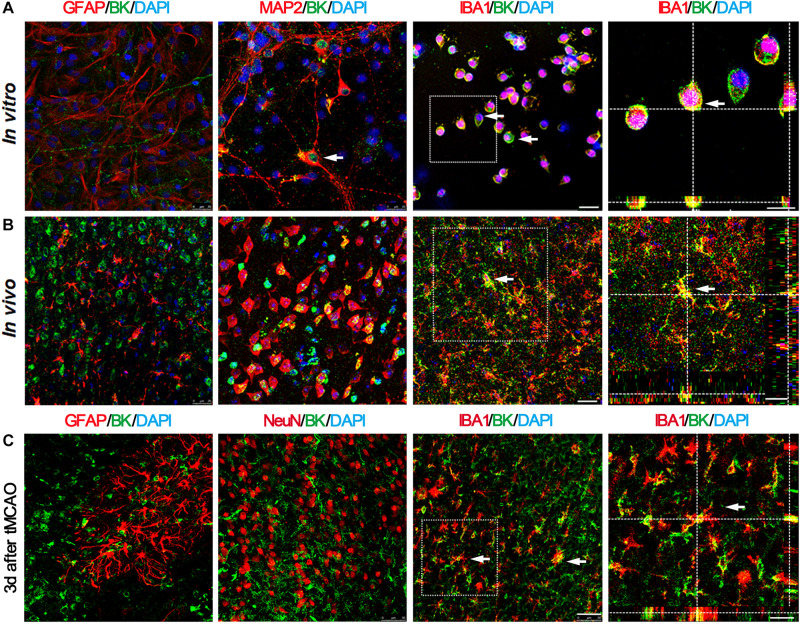
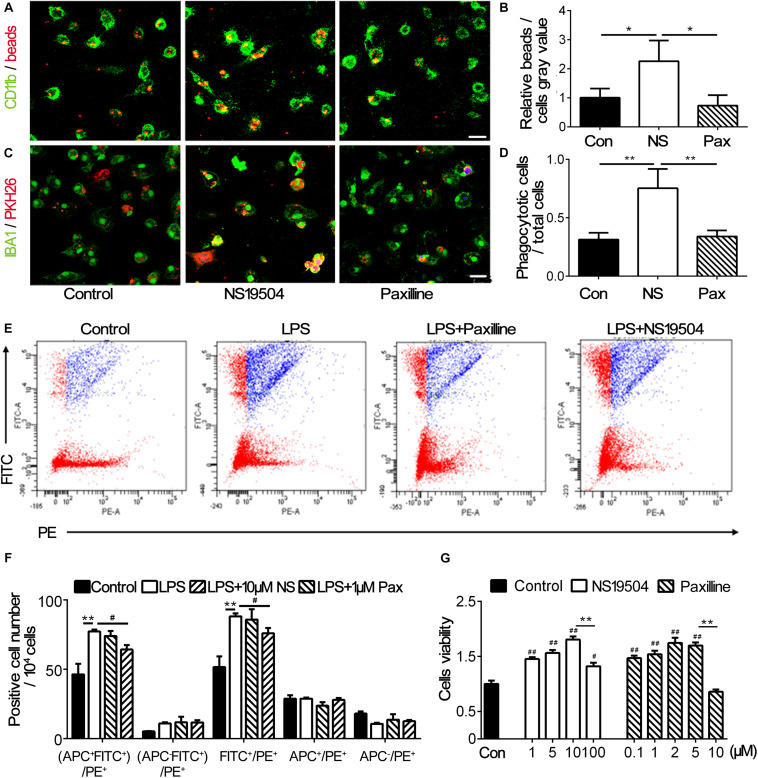
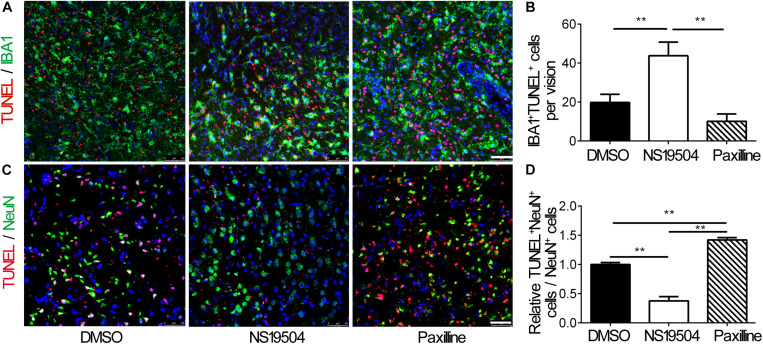
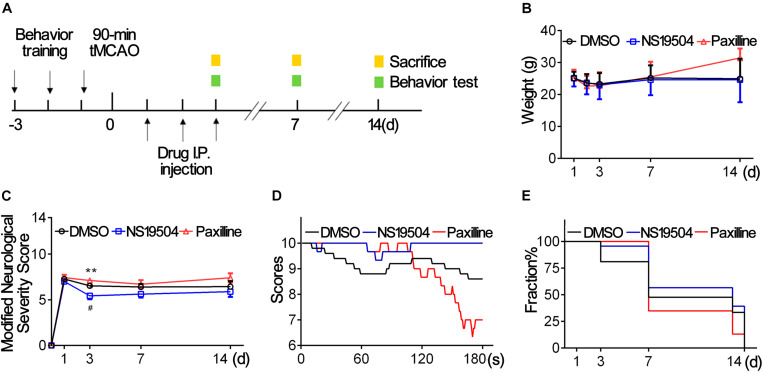
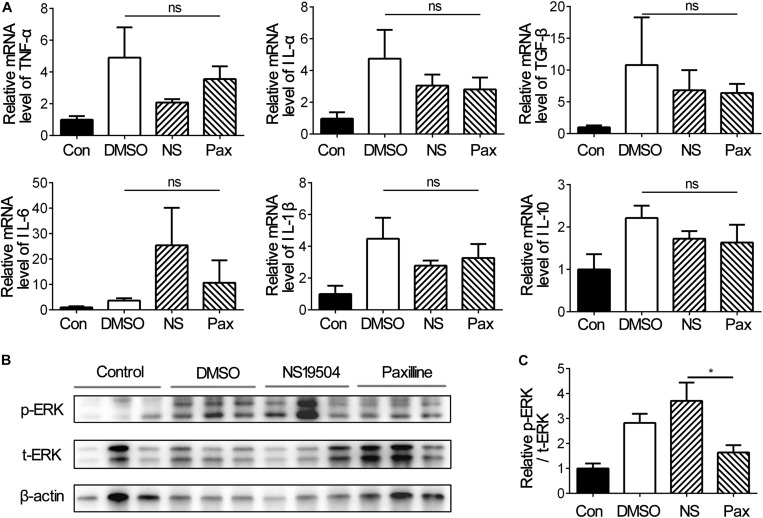
Microglial phagocytosis benefits neurological recovery after stroke. Large-conductance Ca2+-activated K+ currents are expressed in activated microglia, and BK channel knockout aggravates cerebral ischemic injury. However, the effect of BK channels on microglial phagocytosis after ischemic stroke remains unknown. Here, we explored whether BK channel activation is beneficial for neurological outcomes through microglial phagocytosis after ischemic stroke. ICR mice after transient middle cerebral artery occlusion (tMCAO) were treated with dimethyl sulfoxide (DMSO), BK channel activator NS19504, and inhibitor Paxilline. The results showed a decrease in BK channel expression after tMCAO. BK channel activator NS19504 alleviates neurological deficit after experimental modeling of tMCAO in mice compared to the control. Furthermore, we treated primary microglia with DMSO, NS19504, and Paxilline after oxygen glucose deprivation (OGD). NS19504 promoted primary microglial phagocytosing fluorescent beads and neuronal debris, which reduced neuronal apoptosis after stroke. These effects could be reversed by BK channel inhibitor Paxilline. Finally, NS19504 increased relative phosphorylated extracellular signal-regulated kinase 1/2 expression compared to the Paxilline group at the third day after stroke. Our findings indicate that microglial BK channels are a potential target for acute stage of ischemic stroke therapy.

Keywords: BK channels; ERK; ischemic stroke; microglia; phagocytosis.


Conflict of interest statement

The authors declare that the research was conducted in the absence of any commercial or financial relationships that could be construed as a potential conflict of interest.

Figures

FIGURE 1
FIGURE 1
BK expression in the ipsilateral hemisphere decreased after mouse tMCAO. (A) Bar graph shows the BK mRNA expression in the mouse ipsilateral hemisphere at 3, 7, and 14 days after 90-min tMCAO. Data are mean ± SE, n = 3–7 per group. **p < 0.05. tMCAO vs. control. (B) Representative image of Western blot shows BK expression in the mouse ipsilateral hemisphere at 3, 7, and 14 days after 90-min tMCAO. (C) Bar graph shows that the semiquantitative data of BK protein levels at 3, 7, and 14 days after tMCAO. Data are mean ± SE, n = 3 per group. *p < 0.05, **p < 0.01, tMCAO vs. control.
FIGURE 2
FIGURE 2
BK channels are mainly expressed in microglia and neurons, but not in astrocytes. (A) Representative photomicrographs show BK (green), GFAP (red), MAP2 (red), and IBA1 (red) double staining in primary cultured cells. Scale bar = 25 μm. Right-side image indicates that BK is expressed in the IBA1+ microglia by 3D two-photo microscope image. Scale bar = 10 μm. (B) Representative photomicrographs show BK (green), GFAP (red), MAP2 (red), and IBA1 (red) double staining in the cortex of the normal mouse brain. Scale bar = 25 μm. Right-side image indicates that BK was expressed within the IBA1+ microglia, scale bar = 30 μm. (C) Representative photomicrographs of BK/GFAP, BK/NeuN, and BK/IBA1 double staining at 3 days after tMCAO. Scale bar = 50 μm. Right-side image indicated that BK was expressed in the IBA1+ microglia by 3D two-photo microscope image. Scale bar = 20 μm.
FIGURE 3
FIGURE 3
BK channel activator NS19504 promoted microglial phagocytosis after OGD in primary culture. (A) Representative images of beads (red) phagocytosed by CD11b+ microglia (green) after 1 h of OGD. Control group: primary microglia cultured with basic microglia medium; NS19504 group: primary microglia cultured with 10 μM NS19504 in basic microglia medium; Paxilline group: primary microglia cultured with 1 μM Paxilline in basic microglia medium. Scale bar = 25 μm. (B) Bar graph showed that semiquantitative data of the relative bead density versus microglia. Data are mean + SE, n = 3 per group. *p < 0.05, control vs. NS19504 or Paxilline vs. NS19504 group. (C) Representative photomicrographs showed that neuronal debris (red) phagocytosed by microglia (green) in the NS19504- and Paxilline-treated mice following tMCAO. Scale bar = 25 μm. (D) Bar graph shows semiquantitative data of the proportion of microglia that phagocytose neuronal debris. Data are mean + SE, n = 3 per group. *p < 0.05, NS19504 vs. control or Paxilline vs. NS19504 group. (E) Representative photomicrographs show FITC and PE-positive cells. FITC-labeled beads were phagocytosed by PE-labeled microglia. Primary microglia were divided into the control group (basic microglia medium); LPS group (200 ng/ml LPS); LPS + NS19504 group (200 ng/ml LPS and 10 μM NS19504); and LPS + Paxilline group (200 ng/ml LPS and 1 μM Paxilline). (F) Bar graph shows semiquantitative analysis of the proportion of microglia that phagocytose beads. Data are mean + SE, n = 3 per group. **p < 0.01, compared with the control group. #p < 0.05, compared with the Paxilline group. (G) Bar graph shows the result of CCK-8 assay in the primary microglia without or with different concentrations of Paxilline and NS19504 for 12 h of OGD. Data are mean ± SE, n = 3 per group. #p < 0.05, ##p < 0.01, compared with the control group. *p < 0.05, **p < 0.01; NS represents for NS19504, and Pax represents for Paxilline.
FIGURE 4
FIGURE 4
Activation of BK channels promoted the phagocytic function of microglia after tMCAO and decreased neuronal apoptosis. (A) Representative photomicrograms of IBA1+ microglia (green) and TUNEL+ apoptotic cells (red) in the peri-infarct region of brain slice in the DMSO, NS19504, and Paxilline groups at 3 days after tMCAO. Scale bar = 50 μm. (B) Bar graph shows quantitative analysis of the number of IBA1+ TUNEL+ cells per field. Data are mean + SE, n = 3 per group. *vs. DMSO group, **p < 0.01. (C) Representative photomicrograms of NeuN+ neurons (green) and TUNEL+ apoptotic cells (red) in the peri-infarct region of brain slice in the DMSO, NS19504, and Paxilline groups at 3 days after tMCAO. Scale bar = 50 μm. (D) Bar graph shows quantitative analysis of the number of NeuN+/TUNEL+ cells per vision. Data are mean + SE, n = 3 per group. *vs. DMSO group, **p < 0.01.
FIGURE 5
FIGURE 5
Activation of BK channels ameliorated stroke outcomes. (A) Experiment design of the animal experiment. Three days before tMCAO, mice were subjected behavior training. After a 90-min tMCAO surgery, mice were divided randomly into four groups (sham, DMSO, NS19504, and Paxilline). At 1, 3, 7, and 14 days, behavior tests were performed, and protein and RNA samples were collected. (B) Weight changes of mice in three groups at 1, 2, 3, 7, and 14 days after tMCAO. (C) Modified Neurological Severity Score of three groups at 1, 3, 7, and 14 days after tMCAO. (D) Average score per second of three groups of hinging wire at 3 days after tMCAO. (E) Survivorship curve during 14 days of three groups after tMCAO. Data are mean + SE, n = 21–23 per group at 1 day, n = 17–23 per group at 3 days, n = 8–13 per group at 7 days, n = 3–9 per group at 14 days. *NS19504 vs. Paxilline group, **p < 0.01. #NS19504 vs. DMSO, #p < 0.05.
FIGURE 6
FIGURE 6
Inflammatory factors and phosphorylated-ERK expressions under different treatments at 3 days after tMCAO. (A) Bar graph represents the relative mRNA levels of inflammatory factors including TNF-α, TGF-β, IL-10, IL-6, IL-1β, and IL-1α. Data are mean + SE, n = 3 per group. (B) Representative image of Western blot of phosphorylated-ERK1/2 (p-ERK), total-ERK1/2 (t-ERK), and β-actin at 3 days after tMCAO. (C) Bar graph showing the relative protein levels of p-ERK vs. t-ERK at 3 day after tMCAO. Data are mean + SE, n = 9 per group. *NS19504 vs. Paxilline group, *p < 0.05; ns, no significance.

References

    1. Adav S. S., Sze S. K. (2020). Hypoxia-induced degenerative protein modifications associated with aging and age-associated disorders. Aging Dis. 11 341–364. 10.14336/AD.2019.0604 - DOI - PMC - PubMed
    1. Catacuzzeno L., Caramia M., Sforna L., Belia S., Guglielmi L., D’Adamo M. C., et al. (2015). Reconciling the discrepancies on the involvement of large-conductance Ca(2+)-activated K channels in glioblastoma cell migration. Front. Cell Neurosci. 9:152. 10.3389/fncel.2015.00152 - DOI - PMC - PubMed
    1. Chamorro A., Lo E. H., Renu A., van Leyden K., Lyden P. D. (2020). The future of neuroprotection in stroke. J. Neurol. Neurosurg. Psychiatry 92:e3. 10.1136/jnnp-2020-324283 - DOI - PubMed
    1. Chang Z., Zou H., Xie Z., Deng B., Que R., Huang Z., et al. (2021). Cystatin C is a potential predictor of unfavorable outcomes for cerebral ischemia with intravenous tissue plasminogen activator treatment: a multicenter prospective nested case-control study. Eur. J. Neurol. 28 1265–1274. 10.1111/ene.14663 - DOI - PubMed
    1. Chi S., Cai W., Liu P., Zhang Z., Chen X., Gao L., et al. (2010). Baifuzi reduces transient ischemic brain damage through an interaction with the STREX domain of BKCa channels. Cell Death Dis. 1:e13. 10.1038/cddis.2009.10 - DOI - PMC - PubMed