. 2021 Jun 30:12:707355.
doi: 10.3389/fimmu.2021.707355. eCollection 2021.

Dysregulation of the Immune Environment in the Airways During HIV Infection

Affiliations

Dysregulation of the Immune Environment in the Airways During HIV Infection

Rubina Bunjun et al. Front Immunol. .

Abstract

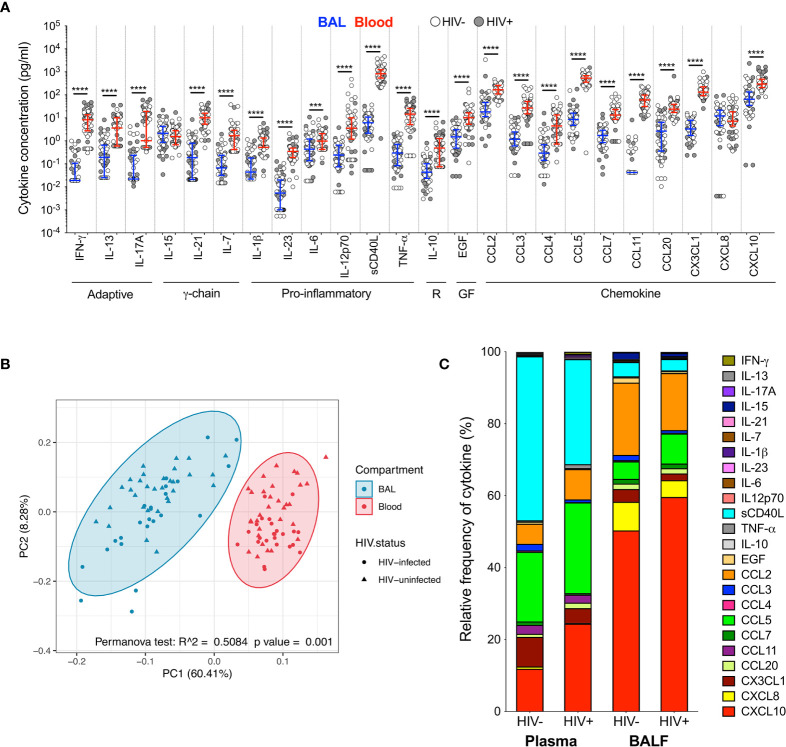
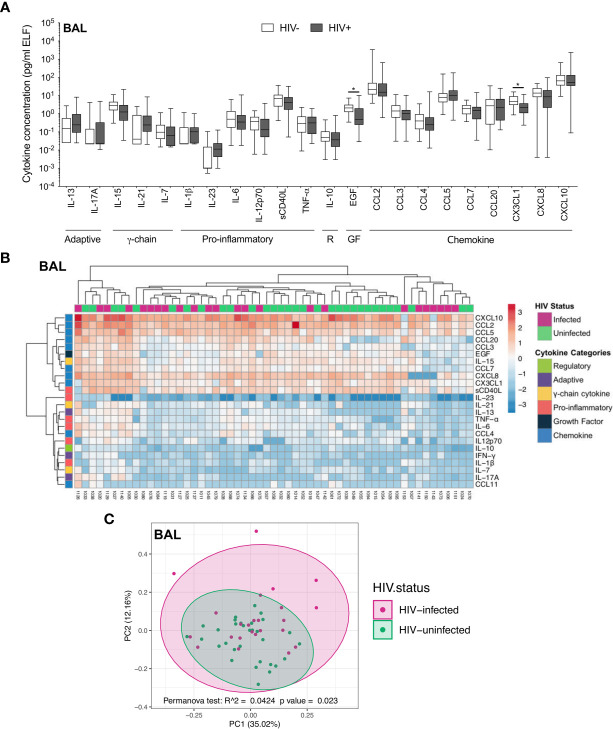
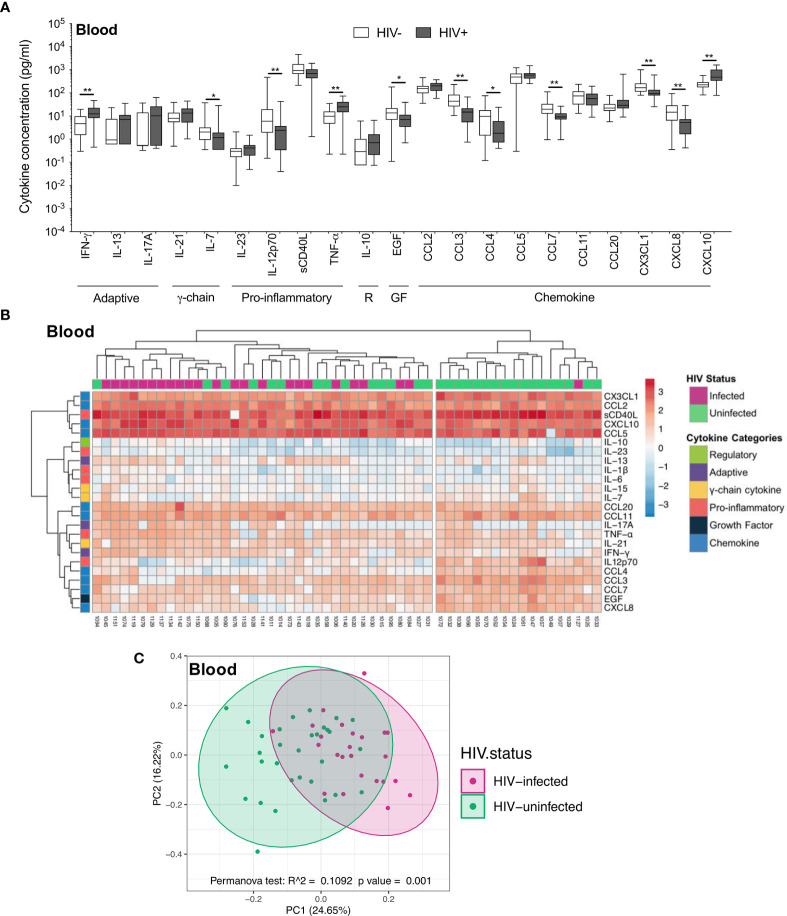
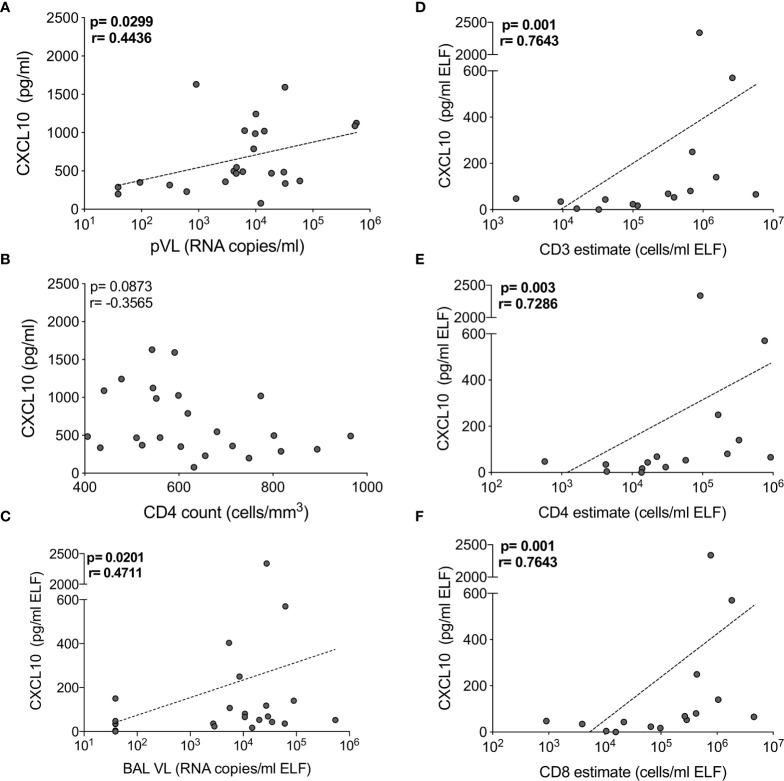
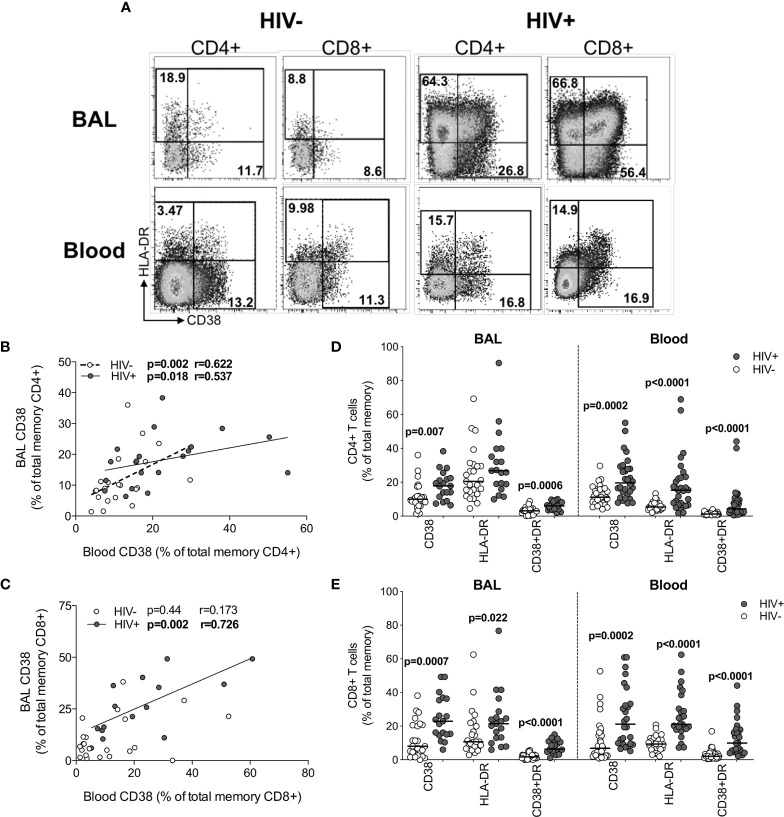
HIV-1 increases susceptibility to pulmonary infection and disease, suggesting pathogenesis in the lung. However, the lung immune environment during HIV infection remains poorly characterized. This study examined T cell activation and the cytokine milieu in paired bronchoalveolar lavage (BAL) and blood from 36 HIV-uninfected and 32 HIV-infected participants. Concentrations of 27 cytokines were measured by Luminex, and T cells were phenotyped by flow cytometry. Blood and BAL had distinct cytokine profiles (p=0.001). In plasma, concentrations of inflammatory cytokines like IFN-γ (p=0.004) and TNF-α (p=0.004) were elevated during HIV infection, as expected. Conversely, BAL cytokine concentrations were similar in HIV-infected and uninfected individuals, despite high BAL viral loads (VL; median 48,000 copies/ml epithelial lining fluid). HIV-infected individuals had greater numbers of T cells in BAL compared to uninfected individuals (p=0.007); and BAL VL positively associated with CD4+ and CD8+ T cell numbers (p=0.006 and p=0.0002, respectively) and CXCL10 concentrations (p=0.02). BAL T cells were highly activated in HIV-infected individuals, with nearly 2-3 fold greater frequencies of CD4+CD38+ (1.8-fold; p=0.007), CD4+CD38+HLA-DR+ (1.9-fold; p=0.0006), CD8+CD38+ (2.8-fold; p=0.0006), CD8+HLA-DR+ (2-fold; p=0.022) and CD8+CD38+HLA-DR+ (3.6-fold; p<0.0001) cells compared to HIV-uninfected individuals. Overall, this study demonstrates a clear disruption of the pulmonary immune environment during HIV infection, with readily detectable virus and activated T lymphocytes, which may be driven to accumulate by local chemokines.

Keywords: HIV; T cells; activation; cytokines; inflammation; lung.


Conflict of interest statement

The authors declare that the research was conducted in the absence of any commercial or financial relationships that could be construed as a potential conflict of interest.

Figures

Figure 1
Figure 1
Soluble immune mediators in blood and BAL. (A) Comparison of cytokine concentrations in BAL (blue) and blood (red) of HIV-infected (filled circles) and HIV-uninfected (open circles) individuals. “R” refers to regulatory cytokines and “GF” refers to growth factors. The blue and red lines denote the median and interquartile ranges for BAL and blood, respectively. Statistical analyses were performed using a non-parametric Wilcoxon paired test with False Discovery Rate (FDR) step down correction. (B) Principal component analysis and permutational multivariate analysis of variance (permANOVA) of cytokine concentrations in BAL (blue) and blood (red). (C) Cytokine concentration expressed as a proportion of the total milieu in BAL and plasma. The relative proportion of each analyte was calculated as a percentage of the sum total of the analyte concentrations in that compartment. GM-CSF, IL-22 and IL-4 were excluded altogether as they were below the level of detection in both BAL and blood. Analytes that fell below the limit of detection for some participants were reported as half the minimum detectable concentration. The p values, p ≤ 0.05, p ≤ 0.01, p ≤ 0.001, p ≤ 0.0001 are reported as *, **, *** and ****, respectively.
Figure 2
Figure 2
Soluble immune mediators in BAL in HIV-infected and uninfected individuals. (A) Box and whisker plots (min-max) comparing cytokine concentrations in BAL according to HIV status. “R” refers to regulatory cytokines and “GF” refers to growth factors. Statistical analyses were performed using a non-parametric Mann-Whitney U test with False Discovery Rate (FDR) step down correction. (B) Unsupervised hierarchical clustering of cytokines in BAL. (C) Principal component analysis and permutational multivariate analysis of variance (permANOVA) of soluble immune mediators in HIV-infected (pink; n=24) and uninfected (green; n=31) participants. GM-CSF, IL-22, IL-4, IFN-γ and CCL11 were excluded as they were below the level of detection. The p values, p ≤ 0.05, p ≤ 0.01, p ≤ 0.001, p ≤ 0.0001 are reported as *, **, *** and ****, respectively.
Figure 3
Figure 3
Soluble immune mediators in blood in HIV-infected and uninfected individuals. (A) Box and whisker plots (min-max) comparing cytokine concentrations in plasma according to HIV status. “R” refers to regulatory cytokines and “GF” refers to growth factors. Statistical analyses were performed using a non-parametric Mann-Whitney U test with False Discovery Rate (FDR) step down correction. (B) Unsupervised hierarchical clustering of cytokines in blood. (C) Principal component analysis and permutational multivariate analysis of variance (permANOVA) of soluble immune mediators in HIV-infected (pink; n=24) and uninfected (green; n=31) participants. GM-CSF, IL-15, IL-1β, IL-22, IL-4 and IL-6 were excluded as they were below the level of detection. The p values, p ≤ 0.05, p ≤ 0.01, p ≤ 0.001, p ≤ 0.0001 are reported as *, **, *** and ****, respectively.
Figure 4
Figure 4
CXCL10 correlates with HIV viral load and T cell numbers in BAL of HIV-infected individuals. The correlation between CXCL10 concentration and (A) plasma HIV viral load, (B) blood CD4 count in blood, (C) BAL HIV viral load (n=24), (D) BAL CD3, (E) CD4 and (F) CD8 T cell estimates (n=16). Each dot represents an individual. Only individuals with absolute BAL cell count data were plotted. The dotted line indicates linear regression for statistically significant correlations. Statistical analyses were performed using a non-parametric Spearman rank correlation.
Figure 5
Figure 5
T cell activation in BAL and blood. (A) Representative flow cytometry plots of HLA-DR and CD38 expression on T cells in BAL and blood of HIV-infected and uninfected participants. (B) The association between CD4+ T cells expressing CD38 in blood and BAL of HIV-uninfected (n=22) and infected (n=15) individuals. (C) The association between CD8+ T cells expressing CD38 in blood and BAL of HIV-uninfected (n=22) and infected (n=15) individuals. (D) CD38 and HLA-DR expression on CD4+ T cells in blood and BAL of HIV-uninfected (n=31 and n=25, respectively) and infected (n=30 and n=19, respectively) individuals. (E) CD38 and HLA-DR expression on CD8+ T cells in blood and BAL of HIV-uninfected and infected individuals. Each dot represents an individual. Open circles represent HIV-uninfected individuals and filled circles represent HIV-infected individuals. Statistical comparisons were performed using the non-parametric Mann Whitney, Wilcoxon matched pairs and Spearman correlation tests.
Figure 6
Figure 6
Univariate associations between T cell activation markers and cytokine concentrations in BAL of HIV-infected (n=14) and uninfected (n=21) individuals. Spearman rho (r) of the univariate correlation between each cytokine and the expression of activation markers on (A) CD4+ T cells and (B) CD8+ T cells. Open circles represent HIV-uninfected individuals and filled circles represent HIV-infected individuals. Statistically significant correlations (p<0.05) are indicated in darker lines and symbols. Spearman correlation tests, of which Spearman rho and the 95% confidence intervals are reported here. None of the correlations remained statistically significant after adjusting for multiple comparisons by FDR step down procedures. The p values, p ≤ 0.05, p ≤ 0.01, p ≤ 0.001, p ≤ 0.0001 are reported as *, **, *** and ****, respectively.

References

    1. UNAIDS . Fact Sheet HIV Statistics (2020). Available at: https://www.unaids.org/en/resources/fact-sheet.
    1. Crothers K, Huang L, Goulet JL, Goetz MB, Brown ST, Rodriguez-Barradas MC, et al. . HIV Infection and Risk for Incident Pulmonary Diseases in the Combination Antiretroviral Therapy Era. Am J Respir Crit Care Med (2011) 183:388–95. 10.1164/rccm.201006-0836OC - DOI - PMC - PubMed
    1. Meghji J, Miller RF. HIV and the Lung. Med (Baltimore) (2013) 41:435–41. 10.1016/j.mpmed.2013.05.015 - DOI
    1. Drummond MB, Kirk GD, Astemborski J, Marshall MM, Mehta SH, McDyer JF, et al. . Association Between Obstructive Lung Disease and Markers of HIV Infection in a High-Risk Cohort. Thorax (2012) 67:309–14. 10.1136/thoraxjnl-2011-200702 - DOI - PMC - PubMed
    1. Louie JK, Chin Hsu L, Osmond DH, Katz MH, Schwarcz SK. Trends in Causes of Death Among Persons With Acquired Immunodeficiency Syndrome in the Era of Highly Active Antiretroviral Therapy, San Francisco, 1994-1998. J Infect Dis (2002) 186:1023–7. 10.1086/343862 - DOI - PubMed

Publication types