

Speckle-tracking echocardiography in comparison with ejection fraction for prediction of cardiovascular mortality in patients with end-stage renal disease
- PMID: 34276976
- PMCID: PMC8280917
- DOI: 10.1093/ckj/sfaa161
Speckle-tracking echocardiography in comparison with ejection fraction for prediction of cardiovascular mortality in patients with end-stage renal disease
Abstract
Background: Cardiovascular disease is the major cause of death in end-stage renal disease (ESRD). To develop better means to assess cardiovascular risk in these patients, we compared conventional echocardiography-derived left ventricular ejection fraction (EF) with the novel method of 2D speckle-tracking echocardiography to determine cardiac strain.
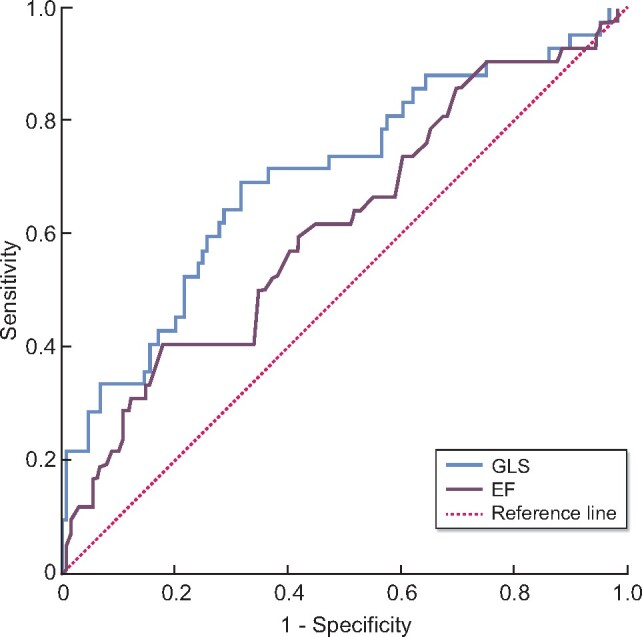
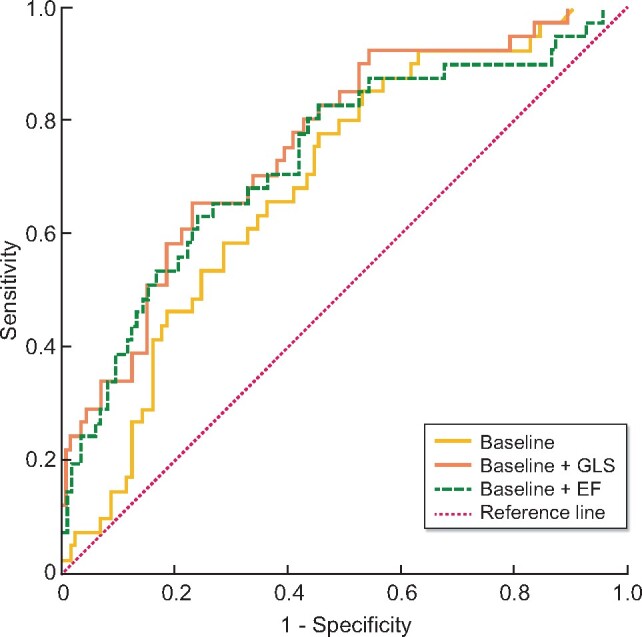
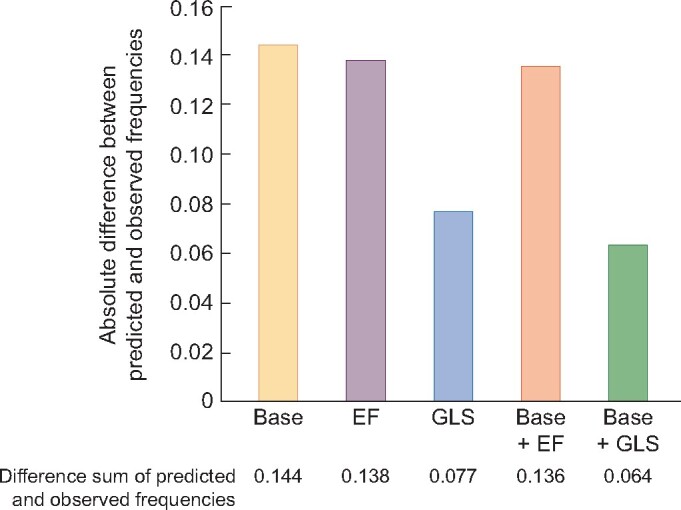
Methods: Predictive performances of conventional EF and speckle-tracking echocardiography-derived global longitudinal strain (GLS) were compared using receiver-operator curve (ROC) analyses and calibration by calibration plots. We also took into account other known cardiovascular risk factors through multivariable logistic regression analysis.
Results: The study comprised 171 ESRD patients (mean age 64 years, 64% male) on maintenance dialysis therapy (93% haemodialysis, 7% peritoneal dialysis) for an average period of 39 months. During 2.1 years of follow-up, 42 patients (25%) died from cardiovascular disease. ROC analysis of GLS resulted in an area under the curve of 0.700 [95% confidence interval (CI) 0.603-0.797] compared with an area under the curve of EF of 0.615 (95% CI 0.514-0.716) (P = 0.059 for difference). The total absolute deviation between predicted and observed outcome frequencies obtained by calibration plots were 13.8% for EF compared with only 6.4% for GLS. Best results of ROC analysis (area under the curve = 0.759; P = 0.06), calibration and goodness-of-fit (χ2 = 28.34, P ≤ 0.0001, R 2 = 0.25) were achieved for GLS added to a baseline model consisting of known cardiovascular risk factors in a multivariate regression analysis.
Conclusions: In summary, in chronic dialysis patients, GLS is a more precise predictor of cardiovascular mortality than conventional echocardiography-derived EF.
Keywords: ESRD; cardiovascular; dialysis; echocardiography; prognosis.
© The Author(s) 2021. Published by Oxford University Press on behalf of ERA-EDTA.
Figures
Comment in
-
Routinely measuring symptom burden and health-related quality of life in dialysis patients: first results from the Dutch registry of patient-reported outcome measures.Clin Kidney J. 2020 Feb 3;14(6):1535-1544. doi: 10.1093/ckj/sfz192. eCollection 2021 Jun. Clin Kidney J. 2020. PMID: 34285801 Free PMC article.
References
-
- McCullough PA, Chan CT, Weinhandl ED et al. Intensive hemodialysis, left ventricular hypertrophy, and cardiovascular disease. Am J Kidney Dis 2016; 68: 5–14 - PubMed
-
- Sarnak MJ, Levey AS, Schoolwerth AC et al. Kidney disease as a risk factor for development of cardiovascular disease: a statement from the American heart association councils on kidney in cardiovascular disease, high blood pressure research, clinical cardiology, and epidemiology and prevention. Hypertension 2003; 42: 1050–1065 - PubMed
-
- Astor BC, Coresh J, Heiss G et al. Kidney function and anemia as risk factors for coronary heart disease and mortality: the Atherosclerosis Risk in Communities (ARIC) Study. Am Heart J 2006; 151: 492–500 - PubMed
-
- Ardhanari S, Alpert MA, Aggarwal K. Cardiovascular disease in chronic kidney disease: risk factors, pathogenesis, and prevention. Adv Perit Dial 2014; 30: 40–53 - PubMed
-
- Al-Dadah A, Omran J, Nusair MB et al. Cardiovascular mortality in dialysis patients. Adv Perit Dial 2012; 28: 56–59 - PubMed
LinkOut - more resources
Full Text Sources
Miscellaneous
