. 2021 Jul 14;10(7):e1305.
doi: 10.1002/cti2.1305. eCollection 2021.

Type 1 conventional dendritic cells and interferons are required for spontaneous CD4+ and CD8+ T-cell protective responses to breast cancer

Affiliations

Type 1 conventional dendritic cells and interferons are required for spontaneous CD4+ and CD8+ T-cell protective responses to breast cancer

Raphaël Mattiuz et al. Clin Transl Immunology. .

Abstract

Objectives: To better understand how immune responses may be harnessed against breast cancer, we investigated which immune cell types and signalling pathways are required for spontaneous control of a mouse model of mammary adenocarcinoma.

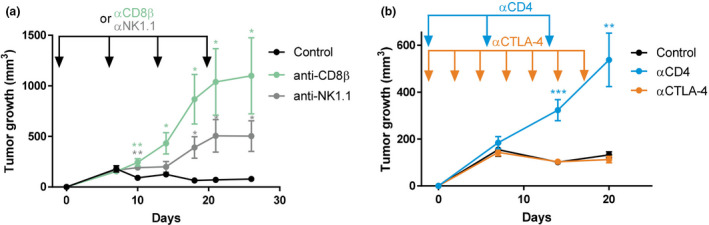
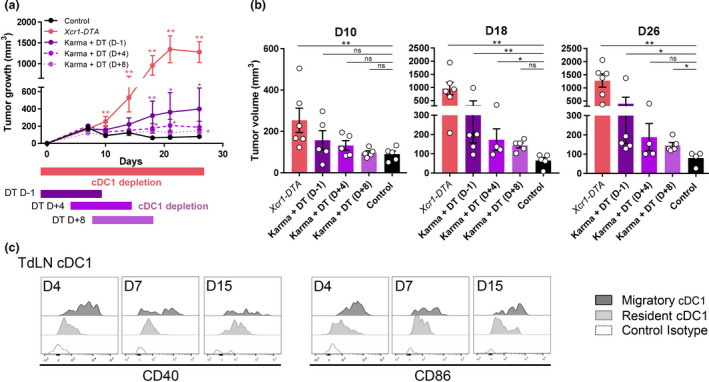
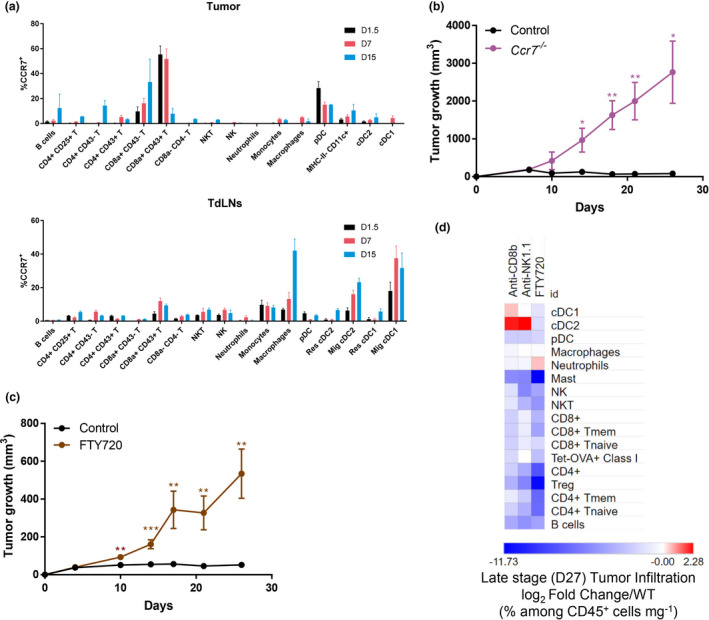
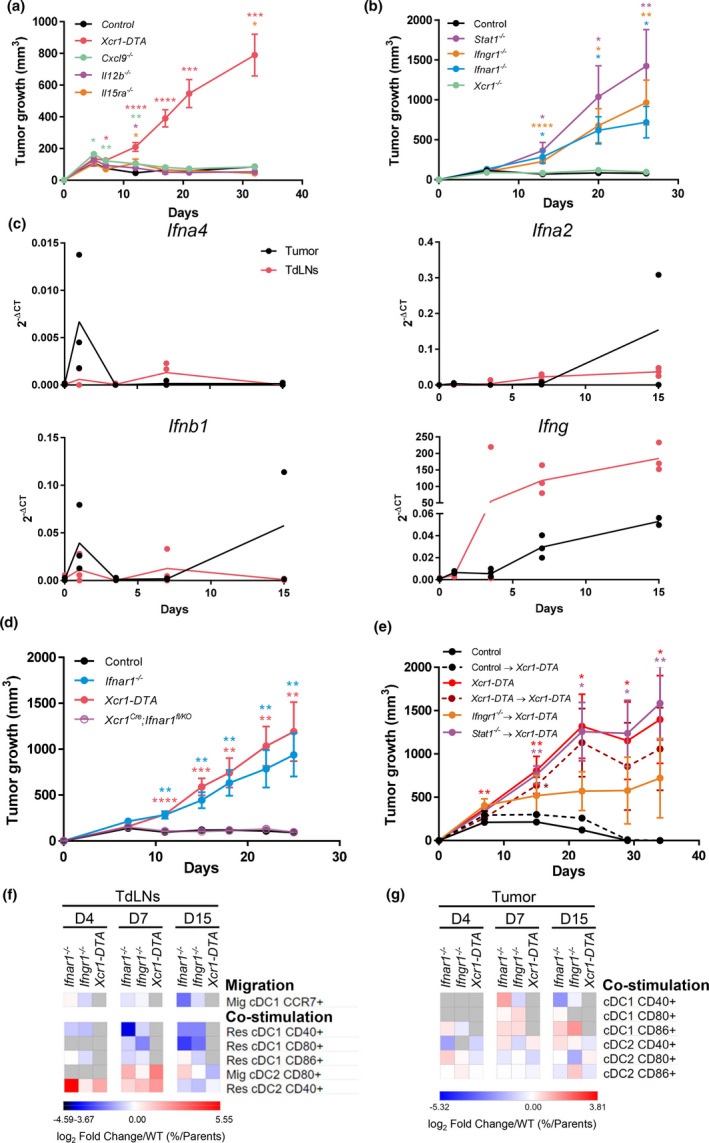
Methods: The NOP23 mammary adenocarcinoma cell line expressing epitopes derived from the ovalbumin model antigen is spontaneously controlled when orthotopically engrafted in syngeneic C57BL/6 mice. We combined this breast cancer model with antibody-mediated depletion of lymphocytes and with mutant mice affected in interferon (IFN) or type 1 conventional dendritic cell (cDC1) responses. We monitored tumor growth and immune infiltration including the activation of cognate ovalbumin-specific T cells.

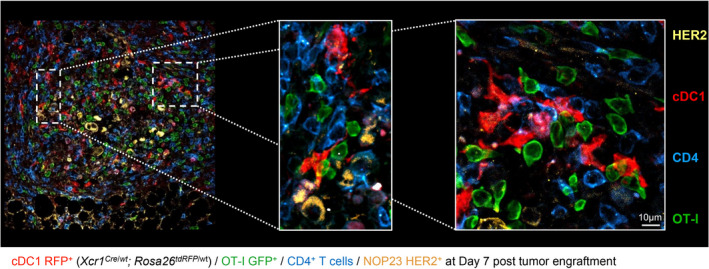
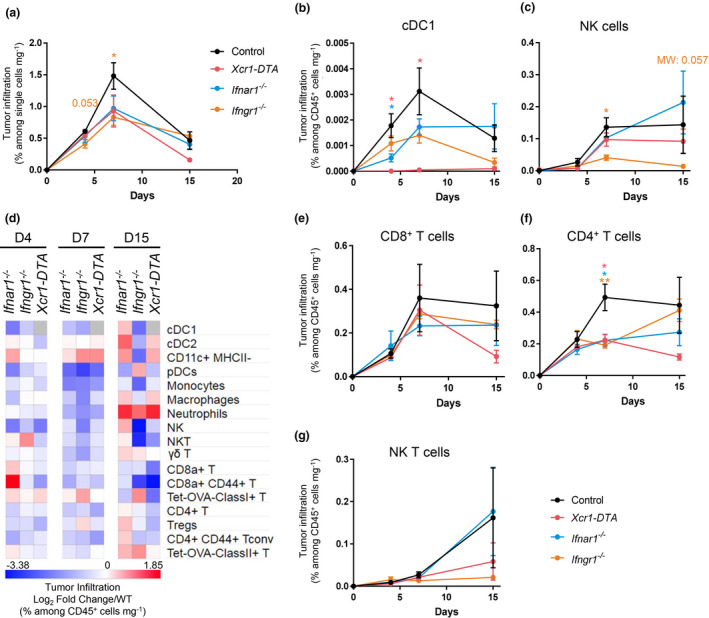
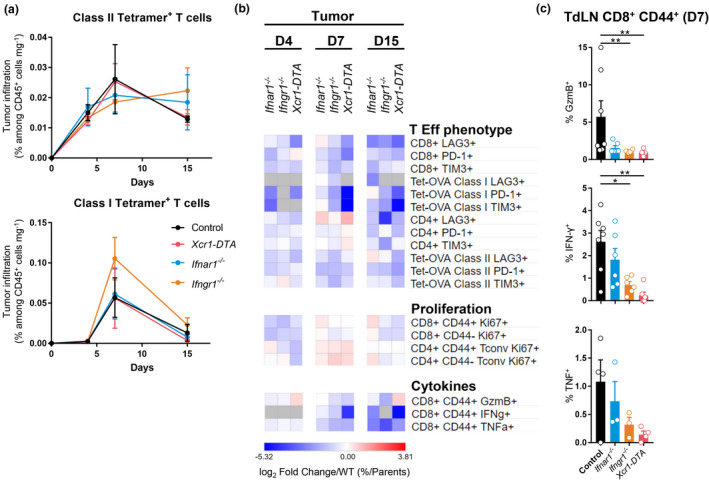
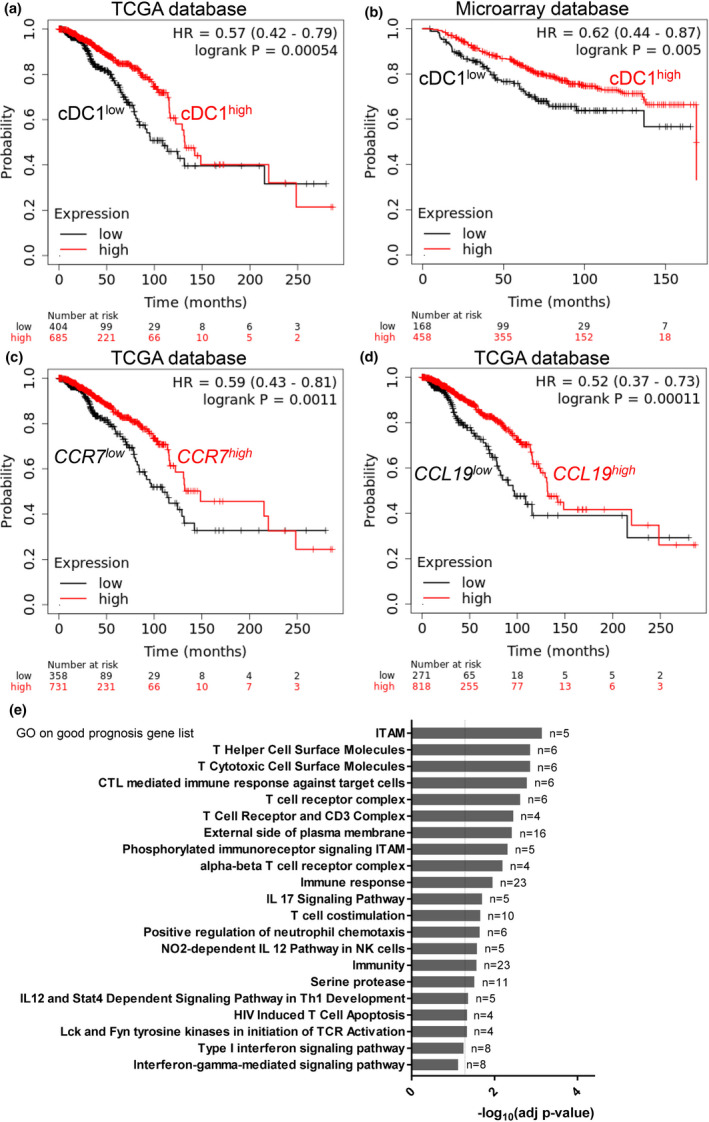
Results: Breast cancer immunosurveillance required cDC1, NK/NK T cells, conventional CD4+ T cells and CD8+ cytotoxic T lymphocytes (CTLs). cDC1 were required constitutively, but especially during T-cell priming. In tumors, cDC1 were interacting simultaneously with CD4+ T cells and tumor-specific CTLs. cDC1 expression of the XCR1 chemokine receptor and of the T-cell-attracting or T-cell-activating cytokines CXCL9, IL-12 and IL-15 was dispensable for tumor rejection, whereas IFN responses were necessary, including cDC1-intrinsic signalling by STAT1 and IFN-γ but not type I IFN (IFN-I). cDC1 and IFNs promoted CD4+ and CD8+ T-cell infiltration, terminal differentiation and effector functions. In breast cancer patients, high intratumor expression of genes specific to cDC1, CTLs, CD4+ T cells or IFN responses is associated with a better prognosis.

Conclusion: Interferons and cDC1 are critical for breast cancer immunosurveillance. IFN-γ plays a prominent role over IFN-I in licensing cDC1 for efficient T-cell activation.

Keywords: CD4+ T cells; CD8+ T cells; IFN‐γ; breast cancer; cDC1; cancer immunosurveillance; interferons.


Conflict of interest statement

The authors declare that they have no competing interests.

Figures

Figure 1
Figure 1
CTL, CD4+ Tconv and NK1.1+ cells are instrumental in spontaneous rejection of breast cancer NOP23. (a) NOP23 tumor growth (mean ± SEM) in the mammary fat pad of female mice treated or not with anti‐CD8β or anti‐NK1.1 mAb at the indicated time (arrows) with the first injection given 1 day before tumor engraftment. One experiment representative of at least 2 independent ones with 5 mice per group is shown. (b) NOP23 tumor growth (mean ± SEM) in female mice treated or not with anti‐CD4 (once a week) or anti‐CTLA‐4 (every 3 days) mAb at the indicated time (arrows) with the first injection given 1 day before tumor engraftment. n = 7 mice per group. *, P < 0.05; **, P < 0.01; and ***, P < 0.001; unpaired t‐test.
Figure 2
Figure 2
cDC1 are instrumental in spontaneous rejection of breast cancer NOP23, especially during the phase of T‐cell priming. (a) Tumor growth (mean ± SEM) in control (n = 5), in constitutively cDC1‐depleted (Xcr1‐DTA, n = 6) or conditionally cDC1‐depleted (Karma‐tmt‐DTR + DT) female mice. Karma‐tmt‐DTR mice were injected 4 times with DT every 60 h, starting 1 day before engraftment (n = 5, representative of 3 independent datasets), at d + 4 post‐engraftment (n = 5, representative of 2 independent datasets) or at d + 8 post‐engraftment (n = 5, representative of 2 independent datasets). (b) Tumor volumes as measured in a at days 10, 18 and 26. Data are shown as mean ± SEM, with values for individual mice shown as white circles. ns, not significant (P > 0.05); *, P < 0.05; **, P < 0.01; and ***, P < 0.001; non‐parametric Mann–Whitney U‐test. (c) Analysis of CD40 and CD86 expression by flow cytometry on TdLN Mig‐cDC1 and Res‐cDC1. The data shown are from one experiment representative of two independent ones.
Figure 3
Figure 3
Trafficking of immune cells into and out of the TdLNs is instrumental in breast cancer spontaneous rejection. (a) Kinetics of CCR7 expression amongst immune populations in control tumor and TdLNs (2–6 mice per time point, data are shown as mean ± SEM). T cells were split into different phenotypic populations known to be associated with their activation state, including expression of the glycosylated isoform of CD43 that is specifically expressed on effector T cells, in particular cytotoxic CD8+ T cells. (b) Tumor growth (mean ± SEM) of Ccr7 −/− (n = 3) and control (n = 5) females. One experiment representative of two independent ones is shown. (c) Tumor growth (mean ± SEM) of FTY720‐treated (n = 7) and untreated (control, n = 7) female mice. One experiment representative of two independent ones is shown. (d) Heatmap representing the immune landscapes in d27 tumors in CD8+ T‐cell‐depleted (anti‐CD8β), in NK cell‐depleted (anti‐NK1.1) or in FTY720‐treated females compared with control. The data are shown as log2 fold changes of the %Population/CD45+/mg of tumor in analysed animals compared with WT. n = 3 or 4 mice per group. *, P < 0.05; **, P < 0.01; and ***, P < 0.001; unpaired t‐test.
Figure 4
Figure 4
cDC1 interact with CD4+ T and tumor‐specific CD8+ T cells together in the tumor microenvironment. Xcr1Cre / wt ; Rosa26tdRFP / wt mice were adoptively transferred with 1000 GFP+ OT‐I cells 1 day prior to tumor engraftment. 7d post‐engraftment, tumors sections were stained for RFP expression (cDC1), GFP (OT‐I), CD4 (CD4+ T cells) and HER2 (NOP23 cells). This image is representative of 5 individual mice.
Figure 5
Figure 5
IFNs and cDC1‐intrinsic IFN‐γ and STAT1 signalling are necessary for breast cancer spontaneous rejection. (a) Tumor growth (mean ± SEM) in Xcr1‐DTA (n = 10), Cxcl9 −/− (n = 9), Il12b −/− (n = 6), Il15ra −/− (n = 5) and control (n = 8) female mice. One experiment representative of two independent ones is shown. (b) Tumor growth (mean ± SEM) in Xcr1 −/− (n = 4), Ifnar1 −/− (n = 7), Ifngr1 −/− (n = 5), Stat1 −/− (n = 5) and control (n = 6) female mice. One experiment representative of at least 2 independent ones is shown. (c) Expression analysis of the Ifna4, Ifna2, Ifnb and Ifng genes in control tumors and their TdLNs (n = 2‐4) by qPCR. (d) Tumor growth (mean ± SEM) in Xcr1‐DTA (n = 7), Ifnar1 −/− (n = 8), Xcr1cre ; Ifnar1fl / KO (n = 13) and control (n = 7) female mice. One experiment representative of two independent ones is shown. (e) Tumor growth (mean ± SEM) in different types of shield bone marrow chimeric female mice, control→Xcr1‐DTA (n = 4), Xcr1‐DTAXcr1‐DTA (n = 4), Ifngr1 −/−Xcr1‐DTA (n = 4) and Stat1 −/−Xcr1‐DTA (n = 4). Xcr1‐DTA (n = 5) and control (n = 5) female mice were used as controls. One experiment representative of two independent ones is shown. *, P < 0.05; **, P < 0.01; ***, P < 0.001; and ****, P < 0.0001; unpaired t‐test. (f, g) Heatmaps representing the expression of costimulatory receptors on lymphoid‐resident (Res) and migratory (Mig) cDC1 and cDC2 in the TdLNs (f) and tumors (g) at d4, d7 and d15 after engraftment in Ifnar1 −/−, Ifngr1 −/− and Xcr1‐DTA compared with control mice. The data are shown as log2 fold changes in the ratio of % Population/Parent population from mutant animals to WT (n = 3–6 mice per group). The data shown are from two independent experiments pooled together.
Figure 6
Figure 6
cDC1, type I IFN and type II IFN signalling shape the tumor immune landscape. (a) Kinetics of the tumor infiltration by CD45+ cells at d4, d7 and d15, in control, Ifnar1 −/−, Ifngr1 −/− and Xcr1‐DTA mice, as assessed by flow cytometry. (b, c) Kinetics of the tumor infiltration by cDC1 (b) and NK cells (c) at d4, d7 and d15, in control, Ifnar1 −/−, Ifngr1 −/− and Xcr1‐DTA mice. (d) Heatmap representing the tumor immune landscapes in Ifnar1 −/−, Ifngr1 −/− and Xcr1‐DTA mice at d4, d7 and d15. The data are shown as log2 fold changes calculated as the ratio of % Population/CD45+/mg of tumor from mutant animals to WT (n = 3–6 mice per group). The data shown are from two independent experiments pooled together. (e–g) Kinetics of the tumor infiltration by CD8+ T cells (e), CD4+ T cells (f) and NK T cells (g) in control, Ifnar1 −/−, Ifngr1 −/− and Xcr1‐DTA mice. For ac, eg, the data shown (mean ± SEM) are from two independent experiments pooled together (n = 3‐6 mice per group). For ac, eg, data are shown as mean ± SEM. ns, not significant (P > 0.05); *, P < 0.05; **, P < 0.01; and ***, P < 0.001 according to the unpaired t‐test or non‐parametric Mann–Whitney U‐test (MW) when specified.
Figure 7
Figure 7
cDC1, type I IFN and type II IFN signalling are necessary for CD4+ and CD8+ T‐cell terminal activation and effector functions in the TME. (a) Kinetics of the tumor infiltration by Ag‐specific CD4+ (up) and CD8+ (bottom) T cells at d4, d7 and d15 in Ifnar1 −/−, Ifngr1 −/− Xcr1‐DTA and control mice. The data shown (mean ± SEM) are from two independent experiments pooled together (n = 3–6 mice per group). (b) Heatmap representing T‐cell effector phenotype and proliferation, and CTL cytokine production. The data are shown as log2 fold changes in the ratio of % Population/Parent population from mutant animals to WT (n = 3–6 mice per group). (c) Expression of GzmB, IFN‐γ and TNF by OVA‐specific CD44+ CD8+ T cells in the TdLN of Ifnar1 −/−, Ifngr1 −/−, Xcr1‐DTA and control mice day 7 post‐engraftment. The data shown are from two independent experiments pooled together. For a and c, data are shown as mean ± SEM, with values for individual mice shown as white circles in (c). *, P < 0.05; **, P < 0.01; and ***, P < 0.001; non‐parametric Mann–Whitney U‐test.
Figure 8
Figure 8
Intratumor expression of a cDC1 transcriptomic fingerprint and gene ontology annotations linked to CTL, helper T‐cell and IFN‐I/II signalling are all associated with a better prognosis in human breast cancer patients. (a, b) The Kaplan–Meier plot for human breast cancer patients based on the expression levels of a cDC1 gene signature in their tumor, for the TCGA data set (a) and for an independent compendium of breast cancer microarrays (b). (c, d) The Kaplan–Meier plot for the TCGA human breast cancer patients based on the expression levels of CCR7 (c) or CCL19 (d) in their tumor. (e) Gene Ontology analysis of a breast cancer good prognosis gene list. ad were generated by using the KM plotter Web resource; e was retrieved from the Human Protein Atlas Web resource.

References

    1. Guilliams M, Ginhoux F, Jakubzick C et al. Dendritic cells, monocytes and macrophages: a unified nomenclature based on ontogeny. Nat Rev Immunol 2014; 14: 571–578. - PMC - PubMed
    1. Vu Manh TP, Bertho N, Hosmalin A, Schwartz‐Cornil I, Dalod M. Investigating evolutionary conservation of dendritic cell subset identity and functions. Front Immunol 2015; 6: 260. - PMC - PubMed
    1. Sancho D, Joffre OP, Keller AM et al. Identification of a dendritic cell receptor that couples sensing of necrosis to immunity. Nature 2009; 458: 899–903. - PMC - PubMed
    1. Theisen DJ, Davidson JT, Briseño CG et al. WDFY4 is required for cross‐presentation in response to viral and tumor antigens. Science 2018; 362: 694–699. - PMC - PubMed
    1. Laoui D, Keirsse J, Morias Y et al. The tumour microenvironment harbours ontogenically distinct dendritic cell populations with opposing effects on tumour immunity. Nat Commun 2016; 7: 13720. - PMC - PubMed