. 2021 Jul 14;8(7):210530.
doi: 10.1098/rsos.210530. eCollection 2021 Jul.

Vaccine escape in a heterogeneous population: insights for SARS-CoV-2 from a simple model

Affiliations

Vaccine escape in a heterogeneous population: insights for SARS-CoV-2 from a simple model

Julia R Gog et al. R Soc Open Sci. .

Abstract

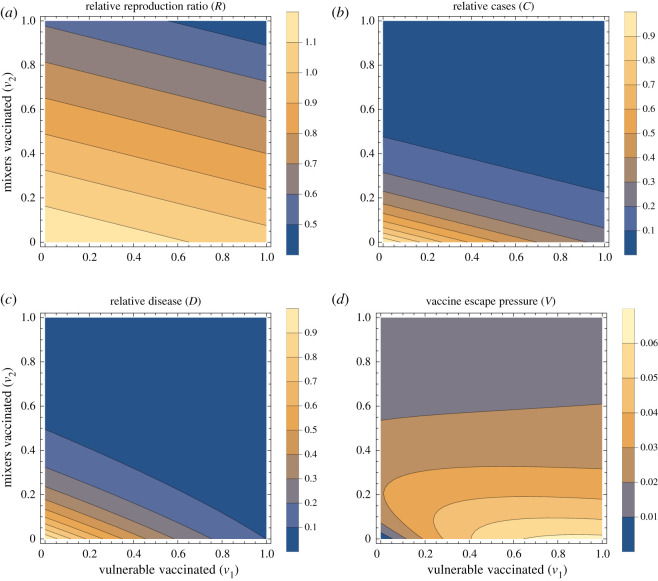
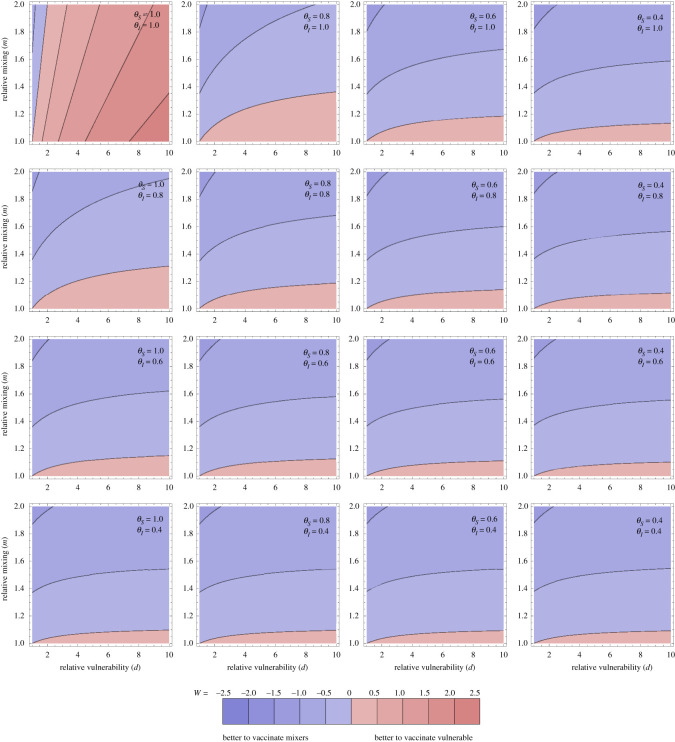
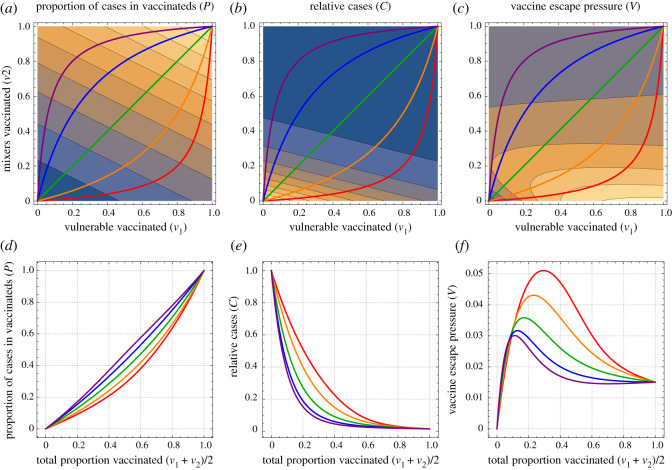
As a countermeasure to the SARS-CoV-2 pandemic, there has been swift development and clinical trial assessment of candidate vaccines, with subsequent deployment as part of mass vaccination campaigns. However, the SARS-CoV-2 virus has demonstrated the ability to mutate and develop variants, which can modify epidemiological properties and potentially also the effectiveness of vaccines. The widespread deployment of highly effective vaccines may rapidly exert selection pressure on the SARS-CoV-2 virus directed towards mutations that escape the vaccine-induced immune response. This is particularly concerning while infection is widespread. By developing and analysing a mathematical model of two population groupings with differing vulnerability and contact rates, we explore the impact of the deployment of vaccines among the population on the reproduction ratio, cases, disease abundance and vaccine escape pressure. The results from this model illustrate two insights: (i) vaccination aimed at reducing prevalence could be more effective at reducing disease than directly vaccinating the vulnerable; (ii) the highest risk for vaccine escape can occur at intermediate levels of vaccination. This work demonstrates a key principle: the careful targeting of vaccines towards particular population groups could reduce disease as much as possible while limiting the risk of vaccine escape.

Keywords: COVID-19; SARS-CoV-2; heterogeneous population; policy; vaccine; vaccine escape.


Figures

Figure 1.
Figure 1.
Summary outputs. Summary outputs for a fixed set of population parameters (m = 2, d = 10), vaccine parameters (θS = 0.6, θI = 0.6, θD = 0.3) and scenario under consideration (R0 = 1.2, G = 15). Four output measures are shown, relative reproduction ratio R[v1, v2] (a), relative cases C[v1, v2] (b), relative disease D[v1, v2] (c), and vaccine escape pressure V[v1, v2] (d). All four panels are shown as contour plots with horizontal and vertical axes representing the proportion of vulnerable and mixers vaccinated (v1 and v2, respectively).
Figure 2.
Figure 2.
Optimal allocation for averting disease. Optimal allocation for averting disease (as measured by W: logged ratio of disease averted by vaccinating the vulnerable compared with the mixers). Individual panels explore the population parameters (vulnerability d and mixing m on horizontal and vertical axes). The contour values are kept fixed between the plots, with the contour for ratio 1 between the blue and red, and meeting the bottom left of every panel (where m = d = 1 so the population is homogeneous). More disease is averted by vaccinating the vulnerable than the mixers in the pink regions and vice versa in the blue regions. Different panels vary the effects of the vaccine: the rows step through θI = 1, 0.8, 0.6, 0.4 and the columns step through θS = 1, 0.8, 0.6, 0.4. Through all panels, θD = 0.3. Thus the top left panel corresponds to the vaccine having no transmission-blocking effects at all, and stepping right and down increases transmission-blocking through reduced susceptibility or infectivity. ε = 0.1. All other parameters are as in figure 1.
Figure 3.
Figure 3.
One-dimensional paths to explore vaccine escape. The left pair of plots show the proportion of cases that are among those vaccinated, the middle pair give the total number of cases (relative to if there was no vaccination) and the right pair give the vaccine escape pressure. All parameters are as in figure 1. The top row shows all of these as functions of the proportion of vulnerable and mixers vaccinated (v1 and v2, respectively, on horizontal and vertical axes). The coloured lines show five one-dimensional paths, as the total number vaccinated varies from none to all of the population, taking different routes in terms of the mix of vulnerable and mixers. The lower plots correspond to outputs on those one-dimensional paths. The proportion of cases in vaccinated people increases as a function of the proportion vaccinated, while the total number of cases decreases. The product of these gives a measure of vaccine pressure that is maximal for intermediate levels of vaccination.

References

    1. World Health Organization. 2021 Coronavirus disease (COVID-19) weekly epidemiological update – 9 March 2021. www.who.int/docs/default-source/coronaviruse/situation-reports/20210309_... (accessed 12 March 2021).
    1. London School of Hygiene & Tropical Medicine. 2021 COVID-19 vaccine tracker – Living review. https://vac-lshtm.shinyapps.io/ncov_vaccine_landscape/ (accessed 12 March 2021).
    1. Polack FP et al. 2020. Safety and efficacy of the BNT162b2 mRNA COVID-19 vaccine. N. Engl. J. Med. 383, 2603-2615. (10.1056/NEJMoa2034577) - DOI - PMC - PubMed
    1. Baden LR et al. 2021. Efficacy and safety of the mRNA-1273 SARS-CoV-2 vaccine. N. Engl. J. Med. 384, 403-416. (10.1056/NEJMoa2035389) - DOI - PMC - PubMed
    1. Public Health England. 2021 Investigation of SARS-CoV-2 variants of concern in England: Technical briefing 6. https://assets.publishing.service.gov.uk/government/uploads/system/uploa... (accessed 12 March 2021).