

Combination of Blood Routine Examination and T-SPOT.TB Assay for Distinguishing Between Active Tuberculosis and Latent Tuberculosis Infection
- PMID: 34277462
- PMCID: PMC8279757
- DOI: 10.3389/fcimb.2021.575650
Combination of Blood Routine Examination and T-SPOT.TB Assay for Distinguishing Between Active Tuberculosis and Latent Tuberculosis Infection
Abstract
Background: Distinguishing between active tuberculosis (ATB) and latent tuberculosis infection (LTBI) remains challenging.
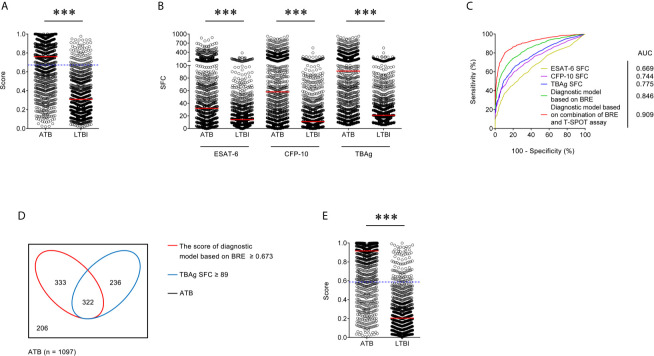
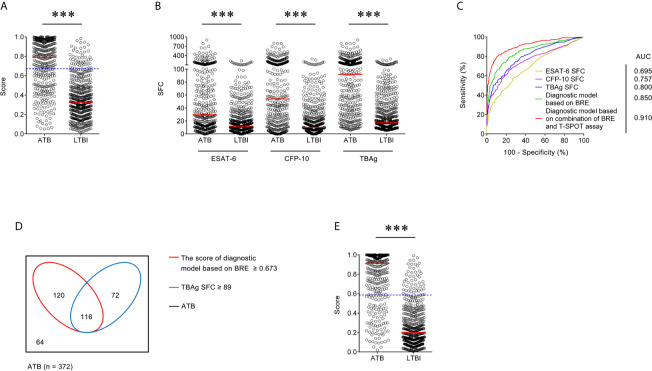
Methods: Between 2013 and 2019, 2,059 (1,097 ATB and 962 LTBI) and another 883 (372 ATB and 511 LTBI) participants were recruited based on positive T-SPOT.TB (T-SPOT) results from Qiaokou (training) and Caidian (validation) cohorts, respectively. Blood routine examination (BRE) was performed simultaneously. Diagnostic model was established according to multivariate logistic regression.
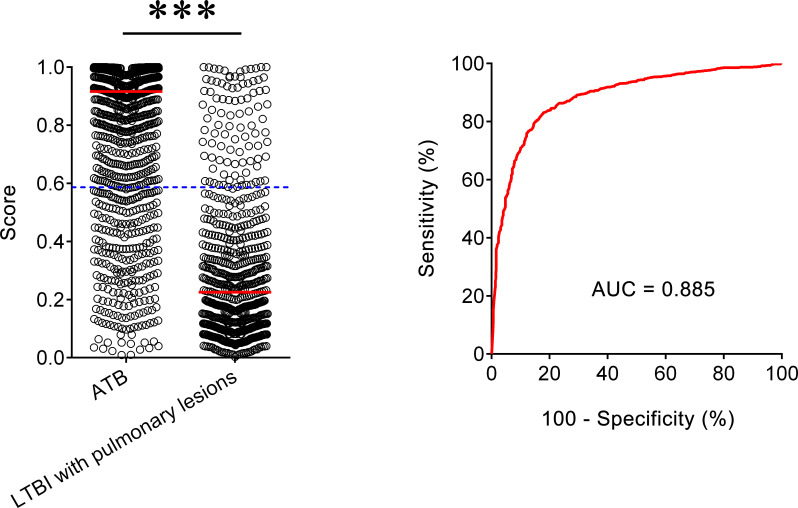
Results: Significant differences were observed in all indicators of BRE and T-SPOT assay between ATB and LTBI. Diagnostic model built on BRE showed area under the curve (AUC) of 0.846 and 0.850 for discriminating ATB from LTBI in the training and validation cohorts, respectively. Meanwhile, TB-specific antigens spot-forming cells (SFC) (the larger of early secreted antigenic target 6 and culture filtrate protein 10 SFC in T-SPOT assay) produced lower AUC of 0.775 and 0.800 in the training and validation cohorts, respectively. The diagnostic model based on combination of BRE and T-SPOT showed an AUC of 0.909 for differentiating ATB from LTBI, with 78.03% sensitivity and 90.23% specificity when a cutoff value of 0.587 was used in the training cohort. Application of the model to the validation cohort showed similar performance. The AUC, sensitivity, and specificity were 0.910, 78.23%, and 90.02%, respectively. Furthermore, we also assessed the performance of our model in differentiating ATB from LTBI with lung lesions. Receiver operating characteristic analysis showed that the AUC of established model was 0.885, while a threshold of 0.587 yield a sensitivity of 78.03% and a specificity of 85.69%, respectively.
Conclusions: The diagnostic model based on combination of BRE and T-SPOT could provide a reliable differentiation between ATB and LTBI.
Keywords: T-SPOT.TB; active tuberculosis; blood routine examination; diagnostic model; differential diagnosis; latent tuberculosis infection.
Copyright © 2021 Luo, Tang, Yuan, Lin, Mao, Song, Xue, Wu, Ouyang, Hou, Wang and Sun.
Conflict of interest statement
The authors declare that the research was conducted in the absence of any commercial or financial relationships that could be construed as a potential conflict of interest.
Figures
Similar articles
-
Combination of mean spot sizes of ESAT-6 spot-forming cells and modified tuberculosis-specific antigen/phytohemagglutinin ratio of T-SPOT.TB assay in distinguishing between active tuberculosis and latent tuberculosis infection.J Infect. 2020 Jul;81(1):81-89. doi: 10.1016/j.jinf.2020.04.038. Epub 2020 Apr 30. J Infect. 2020. PMID: 32360883
-
A combination of iron metabolism indexes and tuberculosis-specific antigen/phytohemagglutinin ratio for distinguishing active tuberculosis from latent tuberculosis infection.Int J Infect Dis. 2020 Aug;97:190-196. doi: 10.1016/j.ijid.2020.05.109. Epub 2020 Jun 2. Int J Infect Dis. 2020. PMID: 32497795
-
Combination of HLA-DR on Mycobacterium tuberculosis-Specific Cells and Tuberculosis Antigen/Phytohemagglutinin Ratio for Discriminating Active Tuberculosis From Latent Tuberculosis Infection.Front Immunol. 2021 Nov 11;12:761209. doi: 10.3389/fimmu.2021.761209. eCollection 2021. Front Immunol. 2021. PMID: 34858413 Free PMC article.
-
Mycobacterial heparin-binding hemagglutinin (HBHA)-induced interferon-γ release assay (IGRA) for discrimination of latent and active tuberculosis: A systematic review and meta-analysis.PLoS One. 2021 Jul 16;16(7):e0254571. doi: 10.1371/journal.pone.0254571. eCollection 2021. PLoS One. 2021. PMID: 34270559 Free PMC article.
-
[Evolution of IGRA researches].Kekkaku. 2008 Sep;83(9):641-52. Kekkaku. 2008. PMID: 18979999 Review. Japanese.
Cited by
-
A scoring system developed from a nomogram to differentiate active pulmonary tuberculosis from inactive pulmonary tuberculosis.Front Cell Infect Microbiol. 2022 Sep 2;12:947954. doi: 10.3389/fcimb.2022.947954. eCollection 2022. Front Cell Infect Microbiol. 2022. PMID: 36118035 Free PMC article.
-
Tuberculosis Diagnosis: Current, Ongoing, and Future Approaches.Diseases. 2024 Sep 3;12(9):202. doi: 10.3390/diseases12090202. Diseases. 2024. PMID: 39329871 Free PMC article. Review.
-
Development and validation of a diagnostic model to differentiate spinal tuberculosis from pyogenic spondylitis by combining multiple machine learning algorithms.Biomol Biomed. 2024 Mar 11;24(2):401-410. doi: 10.17305/bb.2023.9663. Biomol Biomed. 2024. PMID: 37897663 Free PMC article.
-
Machine Learning-Based Prediction of In-Hospital Mortality in Severe COVID-19 Patients Using Hematological Markers.Can J Infect Dis Med Microbiol. 2025 May 12;2025:6606842. doi: 10.1155/cjid/6606842. eCollection 2025. Can J Infect Dis Med Microbiol. 2025. PMID: 40391097 Free PMC article.
-
Systemic vasculitis with latent tuberculosis infection and associated factors: a cross-sectional multicenter study.Clin Rheumatol. 2025 Mar;44(3):1269-1277. doi: 10.1007/s10067-024-07279-7. Epub 2025 Jan 21. Clin Rheumatol. 2025. PMID: 39838164 Free PMC article.
References
-
- Cegielski J. P., McMurray D. N. (2004). The Relationship Between Malnutrition and Tuberculosis: Evidence From Studies in Humans and Experimental Animals. Int. J. Tuberc. Lung Dis. 8 (3), 286–298. - PubMed
Publication types
MeSH terms
Substances
LinkOut - more resources
Full Text Sources
Medical