

Efficacy of Photobiomodulation and Metformin on Diabetic Cell Line of Human Periodontal Ligament Stem Cells through Keap1/Nrf2/Ho-1 Pathway
- PMID: 34277866
- PMCID: PMC8279709
- DOI: 10.52547/rbmb.10.1.30
Efficacy of Photobiomodulation and Metformin on Diabetic Cell Line of Human Periodontal Ligament Stem Cells through Keap1/Nrf2/Ho-1 Pathway
Abstract
Background: Diabetes mellitus (DM) is a metabolic disorder resulting from hyperglycemia. Hyperglycemia contributes to oxidative stress, and the release of advanced glycation end products (AGEs) further promotes disease pathogenesis. Uncontrolled diabetes reflects great oral complications and affects human oral health. So, the present study aimed to assess the effects of photobiomodulation therapy (PBMT) and Metformin on proliferation and viability of human periodontal ligament stem cells (HPDLSCs) cultured in high glucose medium.
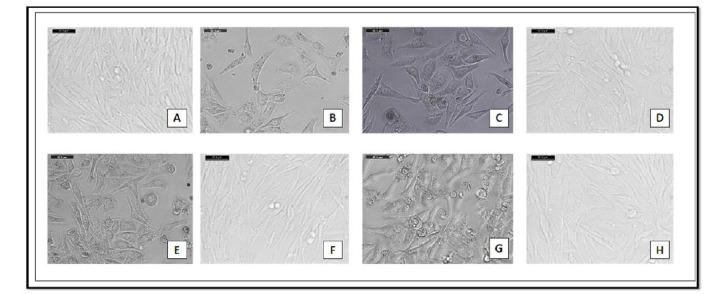
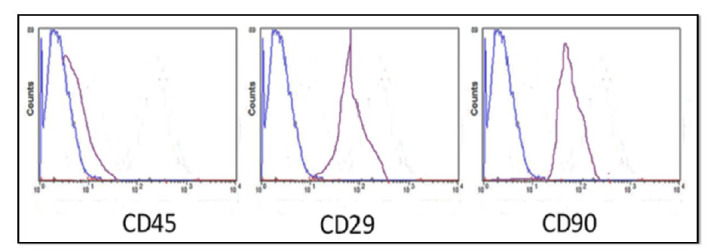
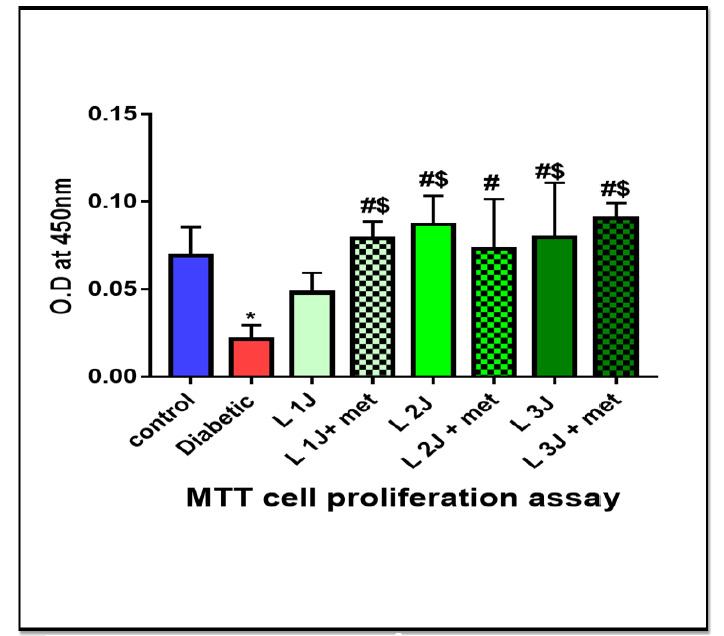
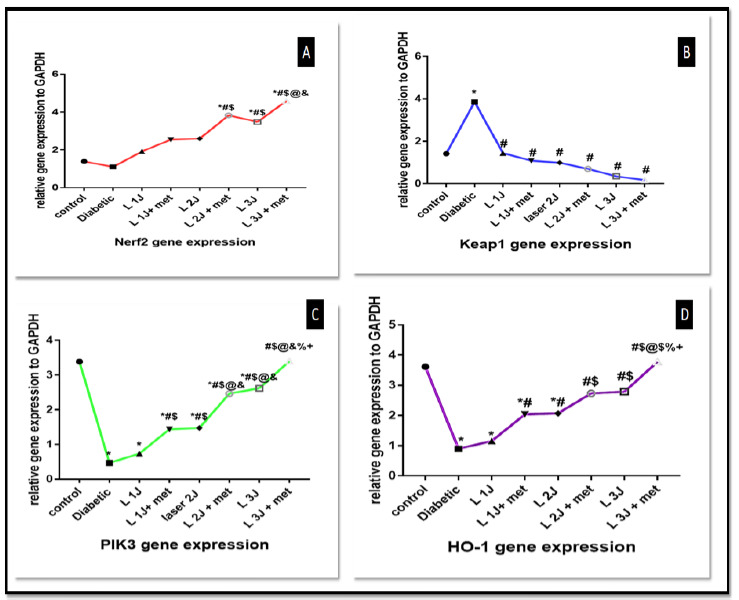
Methods: HPDLSCs were collected, isolated, and characterized and then divided into eight groups. Addition of extra glucose to diabetic groups 24 hours before cell irradiations. Metformin was added to half of the diabetic groups. Cells were irradiated with 808 nm diode laser 24, 48 hours. Cell viability was analyzed with MTT assay 24 hours post-irradiation to detect cell viability in each group. Real-time (PCR) was used to evaluate gene expression of Nrf2, Keap1, PIK3, and HO-1 and the effect of PBMT on Keap1/Nrf2/Ho-1 Pathway. ELISA reader was used to evaluating cell viability through (ROS, TNF-α, IL-10) protein levels after cell irradiation.
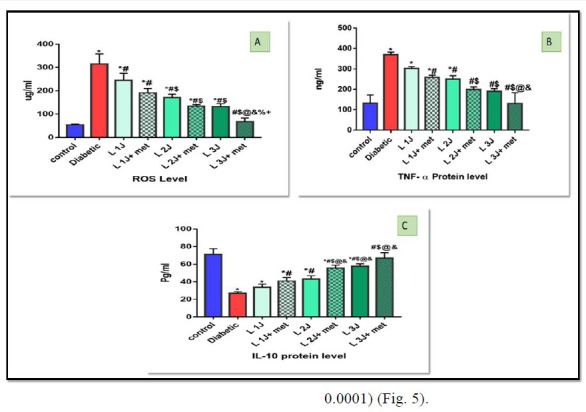
Results: Photobiomodulation at 1, 2, and 3 J/cm2 combined with metformin significantly promoted diabetic cell lines of HPDLSCs viability (in MTT assay and ELISA reader of ROS, TNF-α, IL-10 results) and gene expression of Nrf2, Keap1, PIK3, and HO-1 levels (p< 0.05).
Conclusion: photobiomodulation with 3 J/cm2 combined with metformin enhanced proliferation and viability of diabetic cell lines of HPDLSCs and thus could improve differentiation and function of diabetic cell lines of HPDLSCs with minimum side effects.
Keywords: Diabetes Mellitus; Metformin; Periodontal Ligament Stem Cells; Photobiomodulation.
Figures
References
-
- Eliasson B, Cederholm J. The gap between guidelines and reality: Type 2 diabetes in a National Diabetes Register 1996-2003. Diabet Med. 2005;22(10):1420, 6. - PubMed
-
- (2) Classification and diagnosis of diabetes. . Diabetes Care. 2015;38(Supplement 1):S8, S16. American Diabetes Association. - PubMed
-
- Bryant W, Green field JR, Chisholm DJ, Campbell LV. Diabetes guidelines: easier to preach than to practice?. . Med J Aust. 2006;185(6):305, 9. - PubMed
-
- Vernillo AT. Diabetes mellitus: relevance to dental treatment. . Oral Surg Oral Med Oral Pathol Oral Radiol Endo. . 2001;91(3):263–70. - PubMed
LinkOut - more resources
Full Text Sources