. 2020 Jul 1;7(7):746-754.
doi: 10.1364/OPTICA.392878. eCollection 2020 Jul 20.

Reversible optical tuning of GeSbTe phase-change metasurface spectral filters for mid-wave infrared imaging

Affiliations

Reversible optical tuning of GeSbTe phase-change metasurface spectral filters for mid-wave infrared imaging

Matthew N Julian et al. Optica. .

Abstract

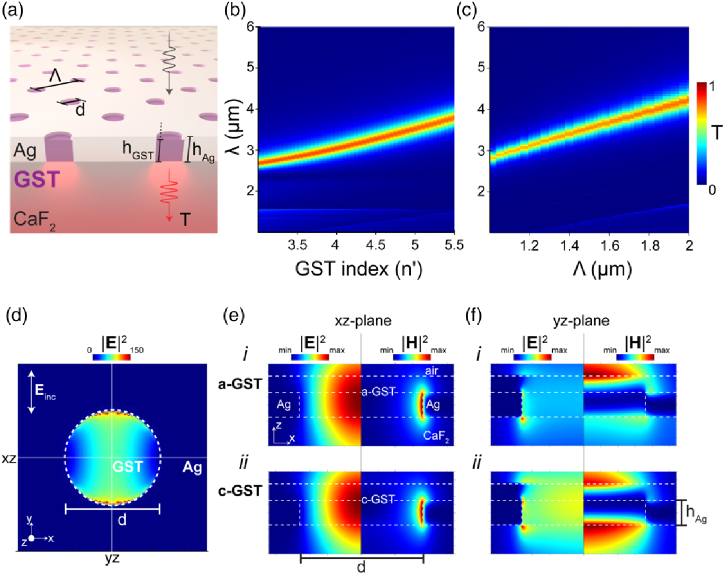
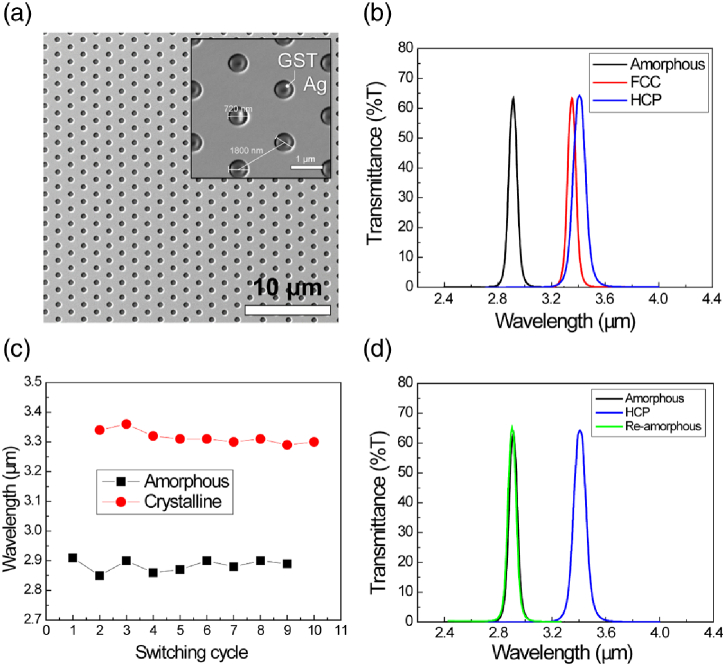
Tunable narrowband spectral filtering across arbitrary optical wavebands is highly desirable in a plethora of applications, from chemical sensing and hyperspectral imaging to infrared astronomy. Yet, the ability to reconfigure the optical properties, with full reversibility, of a solid-state large-area narrowband filter remains elusive. Existing solutions require either moving parts, have slow response times, or provide limited spectral coverage. Here, we demonstrate a 1-inch diameter continuously tunable, fully reversible, all-solid-state, narrowband phase-change metasurface filter based on a GeSbTe-225 (GST)-embedded plasmonic nanohole array. The passband of the presented device is 74 n m with 70 % transmittance and operates across the 3-5 µm thermal imaging waveband. Continuous, reconfigurable tuning is achieved by exploiting intermediate GST phases via optical switching with a single nanosecond laser pulse, and material stability is verified through multiple switching cycles. We further demonstrate multispectral thermal imaging in the mid-wave infrared using our active phase-change metasurfaces. Our results pave the way for highly functional, reduced power, compact hyperspectral imaging systems and customizable optical filters for real-world system integration.


Conflict of interest statement

The authors declare no conflicts of interest.

Figures

Fig. 1.
Fig. 1.
Thin-film GST characterization. XRD (a)–(c) and ellipsometry (d), (e) data for a-GST (black curves), FCC c-GST (red curves), and HCP c-GST (blue curves). The average Δ n is 2.0 between a-GST and c-GST, with HCP c-GST exhibiting slightly higher refractive index and extinction coefficient compared to FCC c-GST. (f) SEM cross-section image of the GST film deposited on CaF2. The inset shows a top-view energy-dispersive x-ray spectroscopy (EDS) mapping of the film edge, showing the clear presence of Ge, Sb, and Te species.
Fig. 2.
Fig. 2.
Device concept. Tunable GST-plasmonic nanohole array metasurface for the MWIR waveband. The MWIR optical input is imaged through GST-PNA filer in its initial, amorphous state (a), with initial center wavelength, λ 1. Through a laser pulse incident on the GST-PNA active area, the GST crystallinity is modified (phase change), and the resultant transmission response (center wavelength, with initial center wavelength, λ N) is spectrally shifted (b). This behavior is summarized in (c), whereby the pump energy controls GST-state, which in turn changes its refractive index, hence spectrally shifts the center wavelength from the resonant PNA. A “reset pulse” returns the GST to its initial state, thus device to initial transmission center wavelength.
Fig. 3.
Fig. 3.
FDTD simulations of the optical response of the GST-PNA concept (a). Simulated transmission response of the GST-PNA device as a function of GST refractive index (b), and as a function of hole period (c), for hAg=60nm metal film thickness and d=0.4× Λ . E-field plot (d) showing SPR-generated field enhancement on-resonance at the boundary between Ag/GST inside the PNA cavity. (e), (f) E- and H-field enhancement plots, on-resonance in respective states, of the GST-PNA at xz and zy cross-section slices of a single hole in an array, in amorphous (i) and crystalline (ii) GST states, where Λ =period, d=hole diameter=720nm, and the experimentally derived GST complex refractive index data in Figs. 1(d) and 1(e) utilized inside the hole array. Source injection from CaF2 side.
Fig. 4.
Fig. 4.
GST-PNA device tuning. (a) SEM micrographs of the fabricated tunable GST-PNA metasurface device showing the full hexagonal array geometry and individual hole morphology (inset). The GST embedded within the Ag PNA can be seen. (b) FTIR (transmission) characterization of the fabricated PNA device showing 70% transmission at the resonance and perfect reflection outside the resonance bandwidth. Stability in the spectral response was maintained across many switching cycles; shown through center wavelength reproducibility (c) and spectral shape consistency (d).
Fig. 5.
Fig. 5.
Optically tuned GST-PNA metasurface devices. (a) Setup used for the laser switching demonstration. Complex refractive index measurements (b), (c) of the a-GST, p-GST, and c-GST films (tuned using the all-optical approach), along with the corresponding spectral response of the full GST-PNA metasurface device for each case as experimentally measured via FTIR (d). It can be seen in (e) that with increasing pulse energy, the crystallinity increases until c-GST is achieved. Further increasing the pulse energy allows for the return to a-GST. Upon returning to the amorphous state, the device exhibits nearly identical spectral response to the as-deposited amorphous phase device.
Fig. 6.
Fig. 6.
MWIR imaging using tunable GST-PNA metasurface filters. (a) Blackbody thermal emission curves for varying temperature sources with overlaid spectral coverage of the tunable GST-PNA metasurface filters fabricated here. (b) Thermal imaging setup schematic for the results shown in (c), (e); image of setup shown in Supplement 1, Fig. S7. (c) MWIR imaging results at a fixed 486 K hotplate temperature, as a function of varying GST-PNA filter states with varying passband center wavelength, λ 0. (d) RGB image of the setup imaged in (e), which shows the IR image of the same scene, as the temperature of the hotplate is increased from 320 K to 486 K. The left and right filters are centered at 2.91 µm and 3.41 µm, respectively. Variable transmission response through the filters, and subsequent identification of the logo (spatially variant thermal profile), can be observed.

References

    1. Gat N., “Imaging spectroscopy using tunable filters: a review,” Proc. SPIE 4056, 50–64 (2000).PSISDG10.1117/12.381686 - DOI
    1. Tyo J. S., Goldstein D. L., Chenault D. B., Shaw J. A., “Review of passive imaging polarimetry for remote sensing applications,” Appl. Opt. 45, 5453–5469 (2006).APOPAI10.1364/AO.45.005453 - DOI - PubMed
    1. Greene T. P., Kelly D. M., Stansberry J., Leisenring J., Egami E., Schlawin E., Chu L., Hodapp K. W., Rieke M., “λ-2.4 to 5 µm spectroscopy with the James Webb Space Telescope NIRCam instrument,” J. Astron. Telesc. Instrum. Syst. 3, 035001 (2017).10.1117/1.JATIS.3.3.035001 - DOI - PMC - PubMed
    1. Holsteen A. L., Cihan A. F., Brongersma M. L., “Temporal color mixing and dynamic beam shaping with silicon metasurfaces,” Science 365, 257–260 (2019).SCIEAS10.1126/science.aax5961 - DOI - PubMed
    1. Zhu Z., Evans P. G., Haglund R. F., Valentine J. G., “Dynamically reconfigurable metadevice employing nanostructured phase-change materials,” Nano Lett. 17, 4881–4885 (2017).NALEFD10.1021/acs.nanolett.7b01767 - DOI - PubMed

LinkOut - more resources