. 2020 Jul 13;7(7):802-812.
doi: 10.1364/OPTICA.393203. eCollection 2020 Jul 20.

CryoSIM: super-resolution 3D structured illumination cryogenic fluorescence microscopy for correlated ultrastructural imaging

Affiliations

CryoSIM: super-resolution 3D structured illumination cryogenic fluorescence microscopy for correlated ultrastructural imaging

Michael A Phillips et al. Optica. .

Abstract

Rapid cryopreservation of biological specimens is the gold standard for visualizing cellular structures in their true structural context. However, current commercial cryo-fluorescence microscopes are limited to low resolutions. To fill this gap, we have developed cryoSIM, a microscope for 3D super-resolution fluorescence cryo-imaging for correlation with cryo-electron microscopy or cryo-soft X-ray tomography. We provide the full instructions for replicating the instrument mostly from off-the-shelf components and accessible, user-friendly, open-source Python control software. Therefore, cryoSIM democratizes the ability to detect molecules using super-resolution fluorescence imaging of cryopreserved specimens for correlation with their cellular ultrastructure.


Conflict of interest statement

The authors declare no conflicts of interest.

Figures

Fig. 1.
Fig. 1.
CryoSIM sample stage: (a) close-up view of the cryo-sample stage, with the three-position grid holder on top of the copper bridge, which dips into the liquid-nitrogen bath; (b) a view of the objective lowered into the cryostage in its imaging position with the cover in place to reduce sample warming; and (c) a view of the system as a whole from above with the cryostage center at the bottom. The optics are usually enclosed in the black boxes shown here with their lids removed.
Fig. 2.
Fig. 2.
Schematic of the cryoSIM microscope, with lenses (L), apertures (A), mirrors (M), pinholes (Ph), dichroics (D), periscope (P), polarization rotator (PR), and cameras (Cam) shown. The four lasers have wavelengths of 405, 488, and 647 nm (Omicron DeepStar lasers) and 561 nm (Cobolt Sapphire laser) and were combined and passed through the telescopes L1 and L2 with a pinhole (Ph1) at their focuses to clean up the beam profiles. The beam was reflected toward the SLM by M1, through an aperture A1. Light reflected from the SLM was refocused by L3 to aperture A2, which removed high diffraction orders generated by the SLM. The polarization was rotated by the PR, and the telescope formed by L4 and L5 reimaged the diffracted spots onto M2; after L5 the excitation light passed through the dichroic D1. The beam continued through telescope L6 and L7 via M3 to the back pupil of a 100× 0.9NA air objective and focused into the sample. The fluorescence emission was collected by the objective and reflected from M3, passed back through L7 and L6, was reflected M2 to dichroic D1, where the fluorescence emission was reflected off M4 to the dichroic D2. This dichroic split the emitted light between two cameras, Cam1 and Cam2, via imaging lenses L8 and L9. The dotted box in the bottom left-hand side was at 90° to the plane of the rest of the diagram, so while most of the optics are in the horizontal plane, the objective is vertical and pointing downwards. There are two flip mirrors FM1 and FM2, which bypass the SLM to allow widefield illumination. Lens focal lengths are shown in the table.
Fig. 3.
Fig. 3.
Widefield and SIM point spread functions: images of a single 175 nm diameter fluorescent bead in focus (a), (b) widefield in the xy and xz planes and (c), (d) SIM in xy and xz planes, respectively. The beads were imaged with 488 nm excitation and a 544/24 emission filter. (e) Line scans through this bead with measured values as points and Gaussian fits as lines. The point spread function in the lateral (xy) direction is in green, and the axial (Z) in red. (f), (g) Measured FWHM of the Gaussian fits in the (f) lateral and the (g) axial directions with SIM data as dark bars and widefield data as fainter bars. Scale bar 1 µm.
Fig. 4.
Fig. 4.
CryoSIM images of HeLa Cells stained with Mitotracker Red and Lysotracker Green excited at 488 nm and 561 nm, respectively. (a) Raw Mitotracker Red signal; (b) raw Lysotracker Green signal; (c), (d) widefield and SIM reconstruction maximum intensity projection over 2.75 µm depth; (e), (f) xz slice of widefield and SIM reconstructed stack, at the position marked by the dashed lines in (c) and (d), to show the increased Z resolution. (g) Spectral power density plot to show the increase in information content between widefield (dashed lines) and SIM reconstructions (solid lines), especially in the range 2.5–5 (0.4–0.2 µm). Image decorrelation analysis gives widefield resolutions as 508 nm and 606 nm and SIM resolutions as 216 nm and 345 nm in green and red, respectively. Scale bar 10 µm.
Fig. 5.
Fig. 5.
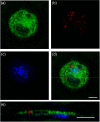
CryoSIM three-color imaging of ER, lysosomes and mitochondria in Drosophila melanogaster. (a) ER labeled in green with 488 nm excitation, (b) lysosomes labelled in red with 561 nm excitation, and (c) mitochondria labelled in the far red with 647 nm excitation (shown in blue); (d) a merged image. All images are maximum intensity projections over 750 nm depth. (e) xz projection at the position marked by the dashed line in d; note that this is at twice the scale of the other panels. Image decorrelation analysis produced lateral resolutions of 217, 248, and 307 nm in the green, red, and far red, respectively. Scale bar 5 µm.
Fig. 6.
Fig. 6.
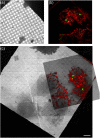
Correlated cryoSIM and X-ray microscope images HeLa cells expressing MOV10-YFP and labelled with MitoTracker Deep Red. (a) Transmission image from cryoSIM microscope; (b) SIM reconstruction fluorescence image from the same region. A maximum intensity projection over 3.125 µm with MOV10-YFP in green and MitoTracker Deep Red in red; xz projections of this data is shown in supplemental Fig. S4. (c) A mosaic from the X-ray microscope with the semitransparent SIM fluorescence reconstruction rotated and scaled to its correct location, clearly showing the same set of cells. Scale bar 10 µm.
Fig. 7.
Fig. 7.
Correlated cryoSIM and X-ray tomogram HeLa cells expressing MOV10-YFP and infected with SINV-mCherry. (a)–(c) A section of the overview X-ray mosaic image (a) with maximum intensity projections of SIM reconstructions of the same area for (b) MOV10-YFP and (c) SINV-mCherry. (d),(e), Magnified images of the boxed region from (a)–(c) in a slice of the (d) X-ray tomogram and (e) merged channels from the SIM reconstructions. (f)–(h) Further magnifications of the boxed region in (d), clearly showing a (f) dense structure, which colocalizes with both (g) MOV10 staining in green and (h) SINV-mCherry in red.(i)–(l) yz sections, along the line shown in (f), of (i) the p-body region in the X-ray tomogram; (j),(l) MOV10 in green; and (k),(l) SINV-mCherry in red. The nucleus is marked as N with its boundary indicated with a dotted line in panel (e). (Scale bars (a) 5 µm; (d), (f), (i), and (l) = 2 µm).

References

    1. Chen B.-C., Legant W. R., Wang K., Shao L., Milkie D. E., Davidson M. W., Janetopoulos C., Wu X. S., Hammer J. A., Liu Z., English B. P., Mimori-Kiyosue Y., Romero D. P., Ritter A. T., Lippincott-Schwartz J., Fritz-Laylin L., Mullins R. D., Mitchell D. M., Bembenek J. N., Reymann A.-C., Böhme R., Grill S. W., Wang J. T., Seydoux G., Tulu U. S., Kiehart D. P., Betzig E., “Lattice light-sheet microscopy: imaging molecules to embryos at high spatiotemporal resolution,” Science 346, 1257998 (2014).SCIEAS10.1126/science.1257998 - DOI - PMC - PubMed
    1. Smith D., Starborg T., “Serial block face scanning electron microscopy in cell biology: applications and technology,” Tissue Cell 57, 111–122 (2019).TICEBI10.1016/j.tice.2018.08.011 - DOI - PubMed
    1. Schermelleh L., Ferrand A., Huser T., Eggeling C., Sauer M., Biehlmaier O., Drummen G. P., “Super-resolution microscopy demystified,” Nat. Cell Biol. 21, 72–84 (2019).NCBIFN10.1038/s41556-018-0251-8 - DOI - PubMed
    1. Harkiolaki M., Darrow M. C., Spink M. C., Kosior E., Dent K., Duke E., “Cryo-soft X-ray tomography: using soft X-rays to explore the ultrastructure of whole cells,” Emerg. Top. Life Sci. 2, 81–92 (2018).10.1042/ETLS20170086 - DOI - PMC - PubMed
    1. Nogales E., Scheres S. H., “Cryo-EM: a unique tool for the visualization of macromolecular complexity,” Mol. Cell 58, 677–689 (2015).MOCEFL10.1016/j.molcel.2015.02.019 - DOI - PMC - PubMed