. 2021 Jun 21;24(7):102757.
doi: 10.1016/j.isci.2021.102757. eCollection 2021 Jul 23.

Extensive three-dimensional intratumor proteomic heterogeneity revealed by multiregion sampling in high-grade serous ovarian tumor specimens

Affiliations

Extensive three-dimensional intratumor proteomic heterogeneity revealed by multiregion sampling in high-grade serous ovarian tumor specimens

Allison L Hunt et al. iScience. .

Abstract

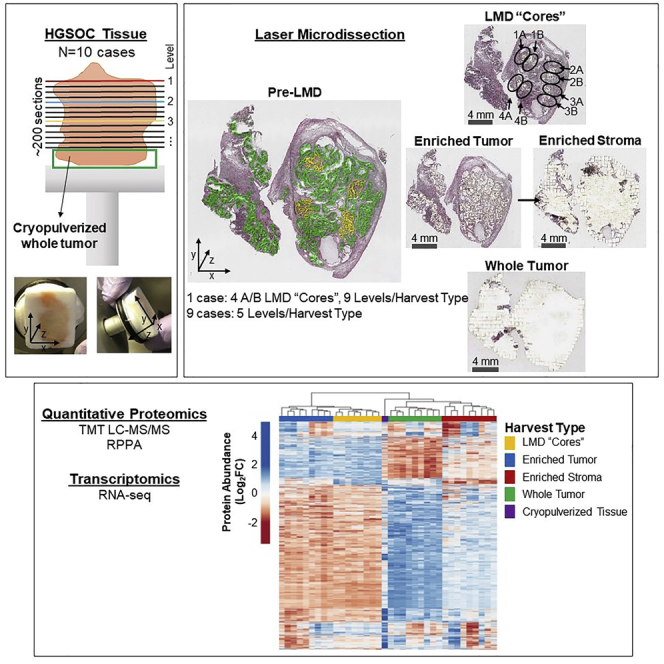
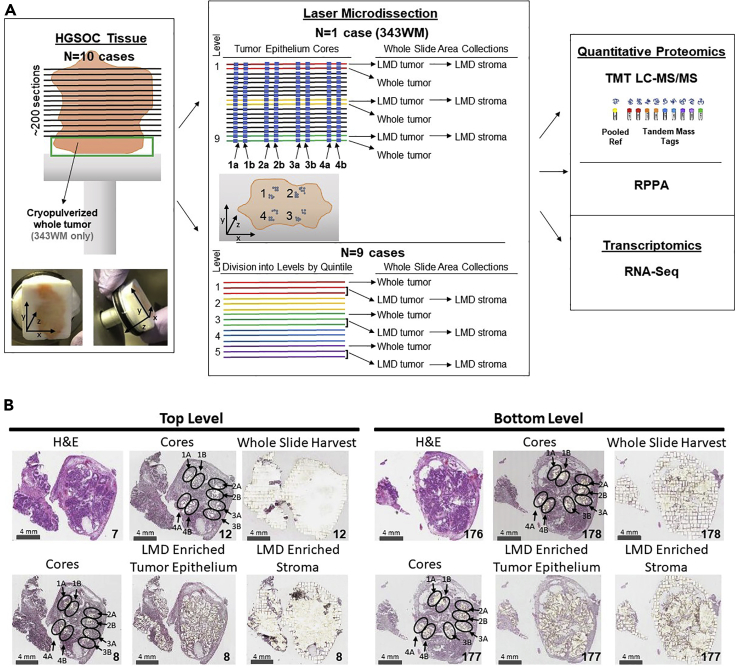
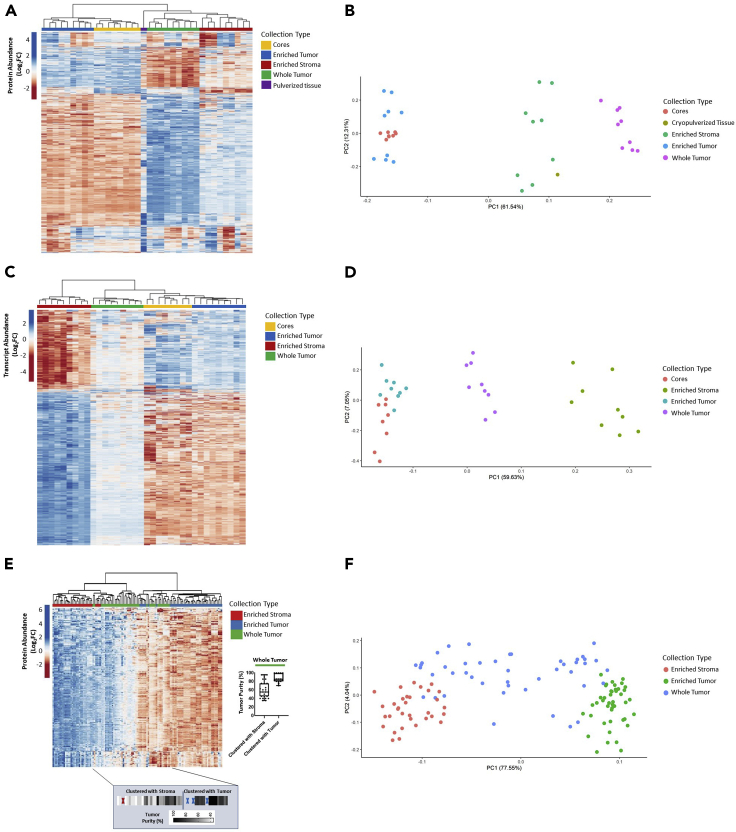
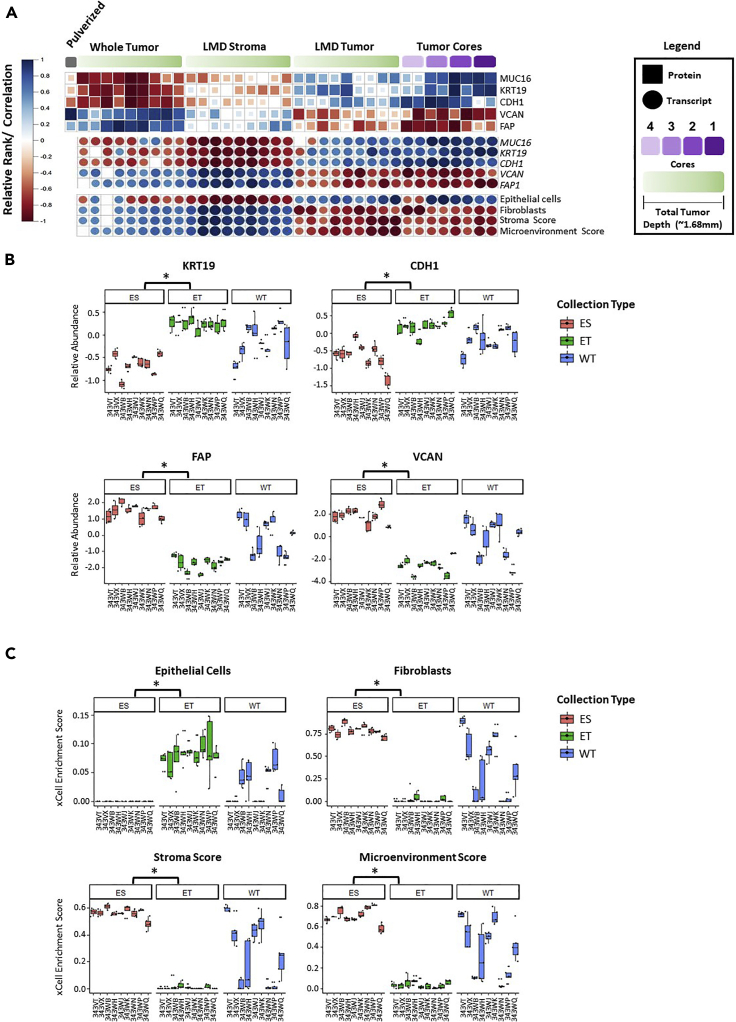
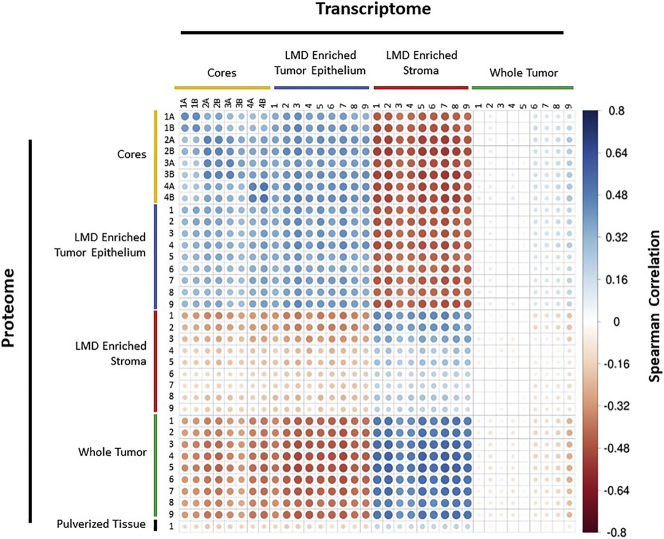
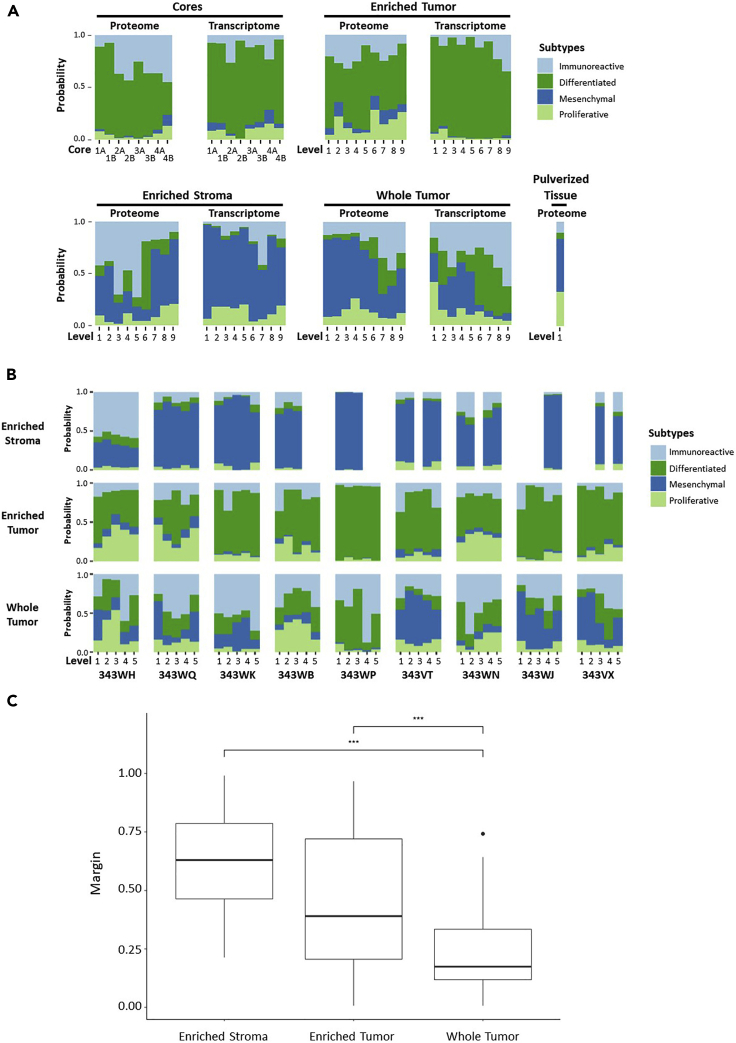
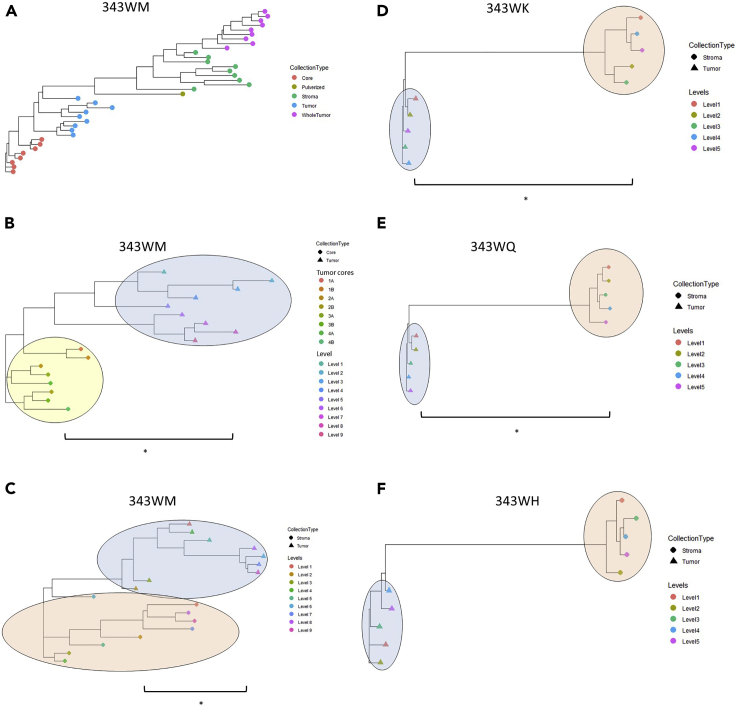
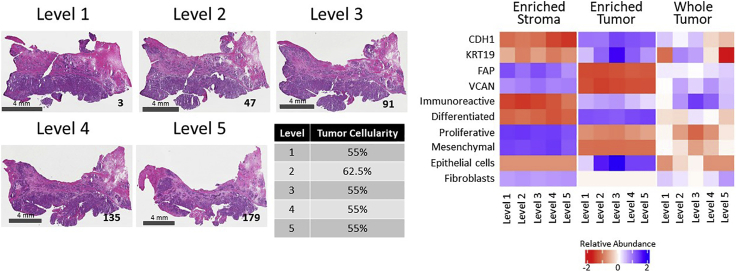
Enriched tumor epithelium, tumor-associated stroma, and whole tissue were collected by laser microdissection from thin sections across spatially separated levels of ten high-grade serous ovarian carcinomas (HGSOCs) and analyzed by mass spectrometry, reverse phase protein arrays, and RNA sequencing. Unsupervised analyses of protein abundance data revealed independent clustering of an enriched stroma and enriched tumor epithelium, with whole tumor tissue clustering driven by overall tumor "purity." Comparing these data to previously defined prognostic HGSOC molecular subtypes revealed protein and transcript expression from tumor epithelium correlated with the differentiated subtype, whereas stromal proteins (and transcripts) correlated with the mesenchymal subtype. Protein and transcript abundance in the tumor epithelium and stroma exhibited decreased correlation in samples collected just hundreds of microns apart. These data reveal substantial tumor microenvironment protein heterogeneity that directly bears on prognostic signatures, biomarker discovery, and cancer pathophysiology and underscore the need to enrich cellular subpopulations for expression profiling.

Keywords: Cancer systems biology; Oncology; Proteomics; Transcriptomics.


Conflict of interest statement

T.P.C. is a ThermoFisher Scientific, Inc SAB member and receives research funding from 10.13039/100006483AbbVie. E.F.P. receives research funding from 10.13039/100004328Genentech, 10.13039/100004319Pfizer, and 10.13039/100006483AbbVie and is a co-inventor of the RPPA technology described herein and receives royalties on the related license agreements.

Figures

None
Graphical abstract
Figure 1
Figure 1
Study workflow Illustration of histological tissue preparation, laser microdissection, proteomic analyses, and transcriptomic analysis (A), with representative pre-LMD and post-LMD images from the top and bottom levels of the tissue from Case 343WM (B). (A) Specimen blocks obtained from 10 patients with HGSOC were each cut into ∼200 consecutive thin tissue sections (left ), which were laser microdissected for enrichment of tumor epithelium, stroma, or whole tumor collections (middle panel) for analysis via quantitative proteomics and transcriptomics (right panel). One case (343WM; middle panel, top) was uniquely used for laser microdissection (LMD) enrichment of four tumor epithelium cores with adjacent replicate regions from each of 100 or 50 slides evenly distributed through the depth of the specimen for MS proteomics or transcriptomics, respectively. For 343WM, additional sets of 9 slides from spatially separated levels within the specimen block were each microdissected for all remaining tumor and stroma after collecting the cores by LMD, as well as a nearest neighboring whole tumor collection. The remainder of the specimen was cryopulverized in liquid nitrogen. The specimen blocks from the remaining 9 cases (middle panel, bottom) were divided into 5 levels (quintiles) of equal depth. Within each level, interlaced sections were used for LMD enrichment of tumor epithelium, stroma, and whole tumor collections for each downstream analytical purpose. Proteins and transcripts isolated from each of these distinct collections were analyzed by isobaric tagging and high-resolution liquid chromatography-tandem mass spectrometry, reverse phase protein microarray, and/or next generation sequencing. (B) Representative pre-LMD and post-LMD images are shown for 343WM from tissue sections at the top and bottom levels used for proteomic analysis. The number in the bottom right corner of each micrograph indicates the slide number shown. The scale bar in the bottom left corner of each micrograph indicates a length of 4 mm.
Figure 2
Figure 2
Unsupervised hierarchical cluster analysis and principal component analysis of LMD-enriched samples by differentially abundant protein and transcript expression (A, B) 1,928 differentially abundant proteins and (C, D) 3,861 transcripts with median absolute deviation (MAD) > 0.5 from case 343WM and (E, F) 6,199 differentially abundant proteins with MAD>1 in the 9-patient specimen set. (E, F) Protein abundances are represented across n = 123 samples derived from n = 9 patients consisting of LMD-enriched tumor epithelium (n = 45 total; 5 levels/patient), LMD-enriched stroma (n = 33 total; 2–5 levels/patient), and whole tumor (n = 45 total; 5 levels/patient) samples. Highlighted box depicts the median tumor purity values from manual pathology review for each of the whole tumor collections as they appear in the heatmap, ordered from left to right. Dark elongated border line distinguishes the whole tumor collections which clustered with LMD-enriched stroma (left) from those that clustered with LMD-enriched tumor (right). Red and blue “X” marks represent interceding LMD-enriched stroma or tumor collections, respectively.
Figure 3
Figure 3
Protein and transcript abundance of epithelial and stromal markers in HGSOC as well as cellular admixture analyses (xCell (Aran et al., 2017)) (A) Heatmaps depicting protein and transcript abundances and cellular admixture enrichment scores from 343WM for replicate tumor cores and by depth within the specimen block for LMD-enriched tumor, stroma, and whole tumor collections. Protein abundance from the cryopulverized tumor is included. Size and color of each shape reflects Spearman correlation. (B) Boxplots depicting relative protein abundances for KRT19, CDH1, FAP, and VCAN and (C) cellular admixture scores in the n = 9 patient specimen set. ES = LMD-enriched stroma; ET = LMD-enriched tumor; WT = whole tumor. p values with (∗) indicate statistically significant differential expression (p < 0.0001) between ES and ET.
Figure 4
Figure 4
Protein-RNA Spearman correlation matrix for case 343WM Spearman correlation analysis of 5,742 genes that were co-measured as proteins and corresponding transcripts in 343WM. Size and color of each circle reflects Spearman correlation.
Figure 5
Figure 5
Protein and transcript abundance of markers correlating with prognostic molecular signatures of altered disease outcome in HGSOC (A) Transcript abundances for markers correlated with suboptimal surgical debulking identified by Liu et al (2015) (Liu et al., 2015), and protein and transcript abundances correlating with prognostic molecular subtypes identified by Konecny et al (2014) (Konecny et al., 2014) measured in 343WM. (B) Stacked bar graphs depicting the probability of each collection type (LMD-enriched stroma, LMD-enriched tumor, and whole tumor) per level per patient belonging to consensus molecular subtypes identified by Chen et al (2018) (Chen et al., 2018) based on protein abundance. (C) Boxplots depicting the distributions of margin classification thresholds across all levels from the proteomic data from the 9-patient dataset for each collection type. Significance determined by a post hoc Tukey honestly significant difference test indicated that all three groups were significantly different from each other. Both LMD-enriched stroma and LMD-enriched tumor differed from whole tumor (∗∗∗; p < 0.001). Margin means were 0.609, 0.460, and 0.238 for the LMD-enriched stroma, LMD-enriched tumor, and whole tumor, respectively.
Figure 6
Figure 6
Patient-specific dendrograms depicting Spearman correlations between LMD-enriched collections based on differentially expressed proteins (A) Representative relatedness of all collection types from 343WM, including tumor cores, LMD-enriched tumor epithelium, LMD-enriched stroma, whole tumor, and cryopulverized tissue. (B) Relatedness of tumor cores versus LMD-enriched tumor epithelium from 343WM. (C-F) Relatedness of LMD-enriched tumor versus stroma from 343WM, 343WK, 343WQ, and 343WH, respectively. With the exception of the LMD-enriched tumor cores vs LMD-enriched tumor epithelium comparison in (B) which was calculated using proteins with a median absolute deviation (MAD) > 0.5, all comparisons in (A) and (C-F) were made using proteins with MAD >1. Comparisons marked with (∗) indicate a significant difference (p < 0.01) between groups, with p values of 1.264 × 10−5, 0.0012, 0.0003372, 0.00097, and 0.2205 for the comparisons in (B-F), respectively. The yellow, blue, and red ovals in (B-F) highlight the clusters of LMD-enriched tumor cores, tumor epithelium, and stroma, respectively.
Figure 7
Figure 7
Representative case (343WQ) depicting variable molecular expression and subtype classification by level H&E images show the tissue sections mounted on glass slides bounding the top of each level. The scale bar in the bottom left corner of each micrograph indicates a length of 4 mm. The tissue section number is notated in the bottom right corner. The median tumor cellularity with relative standard deviation (%CV), molecular subtype, and protein abundances of representative tumor and stroma markers present in the whole tumor collections are indicated for each level. The median tumor cellularity calculated from review of multiple images per level with the %CV included in parenthesis (from Table S1) is reported as percentages. Correlations with consensus molecular subtypes (Figure 5B and Table S28) are shown. The Log2-transformed protein abundances are shown for tumor/epithelial markers (CDH1 and KRT19) and stroma markers (FAP and VCAN) (from Table S7).

Similar articles

Cited by

References

    1. Ali M., Khan S.A., Wennerberg K., Aittokallio T. Global proteomics profiling improves drug sensitivity prediction: results from a multi-omics, pan-cancer modeling approach. Bioinformatics. 2017;34:1353–1362. - PMC - PubMed
    1. Aran D., Hu Z., Butte A.J. xCell: digitally portraying the tissue cellular heterogeneity landscape. Genome Biol. 2017;18:220. - PMC - PubMed
    1. Aran D., Sirota M., Butte A.J. Systematic pan-cancer analysis of tumour purity. Nat. Commun. 2015;6:8971. - PMC - PubMed
    1. Baldelli E., Bellezza G., Haura E.B., Crinó L., Cress W.D., Deng J., Ludovini V., Sidoni A., Schabath M.B., Puma F. Functional signaling pathway analysis of lung adenocarcinomas identifies novel therapeutic targets for KRAS mutant tumors. Oncotarget. 2015;6:32368–32379. - PMC - PubMed
    1. Baldelli E., Calvert V., Hodge A., Vanmeter A., Petricoin E.F., Pierobon M. Reverse phase protein microarrays. In: Espina V., editor. Molecular Profiling: Methods and Protocols. Springer; 2017. pp. 149–169. - PubMed

LinkOut - more resources