

Autism Tsunami: the Impact of Rising Prevalence on the Societal Cost of Autism in the United States
- PMID: 34278527
- PMCID: PMC9114071
- DOI: 10.1007/s10803-021-05120-7
Autism Tsunami: the Impact of Rising Prevalence on the Societal Cost of Autism in the United States
Retraction in
-
Retraction Note: Autism Tsunami: The Impact of Rising Prevalence on the Societal Cost of Autism in the United States.J Autism Dev Disord. 2023 Aug;53(8):3315. doi: 10.1007/s10803-023-06016-4. J Autism Dev Disord. 2023. PMID: 37273157 Free PMC article. No abstract available.
Abstract
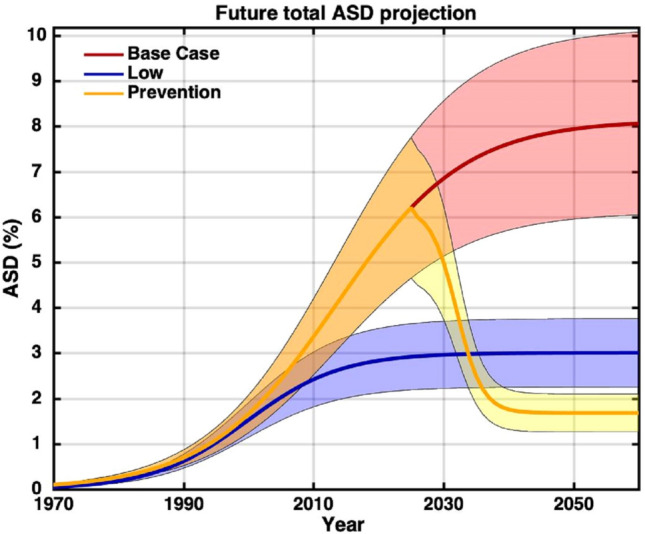
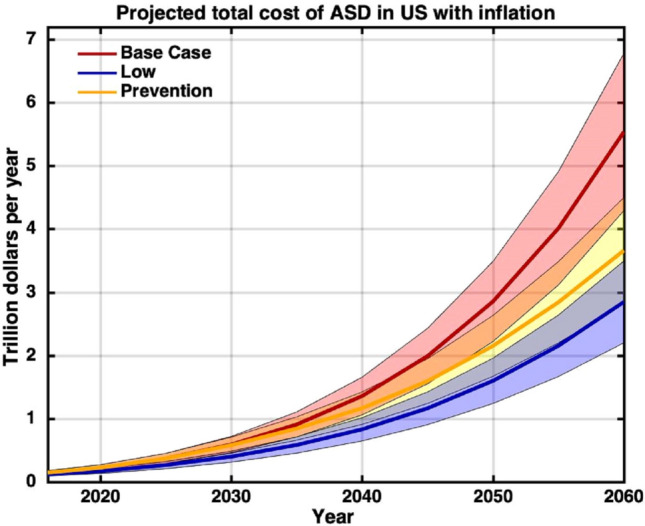
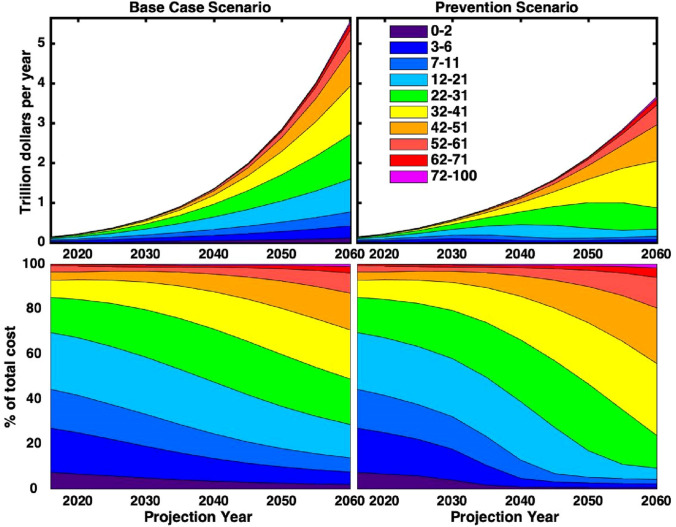
The cost of ASD in the U.S. is estimated using a forecast model that for the first time accounts for the true historical increase in ASD. Model inputs include ASD prevalence, census population projections, six cost categories, ten age brackets, inflation projections, and three future prevalence scenarios. Future ASD costs increase dramatically: total base-case costs of $223 (175-271) billion/year are estimated in 2020; $589 billion/year in 2030, $1.36 trillion/year in 2040, and $5.54 (4.29-6.78) trillion/year by 2060, with substantial potential savings through ASD prevention. Rising prevalence, the shift from child to adult-dominated costs, the transfer of costs from parents onto government, and the soaring total costs raise pressing policy questions and demand an urgent focus on prevention strategies.
Keywords: ASD prevalence; Autism spectrum disorder; Cost; Future cost projections; Time trends.
© 2021. The Author(s).
Conflict of interest statement
CN and TR declare that the research was conducted in the absence of any commercial or financial relationships that could be construed as a potential conflict of interest. MB is the CFO of the Holland Center, a public and private insurance-funded day treatment program serving children and young adults with autism.
Figures


References
-
- American Psychiatric Association. (1994). Diagnostic and statistical manual of mental disorders (4th ed.). American Psychiatric Association.
-
- American Psychiatric Association. (2013). Diagnostic and statistical manual of mental disorders (5th ed.). American Psychiatric Association.
-
- Blumberg SJ, Bramlett MD, Kogan MD, Schieve LA, Jones JR, Lu MC. Changes in prevalence of parent-reported autism spectrum disorder in school-aged US children: 2007 to 2011–2012. National Health Statistic Report. 2013;65:1–11. - PubMed
Publication types
MeSH terms
LinkOut - more resources
Full Text Sources
Medical
