. 2021 Aug;20(8):e13421.
doi: 10.1111/acel.13421. Epub 2021 Jul 18.

Adipose tissue senescence is mediated by increased ATP content after a short-term high-fat diet exposure

Affiliations

Adipose tissue senescence is mediated by increased ATP content after a short-term high-fat diet exposure

Maria Pini et al. Aging Cell. 2021 Aug.

Abstract

In the context of obesity, senescent cells accumulate in white adipose tissue (WAT). The cellular underpinnings of WAT senescence leading to insulin resistance are not fully elucidated. The objective of the current study was to evaluate the presence of WAT senescence early after initiation of high-fat diet (HFD, 1-10 weeks) in 5-month-old male C57BL/6J mice and the potential role of energy metabolism. We first showed that WAT senescence occurred 2 weeks after HFD as evidenced in whole WAT by increased senescence-associated ß-galactosidase activity and cyclin-dependent kinase inhibitor 1A and 2A expression. WAT senescence affected various WAT cell populations, including preadipocytes, adipose tissue progenitors, and immune cells, together with adipocytes. WAT senescence was associated with higher glycolytic and mitochondrial activity leading to enhanced ATP content in HFD-derived preadipocytes, as compared with chow diet-derived preadipocytes. One-month daily exercise, introduced 5 weeks after HFD, was an effective senostatic strategy, since it reversed WAT cellular senescence, while reducing glycolysis and production of ATP. Interestingly, the beneficial effect of exercise was independent of body weight and fat mass loss. We demonstrated that WAT cellular senescence is one of the earliest events occurring after HFD initiation and is intimately linked to the metabolic state of the cells. Our data uncover a critical role for HFD-induced elevated ATP as a local danger signal inducing WAT senescence. Exercise exerts beneficial effects on adipose tissue bioenergetics in obesity, reversing cellular senescence, and metabolic abnormalities.

Keywords: ATP; adipose tissue senescence; bioenergetics; exercise; obesity; xanthine oxidase.


Conflict of interest statement

None declared.

Figures
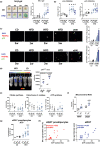
FIGURE 1
FIGURE 1
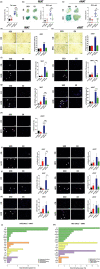
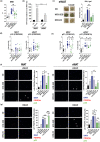
WAT cellular senescence occurs shortly after initiation of HFD. (a–b) Detailed kinetics of epidydimal adipose tissue (eWAT) senescence 1, 2, 5, and 10 weeks after initiation of HFD compared with chow diet (CD) group. Representative images of β‐galactosidase (SA‐β‐gal) activity in eWAT and quantification of relative intensity; n = 5–6 mice/group (a). Gene expression for senescence markers, p16 (Cdkn2a) and p21 (Cdkn1a), in eWAT; n = 5 mice/group (b). (c) Representative immunofluorescence images of CD and 1‐, 2‐, and 5‐week HFD eWAT and quantification co‐stained with p16 (green, upper panel) or p21 (green, lower panel) and marker of adipocyte precursor platelet‐derived growth factor receptor alpha, PDGFRα (red) and counterstained with DAPI (blue). Double positive cells are expressed as the mean number of positive cells in percentage of adipocytes; n = 3–4 mice/group; magnification ×200, scale bar = 50 μm. For both p16 and p21, in the last panel on the right, a magnified view (600×) of a double positive cell is shown for 5‐week HFD, scale bar = 50 µm. (d) Whole‐body luminescence for individual p16LUC transgenic male mice at 10‐week HFD. Bioluminescence (BLI) is expressed in arbitrary unit (AU; CD n = 2, HFD n = 3). (e) Citrate synthase activity and activity of respiratory complexes IV (cytochrome C oxidase) and V (ATP synthase) at 1‐, 2‐, and 5‐week time points; n = 5 mice/group. (f) Mitochondrial ROS measured in differentiated preadipocytes by MitoSOX fluorescence intensity; n = 4 mice/group. (g) Intracellular ATP content in eWAT‐derived preadipocytes 1, 2, and 5 weeks after initiation of HFD compared with CD group; n = 3–8 mice/group. (h) SA‐β‐gal activity and ATP content correlated positively in eWAT‐derived preadipocytes (n = 25 mice) and in eWAT (n = 21 mice). Data are presented either as original images (a, c, d), individual values with (a, b, d–g) or without mean (h) or mean ± SEM (c). Statistical significance was evaluated by one‐way ANOVA followed by Bonferroni correction (a–g) or Pearson correlation (h). *p < 0.05, **p < 0.01, ***p < 0.001 vs. 1‐week CD; π < 0.05 vs. 1‐week HFD
FIGURE 2
FIGURE 2
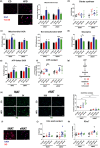
HFD induces WAT cellular senescence, independent of systemic inflammation, while exercise prevents it. (a) Fat mass (adiposity index) of four groups of mice: CD‐sedentary (CD‐SED), CD‐exercise (CD‐EX), HFD‐sedentary (HFD‐SED), HFD‐exercise (HFD‐EX); n = 8 mice/group. (b–c) Representative images of SA–β‐gal in iWAT and eWAT and quantification of relative intensity of signal; n = 5–7 mice/group. (d–e) Representative images and quantification of SA–β‐gal in preadipocytes derived from iWAT and eWAT expressed in percentage of total cells; n = 4 mice/group, magnification ×200, scale bar = 50 μm. (f) Representative images and quantification of co‐localizing p16 (green) and PDGFRα (red) in iWAT and eWAT. Sections were counterstained with DAPI (blue). Double positive cells are expressed as the mean number of positive cells in percentage of adipocytes; n = 4–5 mice/group, magnification ×200, scale bar = 50 μm. (g) Representative images and quantification of co‐localizing p21 (green) and PDGFRα (red) in iWAT and eWAT. Sections were counterstained with DAPI (blue). Double positive cells are expressed as the mean number of positive cells in percentage of adipocytes; n = 4 mice/group, magnification ×200, scale bar = 50 μm. (h) Representative images and quantification of co‐localizing S139 phosphorylated form of γH2AX (green), double‐stranded DNA break DNA damage marker, and leukocyte marker CD45 (red) counterstained with DAPI (blue) in eWAT. Positive cells are expressed as the mean number of foci in percentage; n = 3 mice/group, magnification ×200, scale bar = 50 μm. (i–k) Representative images and quantification of co‐localizing p16 (green) with macrophages, Mac3 (red) (i); p21 (green) with macrophages, Mac3 (red) (j); and p16 (green) with T lymphocytes, CD3 (red) (k) with DAPI (blue) in iWAT and eWAT. Double positive cells are expressed as the mean number of positive cells in percentage of DAPI‐positive nuclei; n = 3–5 mice/group, magnification ×200, scale bar = 50 μm. (l–m) The discriminative power of four major functional themes illustrating the HFD impact on WAT transcriptional profile. Transcriptional changes of a panel of selected genes were evaluated separately in iWAT (l) and eWAT (m). Their discriminative power was estimated by iterative testing in a supervised predictive model and is expressed as percentage of their total discriminative power. Data are presented as original images (b–h), individual values plus mean (a–c), or mean ± SEM (d–k). Statistical significance was evaluated by one‐way ANOVA followed by Bonferroni correction (a–k). *p < 0.05; **p < 0.01; ***p < 0.001 for differences due to diet regimen within sedentary and exercise groups (* = diet effect) and e p < 0.05; ee p < 0.01; eee p < 0.001 for differences between sedentary and exercise groups fed the same diet (e = exercise effect)
FIGURE 3
FIGURE 3
Adipose tissue senescence is associated with increased adipocyte bioenergetics. (a) Representative images of CD‐SED and HFD‐SED mice and quantification by immunofluorescence staining in iWAT and eWAT of translocase of outer mitochondrial membrane 20 (Tom20) signal in adipocytes (arbitrary unit, AU); n = 3–7 mice/group, magnification ×200, scale bar = 50 μm. Magnified view of positive cells (400×; bottom panel), scale bar = 50 µm. (b) Citrate synthase activity in iWAT and eWAT; n = 4–5 mice/group. (c) Mitochondrial and non‐mitochondrial oxygen consumption (OCR) determined by SeaHorse analysis in iWAT‐ and eWAT‐derived preadipocytes isolated from CD and HFD mice, sedentary (SED) or exercise (EX) groups; n = 4 independent experiments with five technical repeats. (d) Changes in extracellular acidification rate (ECAR), an index of glycolysis. Glycolysis is determined through measurements of the surrounding media before injection of compounds; n = 4 independent experiments with five technical repeats. (e) Changes in ATP‐linked oxygen consumption; n = 4 independent experiments with five technical repeats. (f) Intracellular ATP content in iWAT‐ and eWAT‐derived preadipocytes; n = 6–8 mice/group. (g) Flowchart of purine degradation. (h) Representative images and quantification of xanthine oxidase immunofluorescence (XO, green) in iWAT and eWAT. XO levels are expressed as the mean positive signal in percentage of adipocytes; n = 3 mice/group, magnification ×200, scale bar = 50 μm. (i) Representative images of XO immunofluorescence in iWAT‐ and eWAT‐derived preadipocytes; n = 3/group; magnification ×400, scale bar = 25 μm. (j) Uric acid concentration in iWAT and eWAT tissue lysates, n = 6–12 mice/group. (k) Gene expression analysis in iWAT and eWAT for purinergic receptor P2X, ligand‐gated ion channel, 7 (P2rx7). Results are expressed as fold mRNA change relative to CD‐SED values set to 1; n = 6 mice/group. Data are presented as original images (a, h–i), individual values plus mean (b, f, h, j–k), or mean ± SEM (a, c–e). Statistical significance was evaluated by one‐way ANOVA followed by Bonferroni correction. *p < 0.05; **p < 0.01; ***p < 0.001 for differences due to diet regimen within sedentary and exercise groups (* = diet effect) and e p < 0.05; ee p < 0.01; eee p < 0.001 for differences between sedentary and exercise groups fed the same diet (e = exercise effect); ns: nonsignificant
FIGURE 4
FIGURE 4
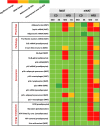
A summary table. The table displays the differences between iWAT and eWAT together with the effect of regimen and exercise in terms of adipose tissue function and dysfunction, senescence, and energy metabolism, including ATP and uric acid contents. Color code is determined by statistical significance
FIGURE 5
FIGURE 5
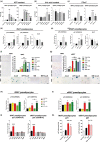
Role of ATP in adipose tissue senescence in vitro. (a–b) Intracellular ATP (a) and uric acid (b) levels in preadipocytes derived from iWAT and eWAT of CD‐fed mice treated with adenosine triphosphate (ATP)‐loaded liposomes (200 μM; for 30′–3 h–6 h–24 h) compared to two control groups: liposome‐free (lipo‐free) and liposome‐alone (CTL); n = 3–6/group. (c) Gene expression analysis in iWAT‐ and eWAT‐derived preadipocytes for purinergic receptor P2X, ligand‐gated ion channel, 7 (P2rx7) at 6 h and 24 h post ATP treatment. Results are expressed as fold mRNA change relative to Lipo‐free values set to 1; n = 3–4/group. (d–e) Gene expression analysis for senescence markers, p16 and p21, and proliferation marker, Ki‐67, in CD iWAT‐ and eWAT‐derived preadipocytes 6 h or 24 h post‐ATP treatment compared to liposome‐free (lipo‐free, red line) and liposome‐alone (CTL); n = 4–6/group. (f–g) Representative images of SA–β‐gal in CD iWAT‐ and eWAT‐derived preadipocytes stimulated for 6 h with uric acid, ATP ± allopurinol, high glucose/palmitate (metabolic media: MM) or MM in combination with allopurinol; magnification ×400, scale bar = 25 μm; n = 4–5/treatment. (h–i) Gene expression analysis for senescence markers, p16 and p21, in CD iWAT‐ and eWAT‐derived preadipocytes stimulated for 6 h with uric acid‐ or ATP‐loaded liposomes alone or in combination with allopurinol. For gene expression, results are expressed as fold mRNA change relative to Lipo‐free values set to 1; n = 3/group. (j) Gene expression analysis for p21 in CD iWAT‐ and eWAT‐derived preadipocytes 24 h after treatment with ATP‐, ADP‐, GTP‐, IMP‐, ITP‐, and AMP‐loaded liposomes compared to liposome‐free (lipo‐free, red line) and liposome‐alone (CTL); n = 3/group. (k) Quantification of immunofluorescence staining for p21 (red), counterstained with DAPI (blue), in CD iWAT‐ and eWAT‐derived preadipocytes stimulated with ATP‐loaded liposomes for 24 h, after pre‐treatment with P2X r antagonist, compared to liposome free (lipo‐free) and liposome alone (CTL). Results are expressed as nuclear p21 in percentage of total nuclei (n = 3/group). Data are presented either as original images (F‐G) or mean ± SEM (a–k). Statistical significance was evaluated by one‐way ANOVA followed by Bonferroni correction. *p < 0.05; **p < 0.01; ***p < 0.001 compared to liposome alone (CTL) or as indicated; ns: nonsignificant; gray symbols above columns: significance vs. Lipo‐free. α p < 0.05 for the effect of P2X r antagonist between ATP‐treated cells
FIGURE 6
FIGURE 6
Role of ATP in adipose tissue senescence in vivo. (a) Body weight (BW) of six groups of mice: control diet (CD), CD treated with allopurinol (CD‐ALLO), HFD‐sedentary (HFD‐SED), HFD‐sedentary treated with allopurinol (HFD‐ALLO), HFD‐exercise (HFD‐EX) and HFD‐exercise treated with allopurinol (HFD EX‐ALLO); n = 5–10 mice/group. (b) Relative ATP levels in preadipocytes derived from iWAT and eWAT of CD and CD‐ALLO mice, n = 4–6 mice/group. (c) Representative images and quantification of SA–β‐gal in eWAT in mice as described under A; n = 5 mice/group. (d–e) Quantitative RT‐PCR analysis of p16 (d) and p21 (e) in iWAT and eWAT of mice described under A; n = 5–10 mice/group. (f–g) Representative images and quantification by immunofluorescence staining in iWAT (f) and eWAT (g) of co‐localization with p21 (green) and PDGFRα (red). Sections were counterstained with DAPI (blue). Double positive cells are expressed as the mean number of positive cells in percentage of adipocytes; n = 4–5 mice/group, magnification ×200, scale bar = 50 μm. Data are presented as original images (c, f–g), individual values plus mean (a, d–e) or mean ± SEM (b–c, f–g). Statistical significance was evaluated by one‐way ANOVA followed by Bonferroni correction. *p < 0.05; **p < 0.01 ***p < 0.001 above columns indicate comparison to CD (* = diet effect) or comparison is indicated; e p < 0.05; ee p < 0.01 for differences between sedentary and exercise groups fed the same diet (e = exercise effect); # p < 0.05 for the effect of allopurinol treatment between groups; ns: nonsignificant

References

    1. Acosta, J. C., Banito, A., Wuestefeld, T., Georgilis, A., Janich, P., Morton, J. P., Athineos, D., Kang, T.‐W., Lasitschka, F., Andrulis, M., Pascual, G., Morris, K. J., Khan, S., Jin, H., Dharmalingam, G., Snijders, A. P., Carroll, T., Capper, D., Pritchard, C., … Gil, J. (2013). A complex secretory program orchestrated by the inflammasome controls paracrine senescence. Nature Cell Biology, 15, 978–990. 10.1038/ncb2784 - DOI - PMC - PubMed
    1. Ahima, R. S. (2009). Connecting obesity, aging and diabetes. Nature Medicine, 15, 996–997. 10.1038/nm0909-996 - DOI - PubMed
    1. Anderson, R., Lagnado, A., Maggiorani, D., Walaszczyk, A., Dookun, E., Chapman, J., Birch, J., Salmonowicz, H., Ogrodnik, M., Jurk, D., Proctor, C., Correia‐Melo, C., Victorelli, S., Fielder, E., Berlinguer‐Palmini, R., Owens, A., Greaves, L. C., Kolsky, K. L., Parini, A., … Passos, J. F. (2019). Length‐independent telomere damage drives post‐mitotic cardiomyocyte senescence. The EMBO Journal, 38(5), 10.15252/embj.2018100492 - DOI - PMC - PubMed
    1. Baker, D. J., Childs, B. G., Durik, M., Wijers, M. E., Sieben, C. J., Zhong, J., A. Saltness, R., Jeganathan, K. B., Verzosa, G. C., Pezeshki, A., Khazaie, K., Miller, J. D., & van Deursen, J. M. (2016). Naturally occurring p16(Ink4a)‐positive cells shorten healthy lifespan. Nature, 530, 184–189. 10.1038/nature16932 - DOI - PMC - PubMed
    1. Baker, D. J., Wijshake, T., Tchkonia, T., LeBrasseur, N. K., Childs, B. G., van de Sluis, B. , Kirkland, J. L., & van Deursen, J. M. (2011). Clearance of p16Ink4a‐positive senescent cells delays ageing‐associated disorders. Nature, 479, 232–236. 10.1038/nature10600 - DOI - PMC - PubMed

Publication types

Substances

LinkOut - more resources