. 2021 Jul 19:10:e66405.
doi: 10.7554/eLife.66405.

Highly contiguous assemblies of 101 drosophilid genomes

Affiliations

Highly contiguous assemblies of 101 drosophilid genomes

Bernard Y Kim et al. Elife. .

Erratum in

  • Correction: Highly contiguous assemblies of 101 drosophilid genomes.
    Kim BY, Wang JR, Miller DE, Barmina O, Delaney E, Thompson A, Comeault AA, Peede D, D'Agostino ERR, Pelaez J, Aguilar JM, Haji D, Matsunaga T, Armstrong E, Zych M, Ogawa Y, Stamenković-Radak M, Jelić M, Veselinović MS, Tanasković M, Erić P, Gao JJ, Katoh TK, Toda MJ, Watabe H, Watada M, Davis JS, Moyle LC, Manoli G, Bertolini E, Košťál V, Hawley RS, Takahashi A, Jones CD, Price DK, Whiteman N, Kopp A, Matute DR, Petrov DA. Kim BY, et al. Elife. 2022 Mar 18;11:e78579. doi: 10.7554/eLife.78579. Elife. 2022. PMID: 35302486 Free PMC article.

Abstract

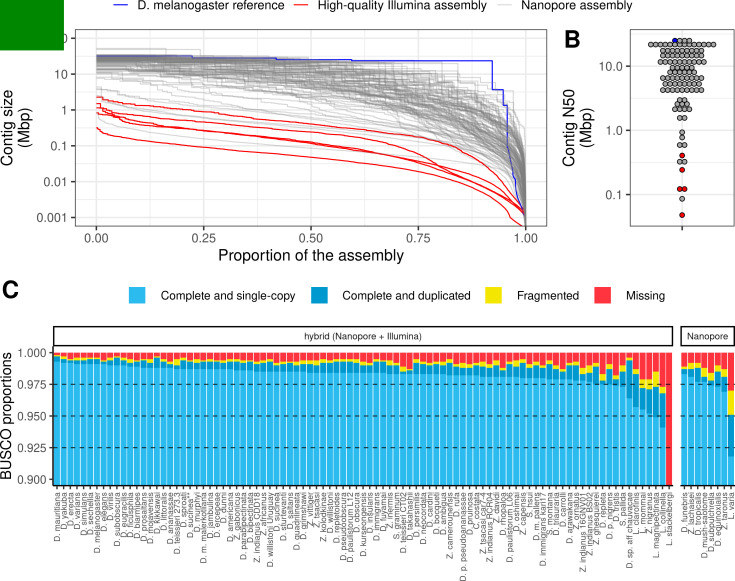
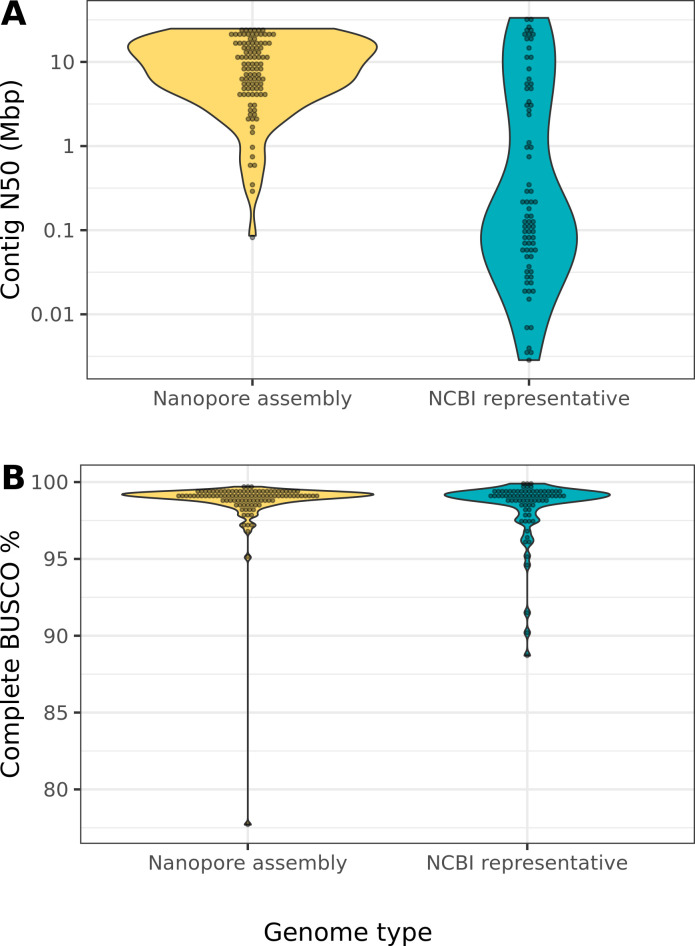
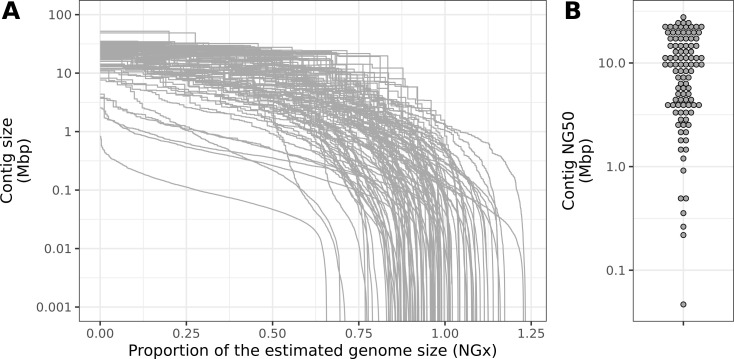
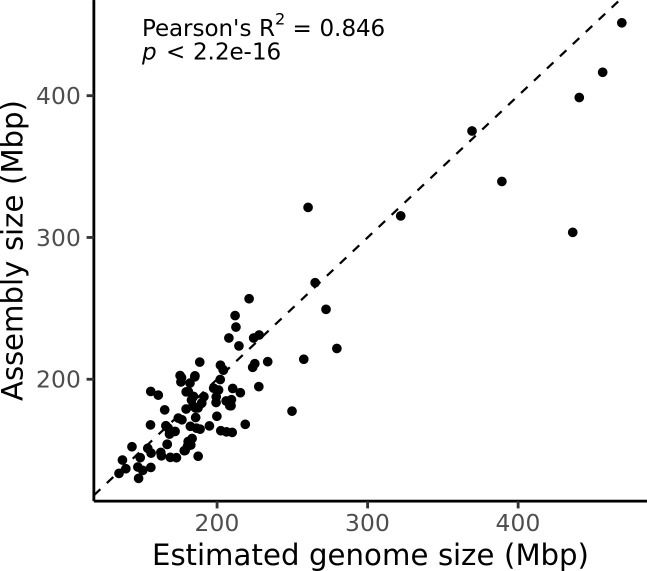
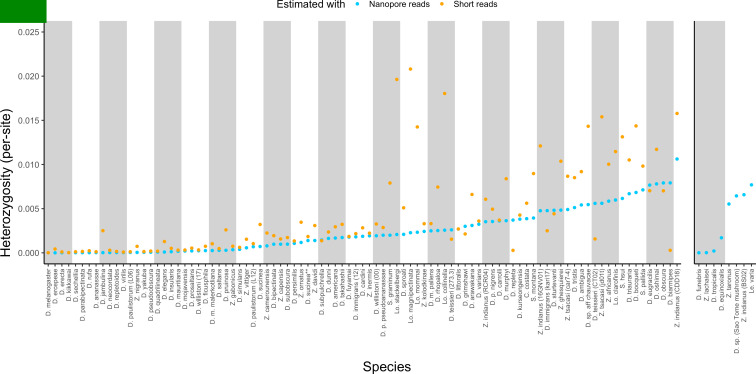
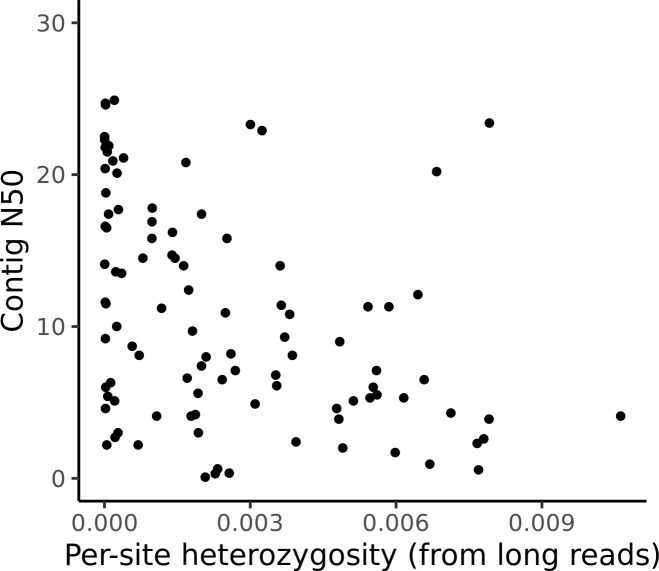
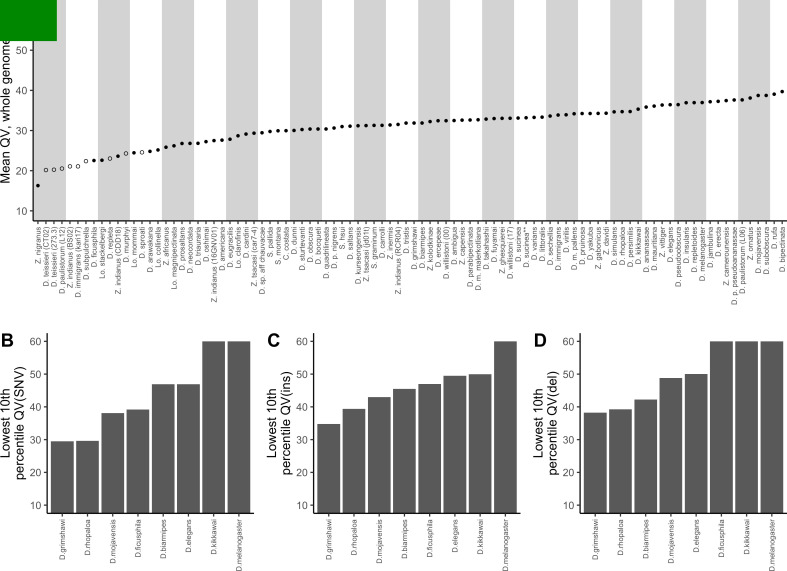
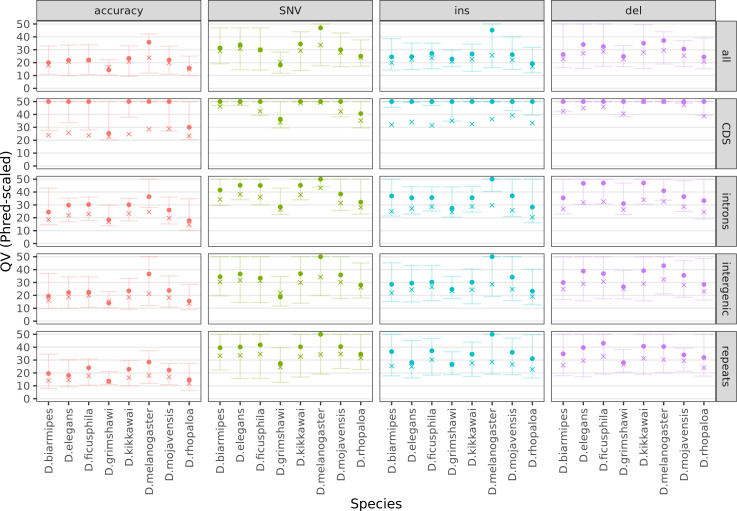
Over 100 years of studies in Drosophila melanogaster and related species in the genus Drosophila have facilitated key discoveries in genetics, genomics, and evolution. While high-quality genome assemblies exist for several species in this group, they only encompass a small fraction of the genus. Recent advances in long-read sequencing allow high-quality genome assemblies for tens or even hundreds of species to be efficiently generated. Here, we utilize Oxford Nanopore sequencing to build an open community resource of genome assemblies for 101 lines of 93 drosophilid species encompassing 14 species groups and 35 sub-groups. The genomes are highly contiguous and complete, with an average contig N50 of 10.5 Mb and greater than 97% BUSCO completeness in 97/101 assemblies. We show that Nanopore-based assemblies are highly accurate in coding regions, particularly with respect to coding insertions and deletions. These assemblies, along with a detailed laboratory protocol and assembly pipelines, are released as a public resource and will serve as a starting point for addressing broad questions of genetics, ecology, and evolution at the scale of hundreds of species.

Keywords: D. melanogaster; Drosophila; Drosophilidae; comparative genomics; evolutionary biology; genetics; genome assembly; genomics; long reads; nanopore.


Conflict of interest statement

BK, JW, DM, OB, ED, AT, AC, DP, ED, JP, JA, DH, TM, EA, MZ, YO, MS, MJ, MV, MT, PE, JG, TK, MT, HW, MW, JD, LM, GM, EB, VK, RH, AT, CJ, DP, NW, AK, DM, DP No competing interests declared

Figures

Figure 1.
Figure 1.. Nanopore-based assemblies are highly contiguous and complete.
(A,B) Assembly contiguity is compared to the D. melanogaster v6.22 reference genome (blue) as well as five recently published, highly contiguous Illumina assemblies (red lines, D. birchii, D. bocki, D. bunnanda, D. kanapiae, D. truncata; Bronski et al., 2020). (A) Nx curves, or the (y-axis) size of each contig when contigs are sorted in descending size order, in relation to the (x-axis) cumulative proportion of the genome assembly that is covered. (B) The distribution of contig N50, the size of the contig at which 50% of the assembly is covered. (C) Assembly completeness assessed by BUSCO v4.0.6 (Seppey et al., 2019). Note, D. equinoxialis was evaluated with BUSCO v4.1.4 due to an issue with v4.0.6. L. stackelbergi has >10% missing BUSCOs. Individual assembly summary statistics are provided in Supplementary file 2.
Figure 1—figure supplement 1.
Figure 1—figure supplement 1.. Nanopore-based assemblies compare favorably to representative genomes on NCBI.
(A) The contig N50 of the representative genome assembly for 75 different species on NCBI (right) is compared to the contig N50s of our assemblies (left). (B) The BUSCO (Simão et al., 2015) completeness (sum of complete single-copy and complete duplicated) of the NCBI assemblies of our assemblies is compared to the BUSCO completeness of our assemblies. The list of drosophilid genomes, contig N50s, and BUSCO completeness statistics were obtained from Hotaling et al., 2021. Note, BUSCO v4 was used for both genome assessments, but the OrthoDB v10 (Kriventseva et al., 2019) Diptera gene set was used to evaluate our assemblies while the OrthoDB v10 Insecta set was used to evaluate the NCBI assemblies.
Figure 1—figure supplement 2.
Figure 1—figure supplement 2.. Large improvements in assembly contiguity from an updated assembly workflow.
Points on the left depict contig N50s from Miller et al., 2018. Points on the right depict contig N50s with our updated assembly workflow. In the updated workflow, ONT raw data are basecalled with Guppy in high-accuracy mode and assembled with Flye v2.6. For D. bipectinata, D. biarmipes, and D. willistoni (depicted with the light orange lines), new ONT sequencing optimized for longer reads and of a different strain than Miller et al., 2018 was performed. For all other species, the same raw data was used for both assembly workflows.
Figure 1—figure supplement 3.
Figure 1—figure supplement 3.. Contiguity metrics standardized by the estimated genome size.
(A) NGx curves, or the (y-axis) size of each contig when contigs are sorted in descending size order, in relation to the (x-axis) cumulative proportion of the estimated genome size that is covered. (B) The distribution of contig NG50, the size of the contig at which 50% of the estimated genome is accounted for.
Figure 1—figure supplement 4.
Figure 1—figure supplement 4.. Estimated genome size is similar to assembly size.
The genome size estimated from read coverage over known single-copy genes in each assembly (x-axis) is compared to the length of each final assembly (y-axis). The dotted line is the 1:1 line.
Figure 2.
Figure 2.. Estimated heterozygosity in the data used for genome assembly.
Per-site SNP heterozygosity (number of heterozygous SNPs/number of callable sites) is plotted for each of the 101 assembled lines. Blue dots represent heterozygosity estimates from Nanopore reads with PEPPER-Margin-DeepVariant (Shafin et al., 2021). Orange dots represent heterozygosity estimates from short reads with BCFtools (Li, 2011). The genomes on the right are for species that did not have available short-read data. Numerical values for these estimates are provided in Supplementary file 4.
Figure 2—figure supplement 1.
Figure 2—figure supplement 1.. Assembly contiguity is not related to sample heterozygosity.
Per-site estimates of heterozygosity are plotted against the contig N50 for all assemblies. No significant correlation (Pearson’s correlation p=0.30) was observed.
Figure 3.
Figure 3.. Nanopore-based Drosophila assemblies are accurate, particularly in coding regions.
(A) Genome-wide, Phred quality scores estimated with the reference-free, k-mer based approach implemented in Merqury (Rhie et al., 2020). Merqury requires a short-read dataset to perform the evaluation. Filled circles represent QV estimates with short-read data from the same strain used for Nanopore sequencing, and empty circles denote estimates using short-read data from a different strain than used for Nanopore sequencing. (B, C, D) Phred quality score cutoffs for the bottom 10th percentile of 100 kb genomic windows, as evaluated with a reference-based approach, in coding sequences only. Quality scores are capped at 60 for visualization purposes. At least 90% of 100 kb windows are this accurate. Only Nanopore assemblies with an NCBI RefSeq genome counterpart of the same strain were evaluated. Accuracy is shown for SNVs (B), insertions (C), and deletions (D) separately. Additional details on quality score estimates are provided in Figure 3—figure supplement 1 and Supplementary file 4.
Figure 3—figure supplement 1.
Figure 3—figure supplement 1.. Variation in sequence accuracy within the genome assemblies.
Phred-scaled quality scores were computed by a reference-based comparison in non-overlapping 100 kb windows. All variants were considered together (accuracy), then SNVs, insertions, and deletions separately. All sequences in each window were considered together (all) then coding sequences, introns, intergenic regions, and repeats separately. All scores above QV50 were set to QV50 for visualization purposes. The cross denotes the mean score, weighted by the bases considered for each window. The dot and both whiskers denote the median, 10th percentile, and 90th percentile scores across all windows, respectively. Only Nanopore assemblies with an NCBI RefSeq genome counterpart of the same strain were evaluated.
Figure 3—figure supplement 2.
Figure 3—figure supplement 2.. Large insertions account for nearly all differences between the Nanopore-based and reference D. melanogaster assembly.
The distribution of indel differences between our Nanopore-based assembly and the reference are shown. Each color represents a unique indel per FlyBase protein-coding gene. Note, the x-axis scale of insertions is much larger than that of deletions. Additional details on each indel are provided in Table S5.
Figure 4.
Figure 4.. Gene content of Muller elements is conserved across drosophilids while gene order changes.
Each node in this graph represents an orthologous marker corresponding to single-copy orthologs annotated by BUSCOv4 (Seppey et al., 2019). An edge between two nodes represents the number of times that BUSCO pair is directly connected within an assembly. Each BUSCO is colored by the chromosome arm in D. melanogaster that it is found on. The ForceAtlas2 (Jacomy et al., 2014) graph layout algorithm was used for visualization.
Figure 5.
Figure 5.. Repeat content varies greatly between drosophilid groups.
For each species, the proportion of each genome annotated with a particular repeat type is depicted. Species relationships were inferred by randomly selecting 250 of the set of BUSCOs (Seppey et al., 2019) that were complete and single-copy in all assemblies. RAxML-NG (Kozlov et al., 2019) was used to build gene trees for each BUSCO then ASTRAL-MP (Yin et al., 2019) to infer a species tree. Repeat annotation was performed with RepeatMasker (Smit et al., 2013) using the Dfam 3.1 (Hubley et al., 2016) and RepBase RepeatMasker edition (Bao et al., 2015) databases. ASTRAL local posterior probabilities are reported at each node.
Figure 5—figure supplement 1.
Figure 5—figure supplement 1.. Assembly contiguity is not determined by repeat content.
There is no relationship (Spearman’s ρ=0.036, p=0.725) between repeat content (as annotated by RepeatMasker) in a genome and the contiguity of the resulting assembly.
Figure 5—figure supplement 2.
Figure 5—figure supplement 2.. The non-repetitive and repetitive portions of the genome both contribute to genome size differences between drosophilids.
Phylogenetically independent contrasts (PICs) are shown for the number of bases in each genome not annotated as repetitive sequence (x-axis) and the number annotated as repeat by RepeatMasker (y-axis). The red dotted line is the best-fitting line through the origin. A positive relationship between the non-repetitive and repetitive portions of the genome is observed (Spearman’s ρ=0.679, p<2.2e-16), suggesting that both play a role in determining the genome size of drosophilids.
Figure 6.
Figure 6.. Highly contiguous assemblies can be obtained with lower coverage of ultra-long reads.
The NGx curve is shown for Drosophila jambulina assemblies at varying levels of coverage. The length of the assembly with the full data is assumed to be the genome size. Read sets used for each assembly were obtained by randomly downsampling the basecalled reads (read N50 ~27.5 kb) to varying (5× to 30×) depth of coverage. Proportionally, these read sets contain ~55% of total sequenced bases in reads longer than 25 kb, ~25% of bases in reads longer than 50 kb, and ~7% of bases in reads longer than 100 kb. Near chromosome scale assemblies (N50>20Mb) were achievable even at 15× to 20× depth with this read length distribution. This corresponds to approximately 8× to 10× depth in reads longer than 25 kb.
Figure 7.
Figure 7.. Flow chart depiction of the assembly pipeline.

References

    1. Adams MD, Celniker SE, Holt RA, Evans CA, Gocayne JD, Amanatides PG, Scherer SE, Li PW, Hoskins RA, Galle RF, George RA, Lewis SE, Richards S, Ashburner M, Henderson SN, Sutton GG, Wortman JR, Yandell MD, Zhang Q, Chen LX, Brandon RC, Rogers YH, Blazej RG, Champe M, Pfeiffer BD, Wan KH, Doyle C, Baxter EG, Helt G, Nelson CR, Gabor GL, Abril JF, Agbayani A, An HJ, Andrews-Pfannkoch C, Baldwin D, Ballew RM, Basu A, Baxendale J, Bayraktaroglu L, Beasley EM, Beeson KY, Benos PV, Berman BP, Bhandari D, Bolshakov S, Borkova D, Botchan MR, Bouck J, Brokstein P, Brottier P, Burtis KC, Busam DA, Butler H, Cadieu E, Center A, Chandra I, Cherry JM, Cawley S, Dahlke C, Davenport LB, Davies P, de Pablos B, Delcher A, Deng Z, Mays AD, Dew I, Dietz SM, Dodson K, Doup LE, Downes M, Dugan-Rocha S, Dunkov BC, Dunn P, Durbin KJ, Evangelista CC, Ferraz C, Ferriera S, Fleischmann W, Fosler C, Gabrielian AE, Garg NS, Gelbart WM, Glasser K, Glodek A, Gong F, Gorrell JH, Gu Z, Guan P, Harris M, Harris NL, Harvey D, Heiman TJ, Hernandez JR, Houck J, Hostin D, Houston KA, Howland TJ, Wei MH, Ibegwam C, Jalali M, Kalush F, Karpen GH, Ke Z, Kennison JA, Ketchum KA, Kimmel BE, Kodira CD, Kraft C, Kravitz S, Kulp D, Lai Z, Lasko P, Lei Y, Levitsky AA, Li J, Li Z, Liang Y, Lin X, Liu X, Mattei B, McIntosh TC, McLeod MP, McPherson D, Merkulov G, Milshina NV, Mobarry C, Morris J, Moshrefi A, Mount SM, Moy M, Murphy B, Murphy L, Muzny DM, Nelson DL, Nelson DR, Nelson KA, Nixon K, Nusskern DR, Pacleb JM, Palazzolo M, Pittman GS, Pan S, Pollard J, Puri V, Reese MG, Reinert K, Remington K, Saunders RD, Scheeler F, Shen H, Shue BC, Sidén-Kiamos I, Simpson M, Skupski MP, Smith T, Spier E, Spradling AC, Stapleton M, Strong R, Sun E, Svirskas R, Tector C, Turner R, Venter E, Wang AH, Wang X, Wang ZY, Wassarman DA, Weinstock GM, Weissenbach J, Williams SM, Woodage T, Worley KC, Wu D, Yang S, Yao QA, Ye J, Yeh RF, Zaveri JS, Zhan M, Zhang G, Zhao Q, Zheng L, Zheng XH, Zhong FN, Zhong W, Zhou X, Zhu S, Zhu X, Smith HO, Gibbs RA, Myers EW, Rubin GM, Venter JC. The genome sequence of Drosophila melanogaster. Science. 2000;287:2185–2195. doi: 10.1126/science.287.5461.2185. - DOI - PubMed
    1. Adams M, McBroome J, Maurer N, Pepper-Tunick E, Saremi NF, Green RE, Vollmers C, Corbett-Detig RB. One fly–one genome: chromosome-scale genome assembly of a single outbred Drosophila melanogaster. Nucleic Acids Research. 2020;356:450. doi: 10.1093/nar/gkaa450. - DOI - PMC - PubMed
    1. Altschul SF, Gish W, Miller W, Myers EW, Lipman DJ. Basic local alignment search tool. Journal of Molecular Biology. 1990;215:403–410. doi: 10.1016/S0022-2836(05)80360-2. - DOI - PubMed
    1. Armstrong J, Hickey G, Diekhans M, Fiddes IT, Novak AM, Deran A, Fang Q, Xie D, Feng S, Stiller J, Genereux D, Johnson J, Marinescu VD, Alföldi J, Harris RS, Lindblad-Toh K, Haussler D, Karlsson E, Jarvis ED, Zhang G, Paten B. Progressive Cactus is a multiple-genome aligner for the thousand-genome era. Nature. 2020;587:246–251. doi: 10.1038/s41586-020-2871-y. - DOI - PMC - PubMed
    1. Bankevich A, Nurk S, Antipov D, Gurevich AA, Dvorkin M, Kulikov AS, Lesin VM, Nikolenko SI, Pham S, Prjibelski AD, Pyshkin AV, Sirotkin AV, Vyahhi N, Tesler G, Alekseyev MA, Pevzner PA. SPAdes: a new genome assembly algorithm and its applications to single-cell sequencing. Journal of computational biology : a journal of computational molecular cell biology. 2012;19:455–477. doi: 10.1089/cmb.2012.0021. - DOI - PMC - PubMed

Publication types