. 2021 Jul 19:10:e66277.
doi: 10.7554/eLife.66277.

Plasmodium falciparum K13 mutations in Africa and Asia impact artemisinin resistance and parasite fitness

Affiliations

Plasmodium falciparum K13 mutations in Africa and Asia impact artemisinin resistance and parasite fitness

Barbara H Stokes et al. Elife. .

Abstract

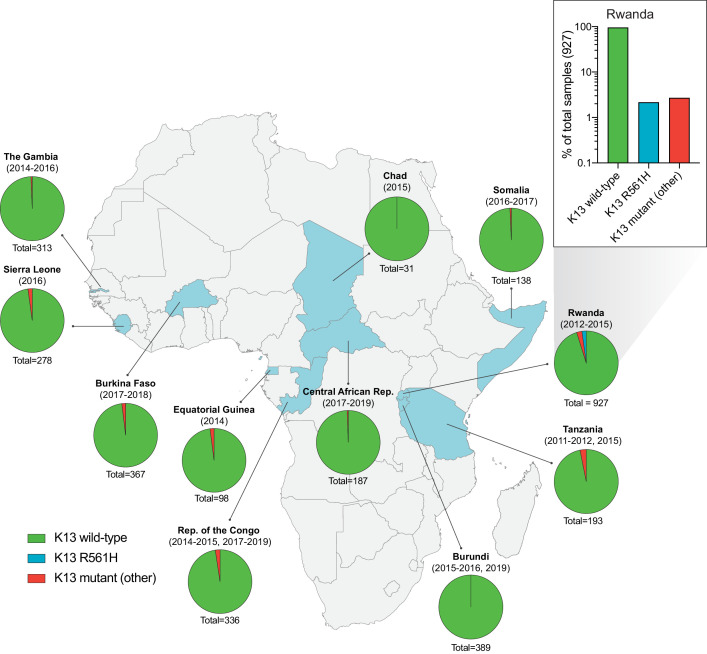
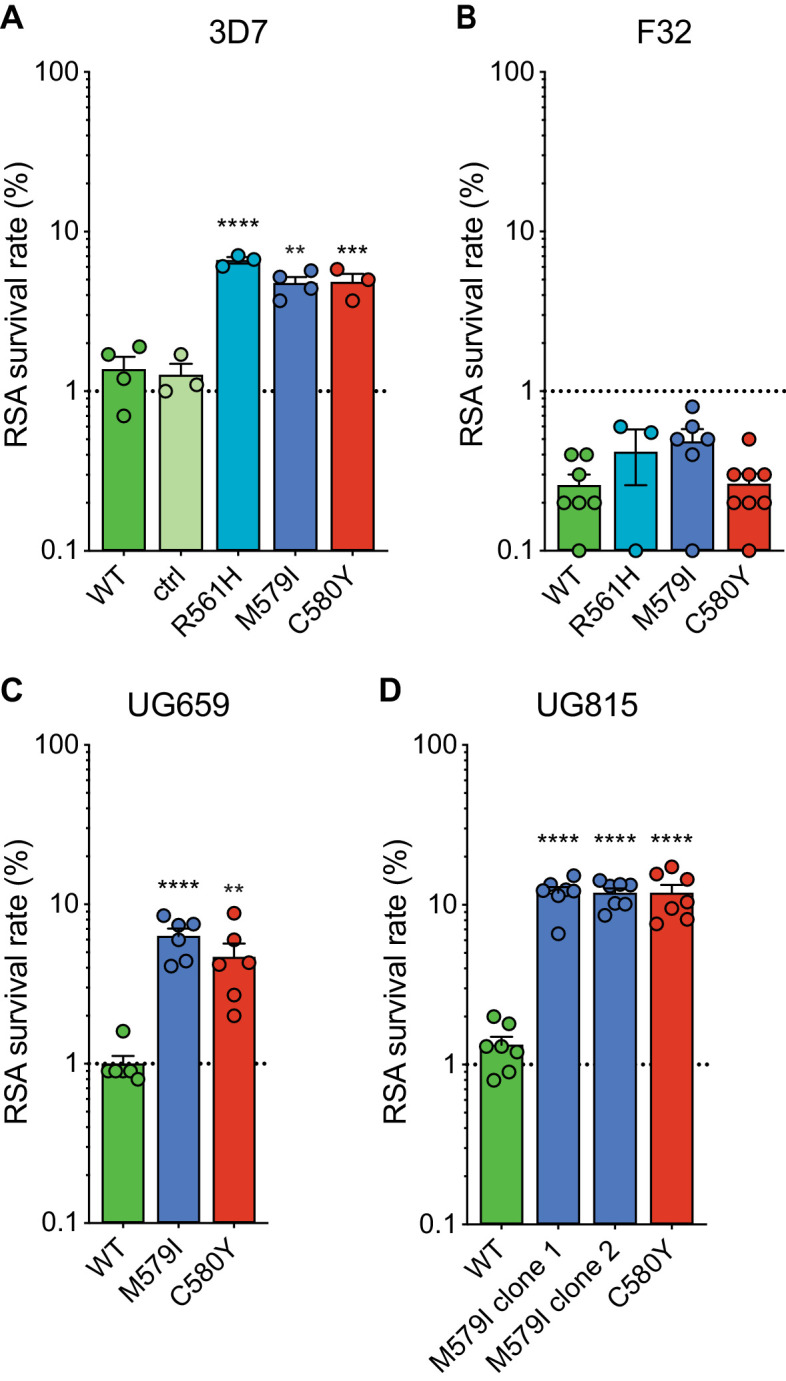
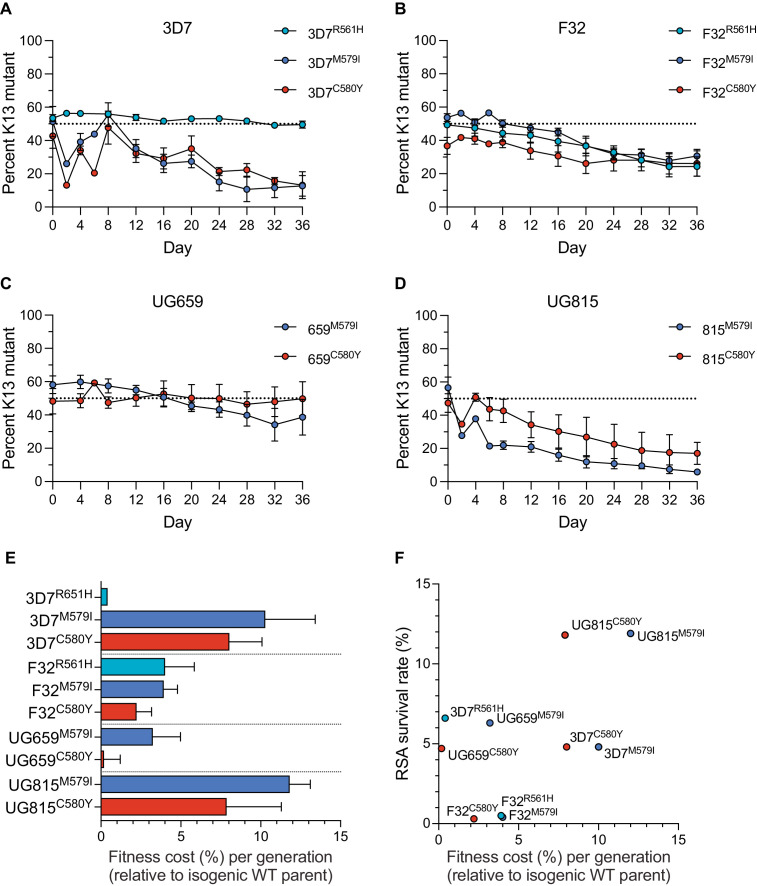
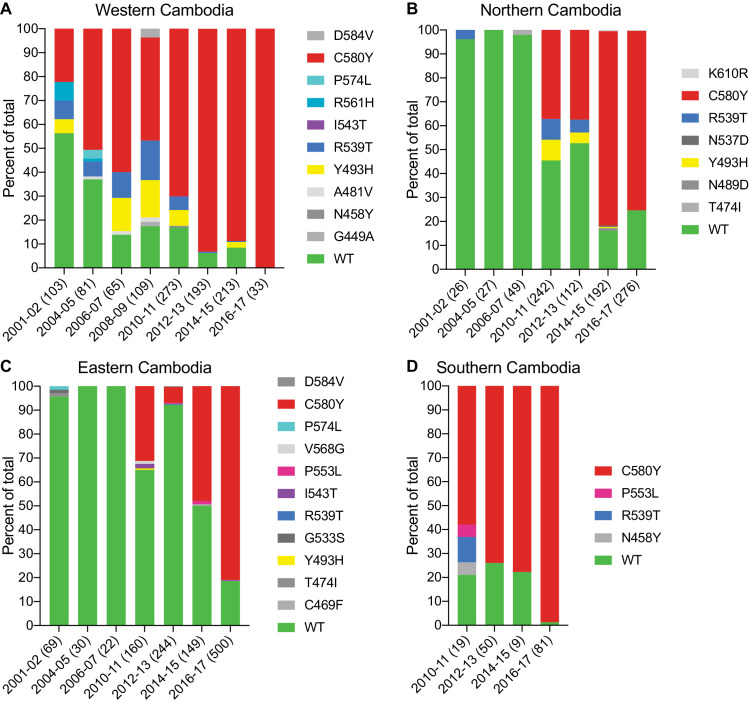
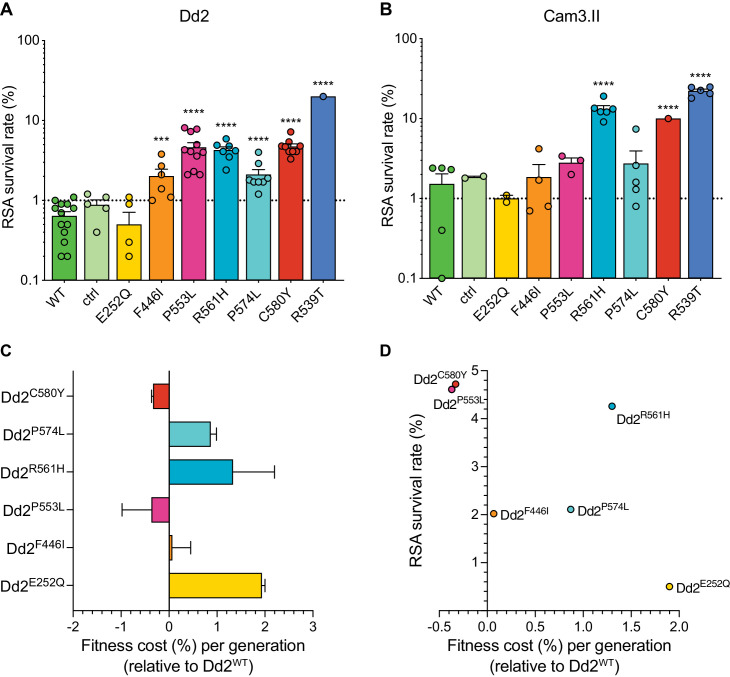
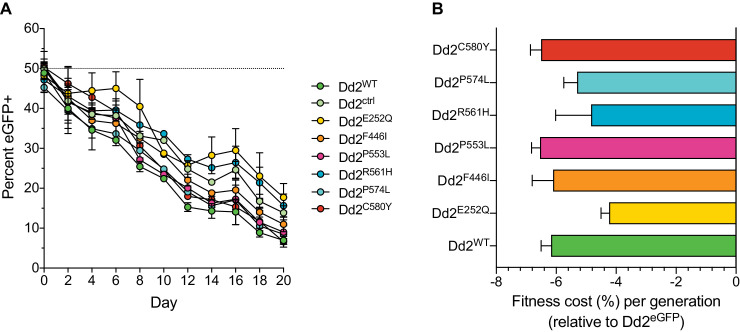
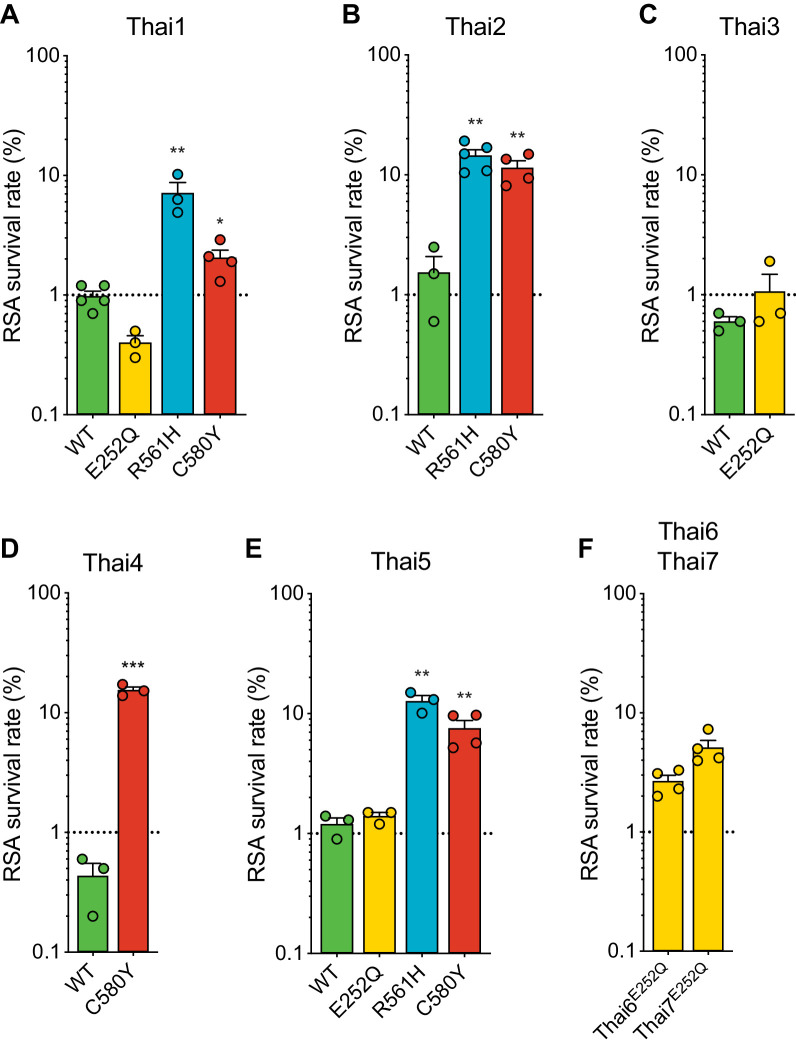
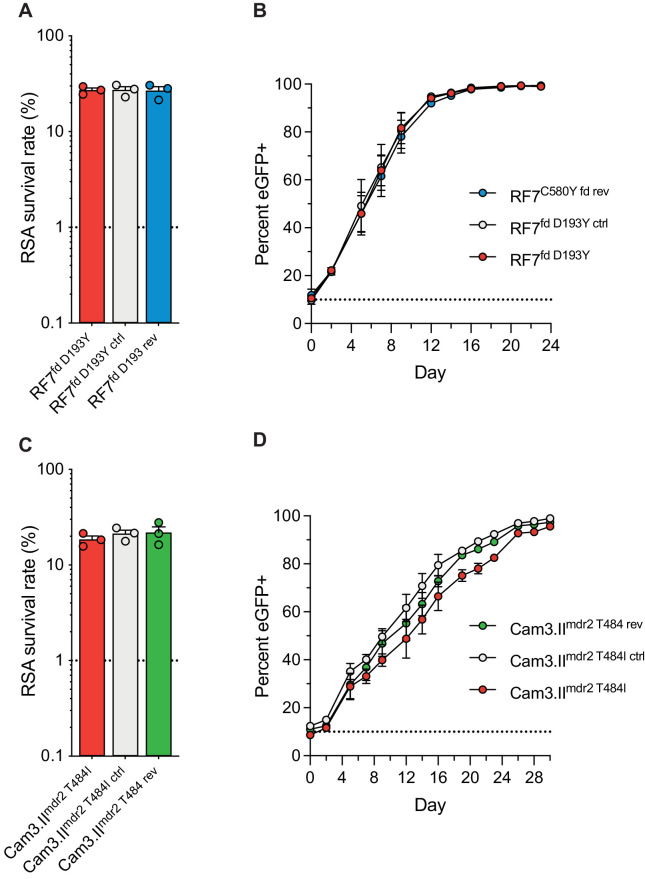
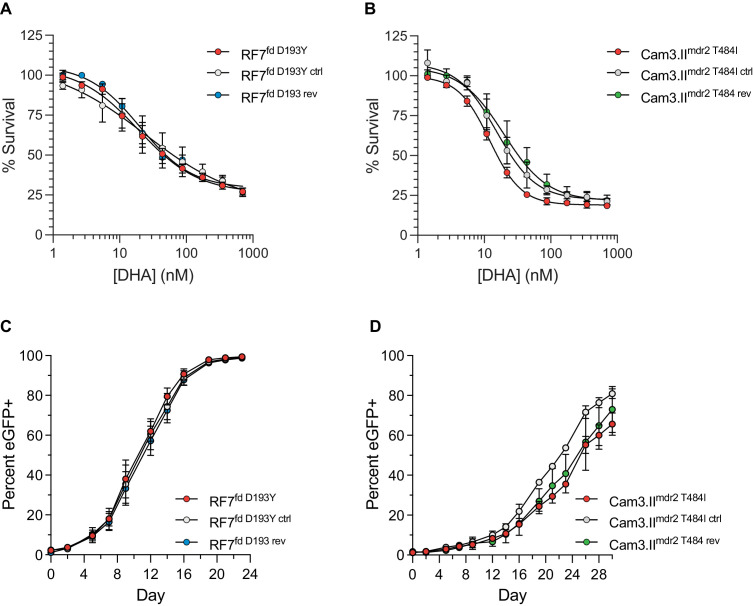
The emergence of mutant K13-mediated artemisinin (ART) resistance in Plasmodium falciparum malaria parasites has led to widespread treatment failures across Southeast Asia. In Africa, K13-propeller genotyping confirms the emergence of the R561H mutation in Rwanda and highlights the continuing dominance of wild-type K13 elsewhere. Using gene editing, we show that R561H, along with C580Y and M579I, confer elevated in vitro ART resistance in some African strains, contrasting with minimal changes in ART susceptibility in others. C580Y and M579I cause substantial fitness costs, which may slow their dissemination in high-transmission settings, in contrast with R561H that in African 3D7 parasites is fitness neutral. In Cambodia, K13 genotyping highlights the increasing spatio-temporal dominance of C580Y. Editing multiple K13 mutations into a panel of Southeast Asian strains reveals that only the R561H variant yields ART resistance comparable to C580Y. In Asian Dd2 parasites C580Y shows no fitness cost, in contrast with most other K13 mutations tested, including R561H. Editing of point mutations in ferredoxin or mdr2, earlier associated with resistance, has no impact on ART susceptibility or parasite fitness. These data underline the complex interplay between K13 mutations, parasite survival, growth and genetic background in contributing to the spread of ART resistance.

Keywords: CRISPR/Cas9; P. falciparum; Plasmodium falciparum; artemisinin resistance; epidemiology; fitness; global health; infectious disease; malaria; microbiology; ring-stage survival.


Conflict of interest statement

BS, SD, KR, SM, JS, NG, ID, KS, JB, KW, JS, TY, LR, EL, FA, CC, IS, AG, RN, CN, AK, AU, SS, OK, MN, MW, RL, FN, TA, PR, DM, DF No competing interests declared

Figures

Figure 1.
Figure 1.. Frequency and distribution of K13 alleles in eleven African countries.
Map of Africa with pie charts representing the proportions of sequenced samples per country that harbor the K13 wild-type sequence (3D7 reference), the R561H variant (the most commonly identified mutation, unique to Rwanda; see inset), or another less frequent non-synonymous K13 mutation. Sample sizes and years of sample collection are indicated. Mutations and numbers of African samples sequenced per country, and prior citations as appropriate, are listed in Figure 1—source data 1.
Figure 2.
Figure 2.. Gene-edited mutant K13 African parasites display variable levels of RSA survival.
(A–D) RSA survival rates for (A) 3D7 (Africa), (B) F32 (Tanzania), (C) UG659 (Uganda), or (D) UG815 (Uganda) K13 wild-type parental lines and CRISPR/Cas9-edited K13 R561H, M579I, or C580Y mutant clones. Unedited parental lines are described in Table 1 and Supplementary file 4. For 3D7, we also included a K13 wild-type control (ctrl) line harboring silent shield mutations at the K13 gRNA cut site. Results show the percentage of early ring-stage parasites (0–3 hr post invasion) that survived a 6 hr pulse of 700 nM DHA, relative to DMSO-treated parasites assayed in parallel. Percent survival values are shown as means ± SEM (detailed in Figure 2—source data 1). Results were obtained from three to eight independent experiments, each performed in duplicate. p Values were determined by unpaired t tests and were calculated for K13 mutant lines relative to their isogenic wild-type lines. ** p<0.01; *** p<0.001; **** p<0.0001.
Figure 2—figure supplement 1.
Figure 2—figure supplement 1.. K13 mutations result in reduced K13 protein levels in African 3D7 parasites.
(A) Representative Western blot of parasite extracts probed with an anti-K13 monoclonal antibody (clone E9) that recognizes full-length K13 (~85 kDa) and lower molecular weight bands, presumably N-terminal degradation products, as previously reported (Gnädig et al., 2020). Tightly synchronized K13 wild-type, R561H, M579I, or C580Y 3D7 parasites were harvested as 0–6 hr ring stages. ERD2 was used as a loading control. Experiments were performed on three independent occasions. (B) Quantification of K13 mutant protein levels versus K13 wild-type protein levels across independent replicates, performed using ImageJ, with all protein levels normalized to the ERD2 loading control. Western blots reveal reduced levels of K13 protein in the three mutant lines relative to wild-type 3D7 parasites. Results are shown as means ± SEM. WT, wild-type.
Figure 3.
Figure 3.. K13 mutations cause differential impacts on in vitro growth rates across gene-edited African strains.
(A–D) Percentages of mutant alleles relative to the wild-type allele over time in (A) 3D7, (B) F32, (C) UG659, and (D) UG815 parasite cultures in which K13 mutant clones were co-cultured at 1:1 starting ratios with isogenic K13 wild-type controls over a period of 36 days. Results, shown as means ± SEM, were obtained from two to five independent experiments, each performed in duplicate. Values are provided in Figure 3—source data 1. (E) The percent reduction in growth rate per 48 hr generation, termed the fitness cost, is presented as mean ± SEM for each mutant line relative to its isogenic wild-type comparator. (F) Fitness costs for mutant lines and isogenic wild-type comparators plotted relative to RSA survival values for the same lines.
Figure 4.
Figure 4.. The K13 C580Y allele has progressively outcompeted all other alleles in Cambodia.
(A–D) Stacked bar charts representing the percentages of sequenced samples expressing the K13 wild-type allele or individual variants, calculated based on the total number of samples (listed in parentheses) for a given period. Sample collection was segregated into four regions in Cambodia (detailed in Figure 4—figure supplement 1). All K13 mutant samples harbored a single non-synonymous nucleotide polymorphism. Mutations and numbers of Cambodian samples sequenced per region/year, including prior citations as appropriate, are listed in Figure 4—source data 1.
Figure 4—figure supplement 1.
Figure 4—figure supplement 1.. Regions of sample collection in Cambodia for K13 sequencing.
Map depicting the fourteen provinces and four regions of Cambodia (western, northern, eastern, and southern) in which samples were collected between 2001 and 2017 for K13 genotyping. Genotyping data are presented in Figure 4.
Figure 5.
Figure 5.. Southeast Asian K13 mutations yield elevated RSA survival and minor impacts on in vitro growth in gene-edited parasite lines.
(A, B) RSA survival rates for Dd2 (Indochina) and Cam3.II (Cambodia) P. falciparum parasites expressing wild-type or mutant K13. Gene-edited parasites were generated using CRISPR/Cas9 or zinc-finger nucleases. Control (ctrl) lines express silent shield mutations at the K13 gRNA cut site. Parental lines are described in Table 1 and Supplementary file 4. Results show the percentages of early ring-stage parasites (0–3 hr post invasion) that survived a 6 hr pulse of 700 nM DHA, relative to DMSO-treated parasites processed in parallel. Percent survival values are shown as means ± SEM (detailed in Figure 5—source data 1). Results were obtained from three to thirteen independent experiments, each performed in duplicate. p Values were determined by unpaired t tests and were calculated for mutant lines relative to the isogenic line expressing wild-type K13. *** p<0.001; **** p<0.0001. (C) Percent reductions in growth rate per 48 hr generation, expressed as fitness costs, for Dd2 mutant lines relative to the Dd2WT line. Fitness costs were determined by co-culturing the Dd2eGFP reporter line with either the Dd2 K13 wild-type parental line (Dd2WT) or gene-edited K13 mutant lines. Co-cultures were maintained for 20 days and percentages of eGFP+ parasites were determined by flow cytometry (see Figure 5—source data 2 and Figure 5—figure supplement 1). Fitness costs were initially calculated relative to the Dd2eGFP reporter line (Figure 5—figure supplement 1) and then normalized to the Dd2WT line. Mean ± SEM values were obtained from three independent experiments, each performed in triplicate. (D) Fitness costs for K13 mutant lines relative to the Dd2WT line plotted against their corresponding RSA survival values.
Figure 5—figure supplement 1.
Figure 5—figure supplement 1.. Southeast Asian K13 mutations result in minor in vitro growth defects in Dd2 parasites, with the exception of the C580Y and P553L mutations.
(A) Percentages of eGFP+ parasites over time in parasite cultures in which the eGFP-expressing Dd2 line was co-cultured in 1:1 mixtures with either the Dd2 K13 WT parental line (Dd2WT) or individual Dd2 gene-edited K13 mutant lines. Co-cultures were maintained over a period of 20 days, and the percentage of eGFP+ parasites in each mixture was determined by flow cytometry. Data are shown as means ± SEM. Results were obtained from three independent experiments, each performed in triplicate. (B) Percent reductions in growth rate per 48 hr generation, denoted as fitness costs, for Dd2WT and K13 edited mutant lines relative to the Dd2eGFP line. Results are shown as means ± SEM.
Figure 6.
Figure 6.. Thai isolates expressing mutant K13 display variable RSA survival rates.
RSA survival rates for (A–E) K13 edited Thai isolates and (F) K13 E252Q unedited Thai lines, shown as means ± SEM (detailed in Figure 6—source data 1). Results were obtained from three to seven independent experiments, each performed in duplicate. p Values were determined by unpaired t tests and were calculated for mutant lines relative to the isogenic line expressing wild-type K13. * p<0.05; ** p<0.01; *** p<0.001.
Figure 7.
Figure 7.. Ferredoxin (fd) and multidrug resistance protein 2 (mdr2) mutations do not impact RSA survival or in vitro growth rates in K13 C580Y parasites.
RSA survival rates for (A) RF7C580Y parasite lines expressing the fd variant D193Y (parent), this variant plus silent shield mutations (edited control), or fd D193 (edited revertant), and (C) Cam3.IIC580Y parasite lines expressing the mdr2 variant T484I (parent), this variant plus silent shield mutations (edited control), or mdr2 T484 (edited revertant). Parental lines are described in Table 1 and Supplementary file 4. Mean ± SEM survival rates were generated from three independent experiments, each performed in duplicate. (B, D) In vitro eGFP-based fitness assays performed with (B) fd and (D) mdr2 RF7C580Y or Cam3.IIC580Y edited lines, respectively. Competitive growth assays were seeded with individual lines plus the Dd2eGFP+ reporter line at starting ratios of 10:1. Results show percentages of eGFP+ parasites over time. Co-cultures were maintained over a period of 24 days (fd edited lines) or 30 days (mdr2 edited lines), and percentages of eGFP+ parasites were determined by flow cytometry. Results were obtained from two to three independent experiments, each performed in triplicate, and are shown as means ± SEM. All values are provided in Figure 7—source data 1, 2, 3.
Figure 7—figure supplement 1.
Figure 7—figure supplement 1.. Ferredoxin (fd) and multidrug resistance protein 2 (mdr2) mutations do not impact RSA survival or in vitro growth in K13 C580Y parasites.
(A, B) Ring-stage survival assays (RSAs) performed on fd and mdr2 edited lines and parental controls (RF7C580Y and Cam3.IIC580Y, respectively). Results show RSA survival rates across a range of DHA concentrations. Survival rates were calculated relative to DMSO-treated parasites processed in parallel. Results were obtained from three independent experiments, each performed in duplicate. Data are shown as means ± SEM. (C, D) In vitro eGFP-based fitness assays performed with (C) fd and (D) mdr2 RF7C580Y or Cam3.IIC580Y edited lines, respectively. Competitive growth assays were seeded with individual lines plus the Dd2eGFP+ reporter line at starting ratios of 100:1. Results show percentages of eGFP+ parasites over time. Co-cultures were maintained over a period of 24 days (fd edited lines) or 30 days (mdr2 edited lines) and percentages of eGFP+ parasites were determined by flow cytometry. Results were obtained from two to three independent experiments, each performed in triplicate, and are shown as means ± SEM.

References

    1. Adams T, Ennuson NAA, Quashie NB, Futagbi G, Matrevi S, Hagan OCK, Abuaku B, Koram KA, Duah NO. Prevalence of Plasmodium falciparum delayed clearance associated polymorphisms in adaptor protein complex 2 mu subunit (pfap2mu) and ubiquitin specific protease 1 (pfubp1) genes in Ghanaian isolates. Parasites & Vectors. 2018;11:175. doi: 10.1186/s13071-018-2762-3. - DOI - PMC - PubMed
    1. Amambua-Ngwa A, Amenga-Etego L, Kamau E, Amato R, Ghansah A, Golassa L, Randrianarivelojosia M, Ishengoma D, Apinjoh T, Maïga-Ascofaré O, Andagalu B, Yavo W, Bouyou-Akotet M, Kolapo O, Mane K, Worwui A, Jeffries D, Simpson V, D'Alessandro U, Kwiatkowski D, Djimde AA. Major subpopulations of Plasmodium falciparum in sub-Saharan Africa. Science. 2019;365:813–816. doi: 10.1126/science.aav5427. - DOI - PubMed
    1. Amato R, Pearson RD, Almagro-Garcia J, Amaratunga C, Lim P, Suon S, Sreng S, Drury E, Stalker J, Miotto O, Fairhurst RM, Kwiatkowski DP. Origins of the current outbreak of multidrug-resistant malaria in Southeast Asia: a retrospective genetic study. The Lancet Infectious Diseases. 2018;18:337–345. doi: 10.1016/S1473-3099(18)30068-9. - DOI - PMC - PubMed
    1. Anderson TJ, Nair S, McDew-White M, Cheeseman IH, Nkhoma S, Bilgic F, McGready R, Ashley E, Pyae Phyo A, White NJ, Nosten F. Population parameters underlying an ongoing soft sweep in Southeast Asian malaria parasites. Molecular Biology and Evolution. 2017;34:131–144. doi: 10.1093/molbev/msw228. - DOI - PMC - PubMed
    1. Ariey F, Witkowski B, Amaratunga C, Beghain J, Langlois AC, Khim N, Kim S, Duru V, Bouchier C, Ma L, Lim P, Leang R, Duong S, Sreng S, Suon S, Chuor CM, Bout DM, Ménard S, Rogers WO, Genton B, Fandeur T, Miotto O, Ringwald P, Le Bras J, Berry A, Barale JC, Fairhurst RM, Benoit-Vical F, Mercereau-Puijalon O, Ménard D. A molecular marker of artemisinin-resistant Plasmodium falciparum malaria. Nature. 2014;505:50–55. doi: 10.1038/nature12876. - DOI - PMC - PubMed

Publication types