. 2021 Jul 19;17(7):e1008577.
doi: 10.1371/journal.pcbi.1008577. eCollection 2021 Jul.

Immune selection suppresses the emergence of drug resistance in malaria parasites but facilitates its spread

Affiliations

Immune selection suppresses the emergence of drug resistance in malaria parasites but facilitates its spread

Alexander O B Whitlock et al. PLoS Comput Biol. .

Abstract

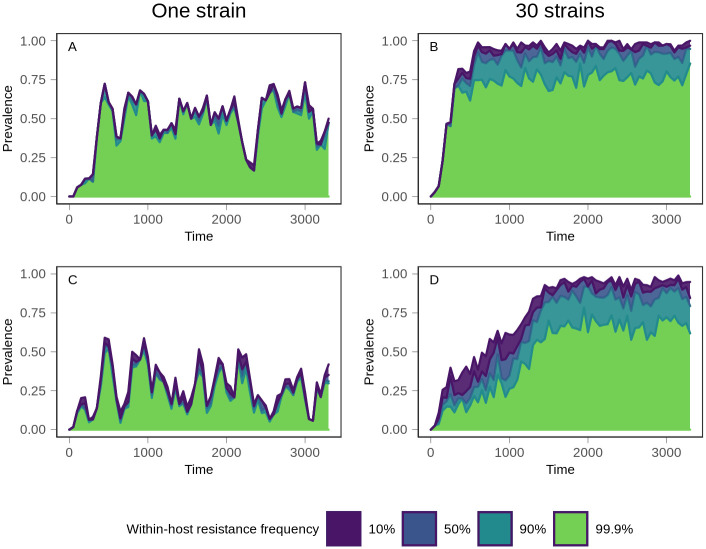
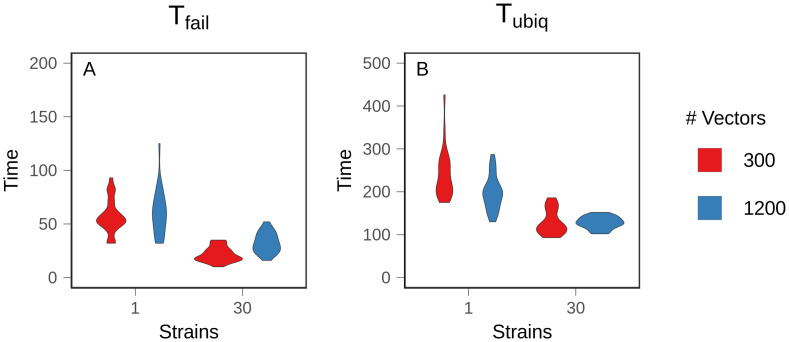
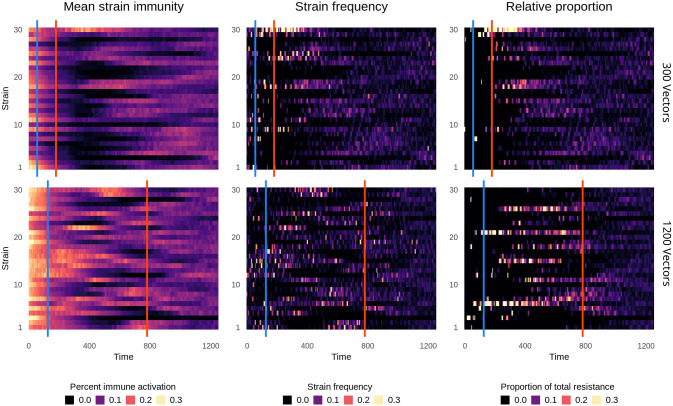
Although drug resistance in Plasmodium falciparum typically evolves in regions of low transmission, resistance spreads readily following introduction to regions with a heavier disease burden. This suggests that the origin and the spread of resistance are governed by different processes, and that high transmission intensity specifically impedes the origin. Factors associated with high transmission, such as highly immune hosts and competition within genetically diverse infections, are associated with suppression of resistant lineages within hosts. However, interactions between these factors have rarely been investigated and the specific relationship between adaptive immunity and selection for resistance has not been explored. Here, we developed a multiscale, agent-based model of Plasmodium parasites, hosts, and vectors to examine how host and parasite dynamics shape the evolution of resistance in populations with different transmission intensities. We found that selection for antigenic novelty ("immune selection") suppressed the evolution of resistance in high transmission settings. We show that high levels of population immunity increased the strength of immune selection relative to selection for resistance. As a result, immune selection delayed the evolution of resistance in high transmission populations by allowing novel, sensitive lineages to remain in circulation at the expense of the spread of a resistant lineage. In contrast, in low transmission settings, we observed that resistant strains were able to sweep to high population prevalence without interference. Additionally, we found that the relationship between immune selection and resistance changed when resistance was widespread. Once resistance was common enough to be found on many antigenic backgrounds, immune selection stably maintained resistant parasites in the population by allowing them to proliferate, even in untreated hosts, when resistance was linked to a novel epitope. Our results suggest that immune selection plays a role in the global pattern of resistance evolution.


Conflict of interest statement

The authors have declared that no competing interests exist.

Figures

Fig 1
Fig 1. Baseline values in equilibrium populations.
Ten populations for each condition were allowed to evolve to equilibrium, and mean values were measured over 100 time steps. Figures show the density distribution of the data. (A) Annual entomological inoculation rate (EIR) (B) Percentage of hosts exposed (C) Percentage of hosts with active infections (D) Complexity of infection, or average number of strains per infection. (E) Average number of strains to which hosts had been exposed.
Fig 2
Fig 2. Population-wide mean strain-specific immunity over time in untreated equilibrium populations.
Immunity to each strain is averaged over all hosts in the population at each time point and is represented as percent activation, where 1 represents the maximum possible strain-specific immunity and 0 represents no immunity. Left: 300 vectors. Right: 1200 vectors. Data shows one representative simulation for each condition.
Fig 3
Fig 3. Time to resistance.
Mean time to resistance was measured over 25 replicate populations. A: 10% prevalence of treatment failure (Tfail). B: 75% prevalence of treatment failure (Tubiq). Treatment failure is assumed to occur when 10% of the parasites within an infection are genetically resistant. Figures show the density distribution of the data. Note different Y axes.
Fig 4
Fig 4. Equilibrium resistance prevalence.
After treated populations had reached equilibrium, the average prevalence of treatment failure (10% within-host frequency of resistance) was measured over 100 time steps in 25 replicate populations. Figures show the density distribution of the data.
Fig 5
Fig 5. Evolutionary trajectory of resistance.
Following introduction of treatment at time 0, the prevalence of within-host frequencies of resistance was monitored over time. The top (purple) line indicates the prevalence of all treatment-resistant infections, defined as infections consisting of at least 10% resistant parasites. Moving down from the top, the prevalence of infections consisting of between 10% and 50% resistant parasites is shown in blue. Below that, the teal section shows the prevalence of infections in which the frequency of resistant parasites is between 50% and 90%. Finally, the bottom section in green shows the prevalence of infections in which resistance is at near fixation within the host, with a frequency exceeding 99.9%. Top row (A and B): 300 vectors. Bottom row (C and D): 1200 vectors. Left column (A and C): one strain. Right column (B and D): 30 strains. The minimal separation between lines in the one strain conditions demonstrates that mixed infections are rare, compared to 30 strain conditions. Data shows one representative simulation for each condition.
Fig 6
Fig 6. Time to resistance with costless resistance.
Mean time to resistance was measured over 25 replicate populations with no cost to resistance. A: 10% prevalence of treatment failure (Tfail). B: 75% prevalence of treatment failure (Tubiq). Figures show the density distribution of the data. Note different Y axes.
Fig 7
Fig 7. Strain-specific patterns of resistance.
Following introduction of treatment at time 0, immunity and resistance were monitored for each strain over time. Top row: 300 vectors. Bottom row: 1200 vectors. Left column: Mean population immunity to each strain, as in Fig 2. Middle column: the frequency of each strain in the population. Right column: The relative contribution of each strain to the total amount of resistance in the entire parasite population. The first line, in blue, denotes Tfail, and the second line, in red, denotes Tubiq. Data shows one representative simulation.

Similar articles

Cited by

References

    1. World Malaria Report. World Health Organization. 2019.
    1. Paget-Mcnicol S, Saul A. Mutation rates in the dihydrofolate reductase gene of Plasmodium falciparum. Parasitology. 2001;122(5):497–505. doi: 10.1017/S0031182001007739 - DOI - PubMed
    1. White NJ, Pongtavornpinyo W. The de novo selection of drug-resistant malaria parasites. Proc R Soc B Biol Sci. 2003;270(1514):545–554. doi: 10.1098/rspb.2002.2241 - DOI - PMC - PubMed
    1. Roper C, Pearce R, Nair S, Sharp B, Nosten F, Anderson T. Intercontinental spread of pyrimethamine-resistant malaria. Science. 2004;305(5687):1124. doi: 10.1126/science.1098876 - DOI - PubMed
    1. Cortese JF, Caraballo A, Contreras CE, Plowe CV. Origin and dissemination of Plasmodium falciparum drug-resistance mutations in South America. J Infect Dis. 2002;186(7):999–1006. doi: 10.1086/342946 - DOI - PubMed

Publication types

MeSH terms