

From reaction kinetics to dementia: A simple dimer model of Alzheimer's disease etiology
- PMID: 34280181
- PMCID: PMC8321409
- DOI: 10.1371/journal.pcbi.1009114
From reaction kinetics to dementia: A simple dimer model of Alzheimer's disease etiology
Abstract
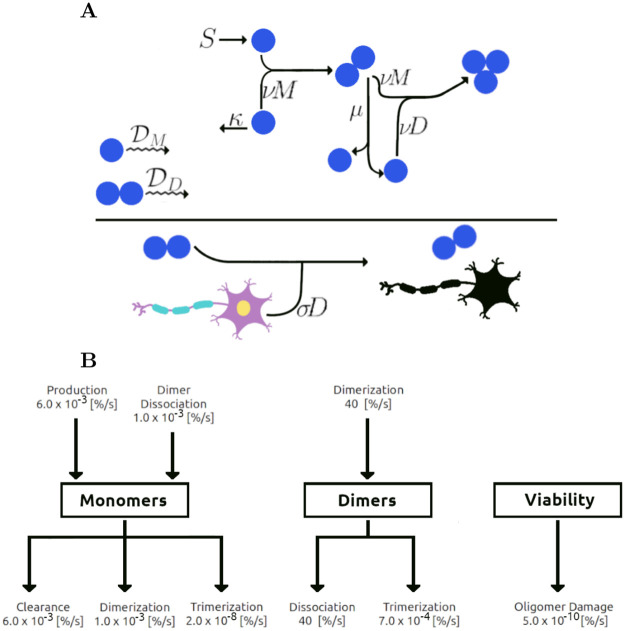
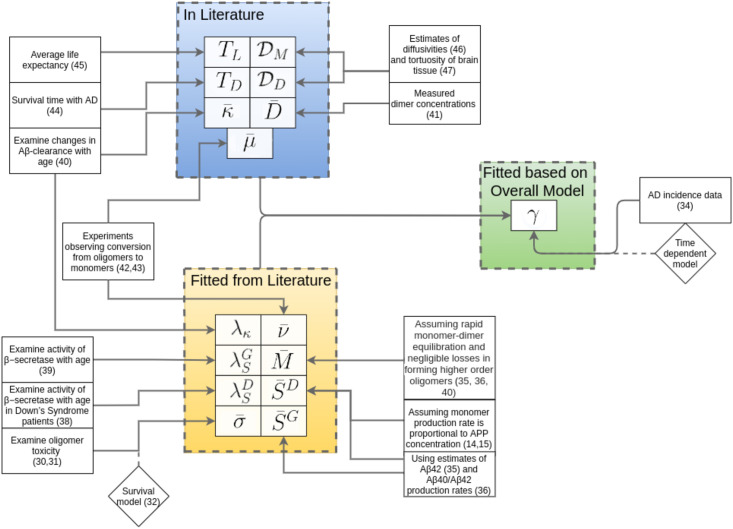
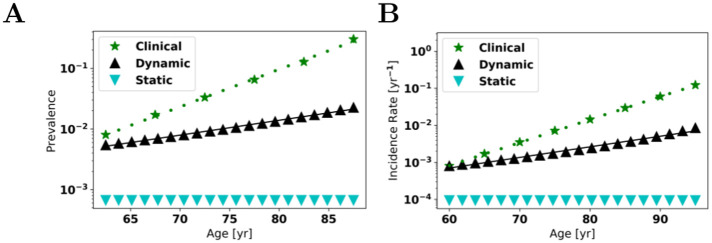
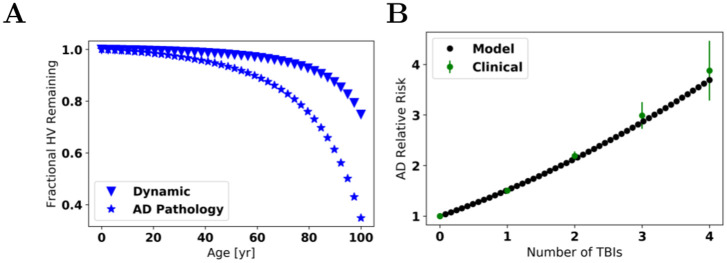
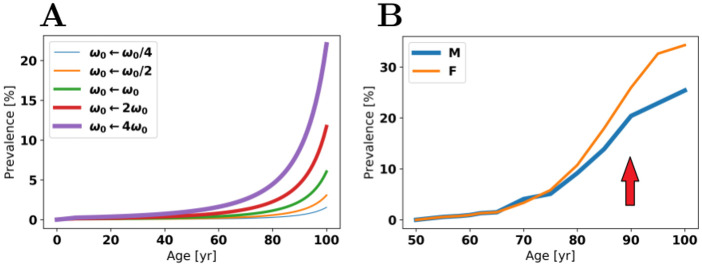
Oligomers of the amyloid β-protein (Aβ) have been implicated in the pathogenesis of Alzheimer's disease (AD) through their toxicity towards neurons. Understanding the process of oligomerization may contribute to the development of therapeutic agents, but this has been difficult due to the complexity of oligomerization and the metastability of the oligomers thus formed. To understand the kinetics of oligomer formation, and how that relates to the progression of AD, we developed models of the oligomerization process. Here, we use experimental data from cell viability assays and proxies for rate constants involved in monomer-dimer-trimer kinetics to develop a simple mathematical model linking Aβ assembly to oligomer-induced neuronal degeneration. This model recapitulates the rapid growth of disease incidence with age. It does so through incorporation of age-dependent changes in rates of Aβ monomer production and elimination. The model also describes clinical progression in genetic forms of AD (e.g., Down's syndrome), changes in hippocampal volume, AD risk after traumatic brain injury, and spatial spreading of the disease due to foci in which Aβ production is elevated. Continued incorporation of clinical and basic science data into the current model will make it an increasingly relevant model system for doing theoretical calculations that are not feasible in biological systems. In addition, terms in the model that have particularly large effects are likely to be especially useful therapeutic targets.
Conflict of interest statement
The authors have declared that no competing interests exist.
Figures

Similar articles
-
Molecular Mechanism and Kinetics of Amyloid-β42 Aggregate Formation: A Simulation Study.ACS Chem Neurosci. 2019 Nov 20;10(11):4643-4658. doi: 10.1021/acschemneuro.9b00473. Epub 2019 Nov 11. ACS Chem Neurosci. 2019. PMID: 31660732 Free PMC article.
-
Endogenous Aβ peptide promote Aβ oligomerization tendency of spiked synthetic Aβ in Alzheimer's disease plasma.Mol Cell Neurosci. 2021 Mar;111:103588. doi: 10.1016/j.mcn.2021.103588. Epub 2021 Jan 8. Mol Cell Neurosci. 2021. PMID: 33422673
-
Dietary DHA supplementation in an APP/PS1 transgenic rat model of AD reduces behavioral and Aβ pathology and modulates Aβ oligomerization.Neurobiol Dis. 2015 Oct;82:552-560. doi: 10.1016/j.nbd.2015.09.002. Epub 2015 Sep 12. Neurobiol Dis. 2015. PMID: 26369878 Free PMC article.
-
Alzheimer's disease.Subcell Biochem. 2012;65:329-52. doi: 10.1007/978-94-007-5416-4_14. Subcell Biochem. 2012. PMID: 23225010 Review.
-
Exploring the Potential of Therapeutic Agents Targeted towards Mitigating the Events Associated with Amyloid-β Cascade in Alzheimer's Disease.Int J Mol Sci. 2020 Oct 9;21(20):7443. doi: 10.3390/ijms21207443. Int J Mol Sci. 2020. PMID: 33050199 Free PMC article. Review.
Cited by
-
A scoping review of mathematical models covering Alzheimer's disease progression.Front Neuroinform. 2024 Mar 14;18:1281656. doi: 10.3389/fninf.2024.1281656. eCollection 2024. Front Neuroinform. 2024. PMID: 38550514 Free PMC article.
-
Roles of astrocytes and prions in Alzheimer's disease: insights from mathematical modeling.J Biol Phys. 2024 Jun;50(2):149-179. doi: 10.1007/s10867-023-09652-0. Epub 2023 Dec 29. J Biol Phys. 2024. PMID: 38157152 Free PMC article.
-
On the interaction of a donepezil-huprine hybrid with synthetic membrane models.Neural Regen Res. 2023 Feb;18(2):333-334. doi: 10.4103/1673-5374.343903. Neural Regen Res. 2023. PMID: 35900422 Free PMC article. No abstract available.
-
Data-Driven Modeling of Amyloid-beta Targeted Antibodies for Alzheimer's Disease.Res Sq [Preprint]. 2025 Apr 3:rs.3.rs-6316455. doi: 10.21203/rs.3.rs-6316455/v1. Res Sq. 2025. PMID: 40235513 Free PMC article. Preprint.
-
A computational model of Alzheimer's disease at the nano, micro, and macroscales.Front Neuroinform. 2024 Mar 22;18:1348113. doi: 10.3389/fninf.2024.1348113. eCollection 2024. Front Neuroinform. 2024. PMID: 38586183 Free PMC article.
References
-
- Kochanek KD, Murphy SL, Xu J, Tejada-Vera B. Deaths: Final Data for 2014. National Vital Statistics Reports. 2019;65(4):1–121. - PubMed
-
- Ono K, Condron MM, Teplow DB. Structure-neurotoxicity relationships of amyloid β-protein oligomers. Proceedings of the National Academy of Sciences USA. 2009;106(35):14745–14750. Available from: http://www.ncbi.nlm.nih.gov/entrez/query.fcgi?cmd=Retrieve&db=PubMed&dop.... - PMC - PubMed
-
- Roychaudhuri R, Yang M, Hoshi MM, Teplow DB. Amyloid β-Protein Assembly and Alzheimer Disease. Journal of Biological Chemistry. 2009;284(8):4749–4753. Available from: http://www.jbc.org/content/284/8/4749.short. - PMC - PubMed
