. 2021 Jul 19;17(7):e1009232.
doi: 10.1371/journal.pcbi.1009232. eCollection 2021 Jul.

Multi-scale simulations of the T cell receptor reveal its lipid interactions, dynamics and the arrangement of its cytoplasmic region

Affiliations

Multi-scale simulations of the T cell receptor reveal its lipid interactions, dynamics and the arrangement of its cytoplasmic region

Dheeraj Prakaash et al. PLoS Comput Biol. .

Abstract

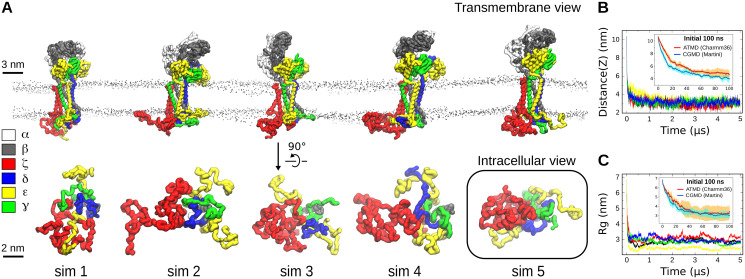
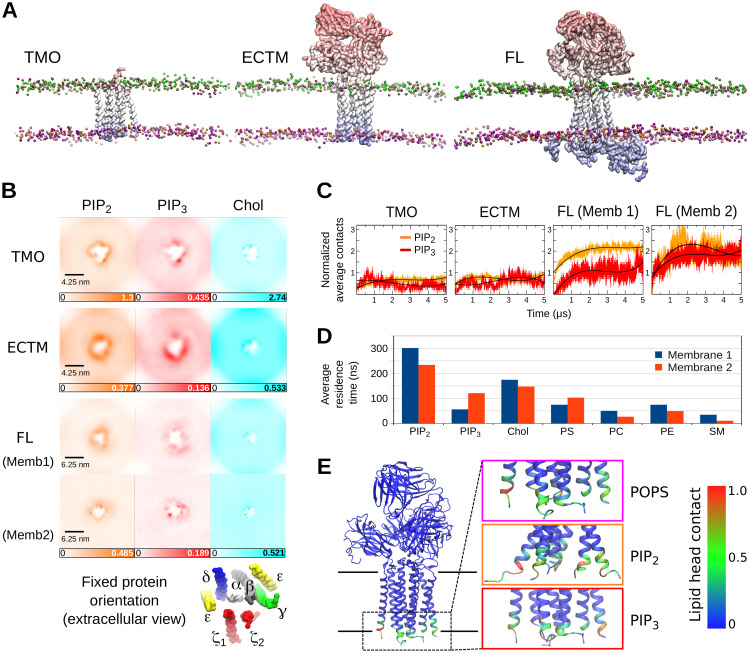
The T cell receptor (TCR-CD3) initiates T cell activation by binding to peptides of Major Histocompatibility Complexes (pMHC). The TCR-CD3 topology is well understood but the arrangement and dynamics of its cytoplasmic tails remains unknown, limiting our grasp of the signalling mechanism. Here, we use molecular dynamics simulations and modelling to investigate the entire TCR-CD3 embedded in a model membrane. Our study demonstrates conformational changes in the extracellular and transmembrane domains, and the arrangement of the TCR-CD3 cytoplasmic tails. The cytoplasmic tails formed highly interlaced structures while some tyrosines within the immunoreceptor tyrosine-based activation motifs (ITAMs) penetrated the hydrophobic core of the membrane. Interactions between the cytoplasmic tails and phosphatidylinositol phosphate lipids in the inner membrane leaflet led to the formation of a distinct anionic lipid fingerprint around the TCR-CD3. These results increase our understanding of the TCR-CD3 dynamics and the importance of membrane lipids in regulating T cell activation.


Conflict of interest statement

The authors have declared that no competing interests exist.

Figures

Fig 1
Fig 1. The T cell receptor structure.
(A) Model of the entire T cell receptor used in our simulations. (B) Electrostatic profile of the TCR-CD3. A range of ±5 kT/e was used to indicate the electronegative and electropositive regions as shown in red and blue respectively. The calculation of the electrostatic profile was done using the APBS tool [18].
Fig 2
Fig 2. Association of the TCR-CD3 cytoplasmic region with the membrane.
(A) Side view of the entire TCR-CD3 (top) and intracellular view of its cytoplasmic region (bottom) taken from the end of the five CGMD simulations of membrane 1. The box highlights the most common CYR conformation calculated by the clustering analysis. (B) Distances between the center of mass (COM) of the TCR-CD3 CYR and the COM of membrane 1 calculated from the five CGMD simulations along the vertical (Z) axis versus time. (C) Radius of gyration (Rg) of the TCR-CD3 CYR versus time from all CGMD simulations. In (B) and (C), distance(Z) and Rg were also calculated from ATMD simulations performed for 100 ns. Comparison of the average distance(Z) and Rg between the ATMD (red) and CGMD (blue) simulations is shown in the inset graph. Standard deviation is shown in cyan for CGMD and in orange for ATMD.
Fig 3
Fig 3. Interactions of ITAM tyrosines with the hydrophobic region of the membrane.
(A) Normalized number of contacts of ζ and CD3 subunits with lipid acyl chains in membrane 1 (coloured by subunit) and membrane 2 (grey). The position of the ITAM tyrosines is indicated by arrows. For the normalization, the number of contacts of each residue was divided by the number of lipids in the membrane and the number of simulation frames. (B) Transmembrane helix tilt angle distribution of each subunit calculated from all simulations from membrane 1 (top row) and membrane 2 (bottom row). The black dotted lines represent zero tilt angle and the coloured dotted lines represent the initial tilt angles of the transmembrane helices of each subunit.
Fig 4
Fig 4. Interactions of the TCR-CD3 with lipid headgroups.
(A) Normalized number of contacts of each full-length TCR-CD3 subunit with lipid headgroups. The normalization (N) is done by dividing the number of lipid contacts of each residue (n1) by the number of the specific lipid in the bilayer (n2) and by the number of simulation frames (n3) i.e. N = n1/n2/n3. Interactions of each TCR-CD3 subunit with anionic lipids are shown on the right whereas those with neutral lipids are shown on the left. The scale of non-anionic interactions was magnified 10 times (scale: 0 to 0.1) for clarity. The ITAMs (red lines) of ζ and all CD3 subunits, the BRS motifs (blue lines) of CD3ε and ζ subunits, and poly-proline motifs (black lines) of the CD3ε subunits are also indicated. (B) Contacts of the TCR-CD3 with each lipid headgroup type are normalized separately on a scale of 0 to 1 and mapped as a colour gradient (blue: low, green: medium, red: high) on the TCR-CD3 structure extracted from the end of a simulation.
Fig 5
Fig 5. Cholesterol interactions and clustering of PIP lipids around the TCR-CD3.
(A) Snapshots from the three sets of CGMD simulations (TMO, ECTM, FL) performed in this study. Here, only the protein and the lipid phosphate groups are shown for clarity. (B) Extracellular view of the densities of PIP2, PIP3 and cholesterol molecules in the XY plane of the membrane from all five CGMD simulations combined. The protein was fixed in the center and its TMR orientation is shown below. (C) Normalized average number of PIP2 and PIP3 lipids contacting the protein in all CGMD simulations (TMO, ECTM, FL) versus time. Normalization was done by dividing the number of PIP2 and PIP3 lipid contacts by their respective number in the membrane. The smoothened black lines are a cubic regression of the number of PIP contacts across time. (D) Average residence time of all lipid types in membrane 1 and 2. (E) Interaction of the TCR-CD3 cationic anchor with anionic lipids mapped onto the ECTM structure.
Fig 6
Fig 6. Conformational changes within the TCR-CD3 during our simulations.
(A) Extracellular view of the TCR-CD3 TMR conformation from the cryo-EM structure (PDB:6JXR) compared to the TMR conformational change seen in the CGMD simulations. This conformational change was retained in the backmapped ATMD simulations throughout the 250 ns simulation time. (B) New interactions of the TCRα variable domain and of TCRβ constant domain with CD3δ (left), and of the TCRβ variable domain with CD3γ (right) seen in the backmapped ATMD simulations. (C) Snapshot from the end of one of our backmapped ATMD simulations of the entire TCR-CD3. The regions highlighted in boxes show pulled-in POPE headgroups whose amine (NH3) groups interact with the anionic sidechains of CD3 TMRs. The pulled-in POPE lipids are shown in cyan with their oxygen atoms shown in red and nitrogen atoms in blue. Hydrogen atoms are not shown for clarity. Anionic and cationic protein residues are represented as licorice sticks in red and blue, respectively. The TMR helices are shown as transparent cartoons. Water molecules are shown as transparent red spheres and the phosphorus atoms of all phospholipids are shown as black spheres defining the surface of the membrane. (D) Number of contacts of anionic residues of CD3 TMRs with nitrogen (N) atoms of POPC and POPE lipids from all backmapped ATMD simulations combined. (E) Extracellular view of the relative height of nitrogen atoms of all outer leaflet lipids (POPC, POPE, DPSM) mapped as a colour gradient from dark blue (low) to yellow (high). The TCR-CD3 TMR orientation is fixed in the center as shown in (A).

Similar articles

Cited by

References

    1. Courtney AH, Lo WL, Weiss A. TCR Signaling: Mechanisms of Initiation and Propagation. Trends in Biochemical Sciences. Elsevier Ltd; 2018. pp. 108–123. doi: 10.1016/j.tibs.2017.11.008 - DOI - PMC - PubMed
    1. Mariuzza RA, Agnihotri P, Orban J. The structural basis of T-cell receptor (TCR) activation: An enduring enigma. Journal of Biological Chemistry. American Society for Biochemistry and Molecular Biology Inc.; 2019. pp. 914–925. doi: 10.1074/jbc.REV119.009411 - DOI - PMC - PubMed
    1. Call ME, Pyrdol J, Wiedmann M, Wucherpfennig KW. The organizing principle in the formation of the T cell receptor-CD3 complex. Cell. 2002;111: 967–979. doi: 10.1016/s0092-8674(02)01194-7 - DOI - PMC - PubMed
    1. Dong D, Zheng L, Lin J, Zhang B, Zhu Y, Li N, et al.. Structural basis of assembly of the human T cell receptor–CD3 complex. Nature. 2019;573: 546–552. doi: 10.1038/s41586-019-1537-0 - DOI - PubMed
    1. Kuhns MS, Davis MM. Disruption of Extracellular Interactions Impairs T Cell Receptor-CD3 Complex Stability and Signaling. Immunity. 2007;26: 357–369. doi: 10.1016/j.immuni.2007.01.015 - DOI - PubMed

Publication types

MeSH terms

Substances