Clinical Trial
. 2021 Dec 9;138(23):2383-2395.
doi: 10.1182/blood.2021011787.

BTK inhibition sensitizes acute lymphoblastic leukemia to asparaginase by suppressing the amino acid response pathway

Affiliations
Clinical Trial

BTK inhibition sensitizes acute lymphoblastic leukemia to asparaginase by suppressing the amino acid response pathway

Miriam Butler et al. Blood. .

Abstract

Asparaginase (ASNase) therapy has been a mainstay of acute lymphoblastic leukemia (ALL) protocols for decades and shows promise in the treatment of a variety of other cancers. To improve the efficacy of ASNase treatment, we used a CRISPR/Cas9-based screen to identify actionable signaling intermediates that improve the response to ASNase. Both genetic inactivation of Bruton's tyrosine kinase (BTK) and pharmacological inhibition by the BTK inhibitor ibrutinib strongly synergize with ASNase by inhibiting the amino acid response pathway, a mechanism involving c-Myc-mediated suppression of GCN2 activity. This synthetic lethal interaction was observed in 90% of patient-derived xenografts, regardless of the genomic subtype. Moreover, ibrutinib substantially improved ASNase treatment response in a murine PDX model. Hence, ibrutinib may be used to enhance the clinical efficacy of ASNase in ALL. This trial was registered at www.clinicaltrials.gov as # NCT02884453.


Figures

None
Graphical abstract
Figure 1.
Figure 1.
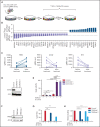
CRISPR/Cas9-based kinome screen identify modifiers of ASNase sensitivity in BCP-ALL. (A) Schematic representation of our screening strategy. Nalm6 cells were transduced stepwise with a doxycycline-inducible Cas9 and a kinome sgRNA library. Cells were cultured for 2 weeks in the presence of 2 μg/mL of doxycycline to induce Cas9 expression and 1 week in the absence of doxycycline. Then, cells were treated for 2 weeks with 5 IU/mL of ASNase, DNA was isolated and subjected to massively parallel sequencing, and results were analyzed using the MAGeCK algorithm. (B) Gene list of expressed gRNA targets that significantly modulate ASNase response, ranked by P value calculated using the MAGeCK algorithm. (C) Counts of individual gRNAs targeting TRIB3, GCN2, and BTK, respectively, before and after ASNase treatment. (D,F) Immunoblot analysis of TRIB3 or GCN2 protein expression in cells upon CRISPR/Cas9-based targeting of GCN2 or TRIB3, respectively. (E) ASNase-induced cell death as determined by quantification of cells positive for amine-reactive dyes using flow cytometry in Nalm6 WT and Nalm6 GCN2-deleted cells after a 3-day treatment with 1 IU/mL of ASNase. Each bar represents a mean of 3 independent experiments. ***P < .001; **P < .01; ***P < .05 (2-tailed, unpaired Student t test). (G) ASNase-induced cell death as determined by quantification of cells in subG1 phase using flow cytometry of Hoechst-stained cells. Bars represent mean ± standard error of the mean (SEM) of n = 3 independent experiments. ***P < .001; **P < .01; ***P < .05 (2-tailed, unpaired Student t test). (H) Cell viability as measured by MTT in Nalm6 WT, and TRIB3del cells after treatment with the indicated dose of ASNase. Bars represent mean ± SEM of n = 3 independent experiments. ***P < .001; **P < .01; ***P < .05 (2-tailed, unpaired Student t test).
Figure 2.
Figure 2.
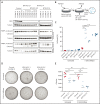
Targeted KO of BTK sensitizes BCP-ALL cell lines to ASNase. (A) Immunoblot analysis of BTK protein expression in single cell clones upon CRISPR/Cas9-based targeting of BTK and apoptosis induction as measured by immunoblot analysis of PARP in Nalm6 WT and Nalm6 BTK-deleted cells after a 7-day treatment with 5 IU/mL of ASNase. Representative blot of 3 independent experiments. (B) Schematic overview of experimental procedure. Nalm6 WT and Nalm6 BTK-deleted cells were treated with 5 IU/mL of ASNase for 7 days, followed by direct evaluation of apoptosis or recovery capacity in a clonogenic assay after washout of the ASNase. (C) ASNase-induced cell death as determined by quantification of cells positive for amine-reactive dyes using flow cytometry in Nalm6 WT and Nalm6 BTK-deleted cells after a 7-day treatment with 5 IU/mL of ASNase. Each data point represents a mean of 1 clone of 3 independent experiments. Mean of all clones is indicated by line. ***P < .001; **P < .01; ***P < .05 (2-tailed, unpaired Student t test). (D-E) Clonogenic proliferation assay of Nalm6 WT and Nalm6 BTK-deleted cells. After a 7-day treatment with 5 IU/mL of ASNase 5000 viable (trypan blue–negative) cells from each sample were seeded in soft agar. Recovery capacity was determined by quantification of colonies. Representative of 3 independent experiments. ***P < .001; **P < .01; ***P < .05 (2-tailed, unpaired Student t test).
Figure 3.
Figure 3.
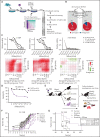
The BTK inhibitor ibrutinib potentiates ASNase-induced apoptosis. (A) Schematic overview of the experimental procedure. BCP-ALL cell lines were treated with ASNase, ibrutinib, or a combination of both for 7 days, followed by direct evaluation of apoptosis or recovery capacity in a clonogenic assay after washout of the ASNase. (B) Apoptosis induction as measured by immunoblot analysis of PARP in BCP-ALL cell lines. Nalm6, Sem, and Reh cells were treated with indicated doses of ASNase and ibrutinib. Representative of 3 independent experiments. (C-D) Clonogenic proliferation assay of Nalm6 and Sem cells. After 7 days’ treatment with indicated doses of ibrutinib and ASNase 5000 to 10 000 viable (trypan blue–negative) cells from each sample were seeded in soft agar. Recovery capacity was determined by quantification of colonies. Bars represent mean ± SEM of n = 3 replicates of 1 experiment. Representative of 3 independent experiments. ***P < .001; **P < .01; ***P < .05 (2-tailed, unpaired Student t test).
Figure 4.
Figure 4.
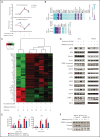
Ibrutinib synergizes with ASNase treatment in a large panel of ALL PDX ex vivo and induces a delay in leukemia development in vivo. (A) Schematic overview representing the workflow used to determine ex vivo drug responses in PDX samples. ALL-PDX samples were seeded on hTERT-immortalized mesenchymal stem cells and treated with ASNase, ibrutinib, or combinations of both. After 3 and 7 days of incubation, cell death was analyzed by automated microscopy using a live cell staining using CyQuant (synergy matrix). (B) Overview of the calculated drug interactions between ASNase and ibrutinib in the PDX samples. (C) Dose-response curves and synergy matrix plots showing δ-scores of 3 representative ALL PDX samples treated with drug matrix of ASNase and ibrutinib (upper panel). (D) ASNase-induced cell death as determined by quantification of cells positive for amine-reactive dyes using flow cytometry in a primary refractory ALL patient sample. Cells were seeded on hTERT-immortalized mesenchymal stem cells and treated with indicated doses of ASNase in the presence or absence of 10 μM of ibrutinib. (E) Schematic overview of the experimental procedure. NSG mice were engrafted with 2 ALL-PDX 2 weeks before start of treatment with vehicle, 300 IU/kg of ASNase (days 1, 4, and 7), 25 mg/kg of ibrutinib (days 1 to 9), or a combination of both. Leukemia development was followed over time by weekly determination of the percentage of human CD10+, CD45+, and CD19+ cells in the blood. Postmortem, histological analysis of organs was executed. (F) Leukemia development as determined by percentage of human CD10 cells detected by flow cytometry in peripheral blood samples of mice treated with ibrutinib, ASNase, or a combination of both. Lines represent percentage of human CD10+ cells in 1 mouse. (G) Survival analysis of mice of different treatment groups. ***P < .001; **P < .01; ***P < .05 (log-rank (Mantel-Cox) test).
Figure 5.
Figure 5.
BTK signaling intersects with the amino acid stress response pathway. (A) Fold induction of fragments per kilobase million (FPKM) values of RNA expression of genes upregulated (upper panel) or downregulated (lower panel) in response to ASNase treatment while suppressed (upper panel) or induced (lower panel) when combined with ibrutinib. RNA expression in Nalm6 and Sem cells treated with ASNase, ibrutinib, or a combination of both was determined by RNA sequencing. (B) Upstream regulators of gene products identified in panel (A) determined by Ingenuity software. (C) Protein expression in Nalm6 and Sem cells treated with ASNase, ibrutinib, or a combination of both as determined by RPPA. Quantified protein expression levels from treated samples were normalized relative to untreated samples and subjected to principal component analysis. The top 50 proteins that contributed most to the difference between the treatments (PC1) were selected, and unsupervised hierarchical clustering with Ward’s linkage was applied. (D) Immunoblot analysis of protein expression. Nalm6 and Sem cells were treated for 72 hours (Sem) or 96 hours (Nalm6) with indicated doses of ASNase and ibrutinib. Representative of 3 independent experiments is shown. (E) Cell death determined by quantification of cells positive for amine-reactive dyes using flow cytometry. Nalm6 BTK KO control cells or cells made to express an ASNS transgene were treated with indicated doses of ASNase. Each bar represents a mean of 3 independent experiments. ***P < .001; **P < .01; ***P < .05 (2-tailed, unpaired Student t test). (F) Apoptosis induction, measured by immunoblot analysis of PARP in Nalm6 BTK KO control cells or cells with ASNS overexpression. Cells were treated with indicated doses of ASNase. A representative of 3 independent experiments is shown.
Figure 6.
Figure 6.
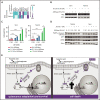
Loss of BTK potentiates ASNase-induced apoptosis by repression of GCN2 activity mediated by c-Myc. (A) Upstream regulators of genes differentially expressed in Nalm6 and Sem treated with ASNase alone vs treatment with ASNase and ibrutinib, determined by Ingenuity software. (B) Immunoblot analysis of c-Myc protein expression. Nalm6 and Sem cells were treated for 72 hours (Sem) or 96 hours (Nalm6) with indicated doses of ASNase and ibrutinib. (C) Cell death determined by quantification of cells positive for amine-reactive dyes using flow cytometry. Nalm6 and Sem cells were treated with indicated doses of JQ1 and/or ASNase for 3 days (Sem) or 6 days (Nalm6). Each bar represents a mean of 3 independent experiments. ***P < .001; **P < .01; ***P < .05 (2-tailed, unpaired Student t test). (D) Immunoblot analysis of PARP, ATF4, ASNS, and actin. Nalm6 and Sem cells were treated for 72 hours with indicated doses of ASNase and JQ1. (E) Working model explaining the synergistic interaction of BTK inhibition and ASNase treatment. In response to ASNase treatment, cells upregulate the AAR pathway via GCN2 to adapt to nutrient stress. BTK inhibition renders cells incapable of activating c-Myc, thus preventing activation of the GCN2-ATF4 axis. As a consequence, cells cannot mount an appropriate amino acid stress response and eventually die.

References

    1. Pieters R, Hunger SP, Boos J, et al. . L-asparaginase treatment in acute lymphoblastic leukemia: a focus on Erwinia asparaginase. Cancer. 2011;117(2):238-249. - PMC - PubMed
    1. Covini D, Tardito S, Bussolati O, et al. . Expanding targets for a metabolic therapy of cancer: L-asparaginase. Recent Patents Anticancer Drug Discov. 2012;7(1):4-13. - PubMed
    1. Fernandes HS, Silva Teixeira CS, Fernandes PA, Ramos MJ, Cerqueira NM. Amino acid deprivation using enzymes as a targeted therapy for cancer and viral infections. Expert Opin Ther Pat. 2017;27(3):283-297. - PubMed
    1. Tong WH, Pieters R, Kaspers GJ, et al. . A prospective study on drug monitoring of PEG-asparaginase and Erwinia asparaginase and asparaginase antibodies in pediatric acute lymphoblastic leukemia. Blood. 2014;123(13):2026-2033. - PMC - PubMed
    1. Henriksen LT, Nersting J, Raja RA, et al. ; Nordic Society of Paediatric Haematology and Oncology (NOPHO) group . Cerebrospinal fluid asparagine depletion during pegylated asparaginase therapy in children with acute lymphoblastic leukaemia. Br J Haematol. 2014;166(2):213-220. - PubMed

Publication types

MeSH terms

Associated data