. 2021 Aug;297(2):100971.
doi: 10.1016/j.jbc.2021.100971. Epub 2021 Jul 17.

Structural basis for template switching by a group II intron-encoded non-LTR-retroelement reverse transcriptase

Affiliations

Structural basis for template switching by a group II intron-encoded non-LTR-retroelement reverse transcriptase

Alfred M Lentzsch et al. J Biol Chem. 2021 Aug.

Abstract

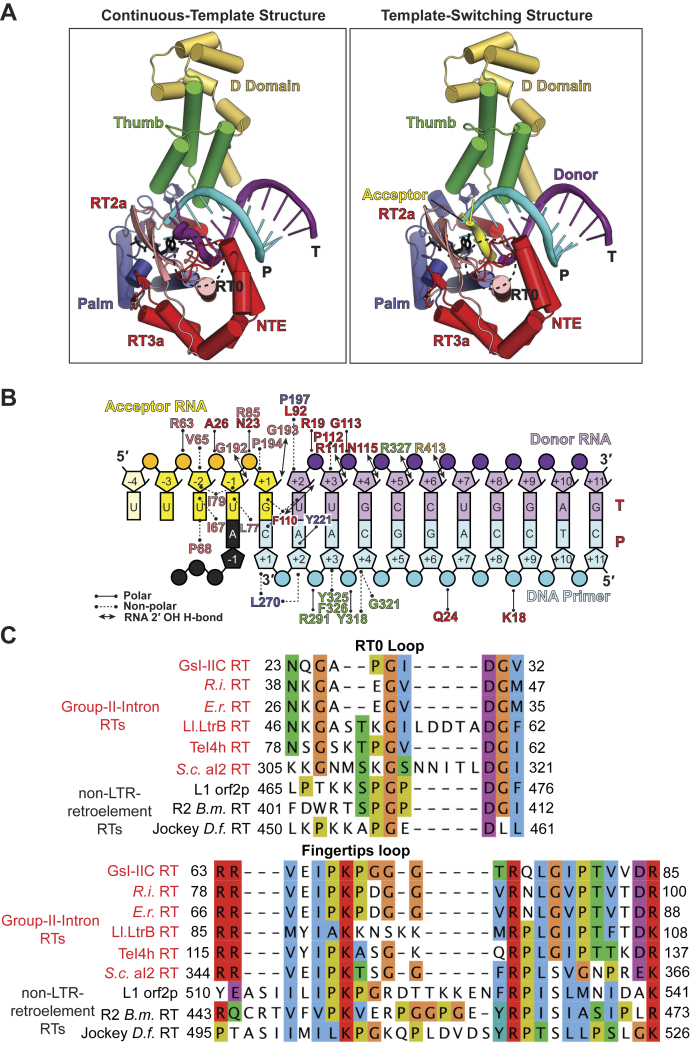
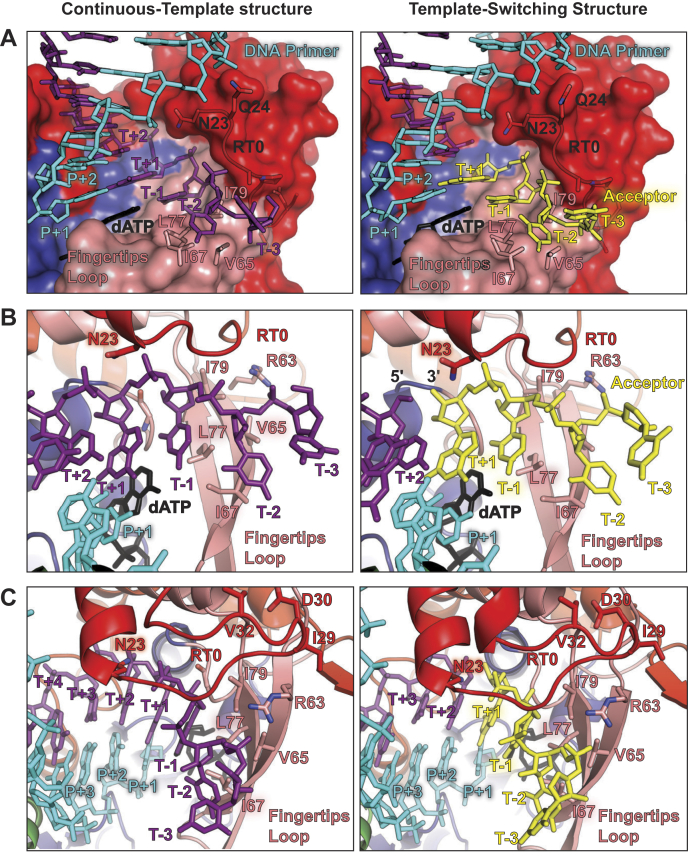
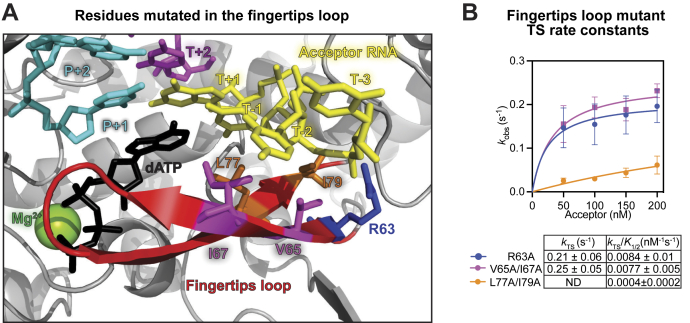
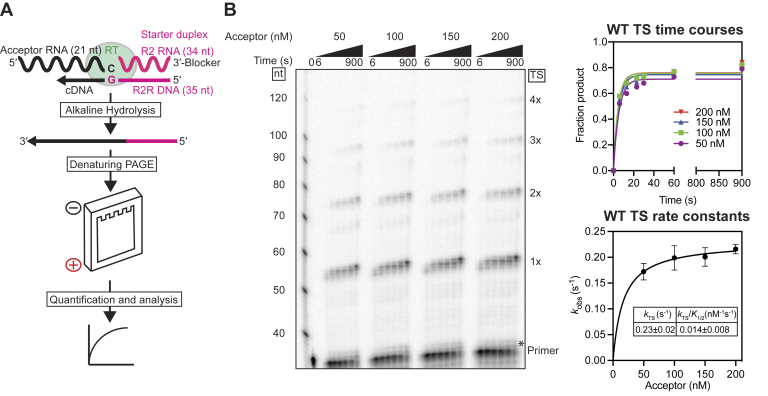
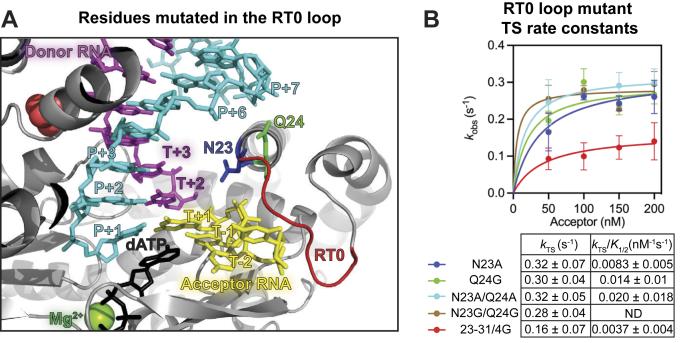
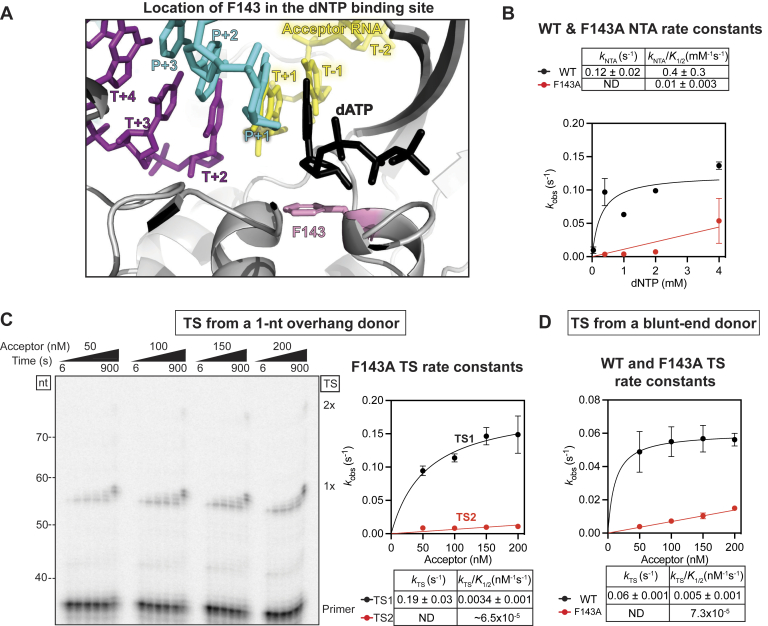
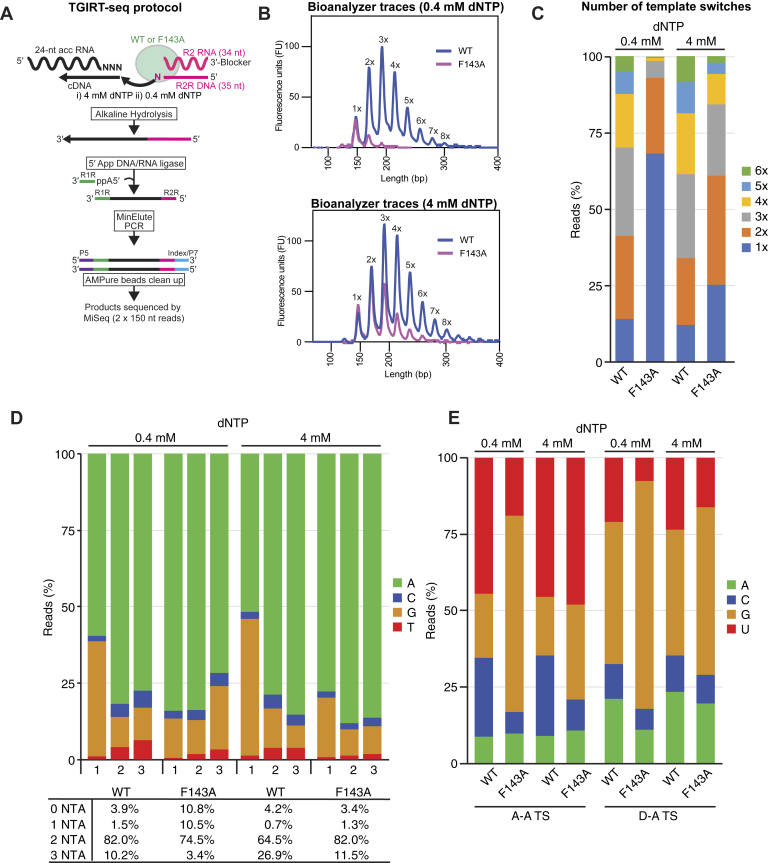
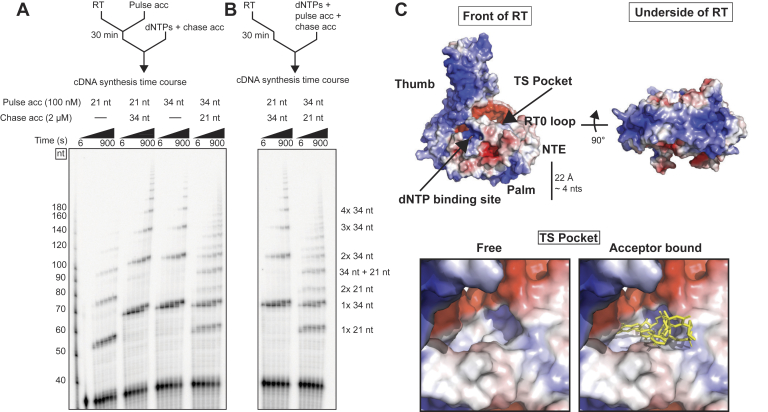
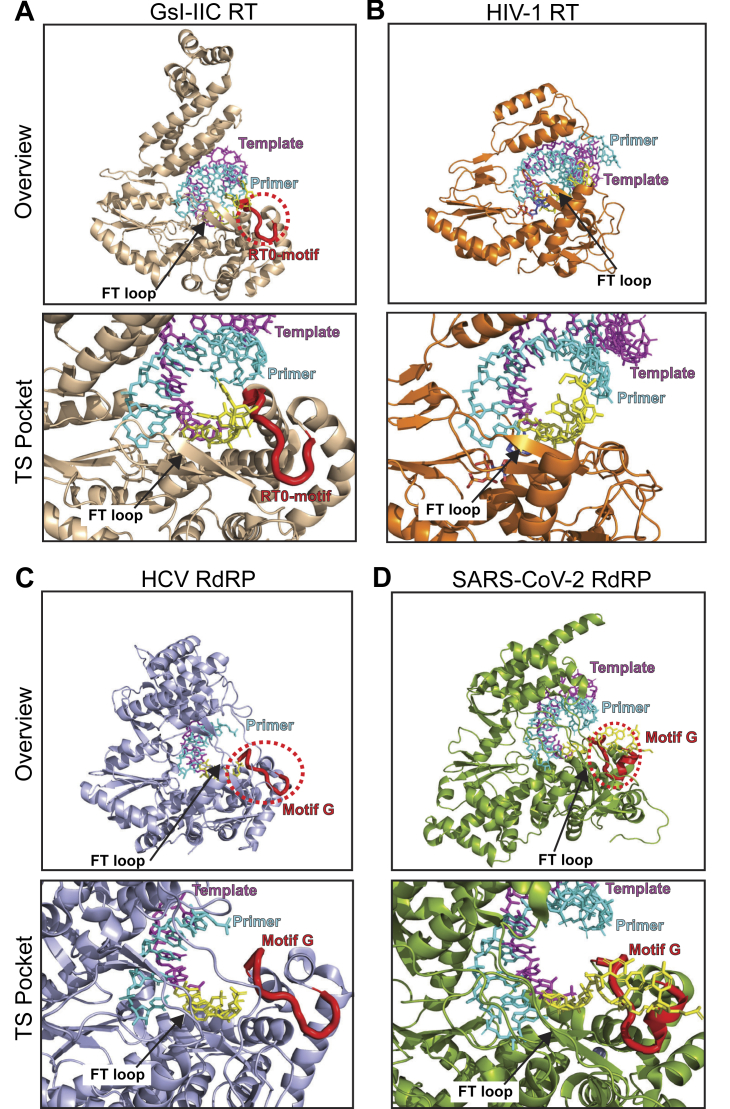
Reverse transcriptases (RTs) can switch template strands during complementary DNA synthesis, enabling them to join discontinuous nucleic acid sequences. Template switching (TS) plays crucial roles in retroviral replication and recombination, is used for adapter addition in RNA-Seq, and may contribute to retroelement fitness by increasing evolutionary diversity and enabling continuous complementary DNA synthesis on damaged templates. Here, we determined an X-ray crystal structure of a TS complex of a group II intron RT bound simultaneously to an acceptor RNA and donor RNA template-DNA primer heteroduplex with a 1-nt 3'-DNA overhang. The structure showed that the 3' end of the acceptor RNA binds in a pocket formed by an N-terminal extension present in non-long terminal repeat-retroelement RTs and the RT fingertips loop, with the 3' nucleotide of the acceptor base paired to the 1-nt 3'-DNA overhang and its penultimate nucleotide base paired to the incoming dNTP at the RT active site. Analysis of structure-guided mutations identified amino acids that contribute to acceptor RNA binding and a phenylalanine residue near the RT active site that mediates nontemplated nucleotide addition. Mutation of the latter residue decreased multiple sequential template switches in RNA-Seq. Our results provide new insights into the mechanisms of TS and nontemplated nucleotide addition by RTs, suggest how these reactions could be improved for RNA-Seq, and reveal common structural features for TS by non-long terminal repeat-retroelement RTs and viral RNA-dependent RNA polymerases.

Keywords: RNA virus; RNA-dependent RNA polymerase; X-ray crystallography; high-throughput RNA-Seq; retrovirus; thermostable group II intron reverse transcriptase; transcriptomics.


Conflict of interest statement

Conflict of interest Thermostable group II intron RT enzymes and methods for their use are the subject of patents and patent applications that have been licensed by the University of Texas and East Tennessee State University to InGex, LLC. A. M. Lambowitz, some former and present members of the Lambowitz laboratory, and the University of Texas are minority equity holders in InGex, LLC, and receive royalty payments from the sale of TGIRT enzymes and kits employing TGIRT TS activity and from the sublicensing of intellectual property to other companies. All other authors declare that they have no conflicts of interest with the contents of this article.

Figures

Figure 1
Figure 1
Structure of a group II intron RT template-switching (TS) complex.A, structure of GsI-IIC RT poised for TS from a donor RNA template–DNA primer heteroduplex to an acceptor RNA template (right) compared with that of GsI-IIC RT bound to a continuous RNA template–DNA primer heteroduplex (left; Protein Data Bank ID: 6AR1). Protein regions: fingers (salmon), insertions (red), palm (dark blue), thumb (green), D domain (gold), acceptor RNA template (yellow), donor RNA template (purple), DNA primer (cyan), and dATP (black). T and P denote the template and primer strands, respectively. The RT0 loop is highlighted in a dotted circle. B, schematic of protein–nucleic acid interactions in the TS structure. Nucleotide positions are denoted as template (T) or primer (P) strand numbered from the templating nucleotide at the RT active site (T-1). Interactions between nucleic acid and amino acid residues are indicated by a black line (polar interaction), dotted line (nonpolar interaction), or a double-headed arrow (RNA 2′ OH H-bond). Other color codes are as in panel A. The first nucleotide of the acceptor (the U at T-4) could not be modeled and is shown in a lighter shade of yellow. C, amino acid sequence alignments of the RT0 loop (top) and fingertips loop (bottom) regions of group II intron RTs (red; GsI-IIC RT [E2GM63], Roseburia intestinalis [D4L313], Eubacterium rectale [D4JMT6], Ll.LtrB [P0A3U0], TeI4h [Q8DMK2], Saccharomyces cerevisiae aI2 [P03876]) and non-LTR-retroelement RTs (black; human LINE-1 [Ll], orf2p [O00370], R2 Bombyx mori [V9H052], and Jockey Drosophila funebris RT [P21329]). Uniprot IDs are indicated in parentheses. Protein sequences were aligned using the MAFFT algorithm and colored using ClustalX settings. RT, reverse transcriptase.
Figure 2
Figure 2
Binding of the 3′ end of the acceptor RNA within the template-switching (TS) pocket.A, close-up views comparing the binding of the 3′ end of the acceptor within the TS pocket formed by the NTE and fingertips loop (right) with the binding of a continuous RNA template in the same region of the protein (left; Protein Data Bank ID: 6AR1). Protein regions: fingers (salmon), insertions (red), palm (dark blue); acceptor RNA template (yellow), donor RNA or continuous template (purple), DNA primer (cyan), and dATP (black). Nucleic acids are depicted as sticks, and the protein is depicted in surface-filling representation with some residues highlighted as sticks. B, comparison of the same structures with rotation to give a better view of the junction region between the donor and acceptor RNA templates. Nucleic acids and protein regions are colored as in panel A. Nucleic acids are in stick representation, and protein is in cartoon representation with some residues highlighted as sticks. C, comparisons of the same structures with rotation to show the binding of the 3′ end of the acceptor beneath the “lid” of the RT0 loop within the TS pocket. Nucleic acids and protein regions are colored and shown in the same representation as in panel B. NTE, N-terminal extension.
Figure 5
Figure 5
The effect of fingertips loop mutations on template switching by GsI-IIC RT.A, close-up view of the fingertips loop (red cartoon) highlighting the location of mutated amino acid residues R63 (blue stick), V65/I67 (magenta stick), and L77/I79 (orange stick). Nucleic acids are colored as in Figure 1, A and B. B, the plot shows kobs as a function of acceptor concentration fit by a hyperbolic equation to obtain the maximal rate constant kTS and the second-order rate constant kTS/K1/2. Template-switching reactions were done as described in Figure 3, with each rate constant measurement performed twice and representative time courses shown in Figure S5. The error bars in the plot show the standard error of the mean, and the uncertainties in the kTS and kTS/K1/2 values in the table below indicate the standard error of the fit. RT, reverse transcriptase.
Figure 3
Figure 3
Overview of template-switching (TS) assays and determination of saturating acceptor RNA concentrations.A, outline of TS assay. GsI-IIC RT (green oval) was preincubated with a starter duplex (magenta) consisting of a 34-nt RNA oligonucleotide containing an Illumina Read 2 (R2) sequence annealed to a complementary 5′-32P-labeled 35-nt DNA primer (R2R) leaving a 1-nt 3′-DNA overhang (nucleic acid sequences in Table S1). The 3′-DNA overhang nucleotide (G) base pairs with the 3′ nucleotide (C) of a 21-nt acceptor RNA (black) for TS, leading to the synthesis of a full-length complementary DNA of the acceptor RNA with the R2R oligonucleotide linked to its 5′ end. After incubation with NaOH to degrade RNA and neutralization with equimolar HCl, the complementary DNAs resulting from TS were analyzed by electrophoresis in a denaturing 6% polyacrylamide gel, which was dried and quantified with a phosphorimager. B, determination of saturating acceptor RNA concentrations. Time courses of TS reactions using 200 nM WT GsI-IIC RT and 20 nM donor RNA template–DNA primer duplex (5′-32P-labeled on DNA primer) indicated concentrations of a 21-nt acceptor RNA template, and 4 mM dNTPs (an equimolar mix of 1 mM dATP, dCTP, dGTP, and dTTP) in reaction medium containing 200 mM NaCl at 60 °C. Aliquots were quenched at times ranging from 6 to 900 s, and the products were analyzed by denaturing PAGE. The figure shows a representative gel from one of three repeats of the experiment. The numbers to the left of the gel indicate size markers (a 5′-32P-labeled single-stranded DNA ladder; ss20 DNA Ladder; Simplex Sciences) run in a parallel lane, and the labels to the right indicate products resulting from the initial template switch (1×) and subsequent end-to-end template switches from the 5′ end of one acceptor to the 3′ end of another (2×, 3×, etc.). The asterisk at the bottom right of the gel indicates the position of bands resulting from NTA to the 3′ end of the DNA primer. The plot at the upper right shows time courses of production of TS products (i.e., products >2 nt larger than the primer) at each RNA acceptor concentration. The plot at the bottom right shows kobs as a function of acceptor concentration fit by a hyperbolic equation to obtain the maximal rate constant kTS and the second-order rate constant kTS/K1/2, with the error bars in the plot showing the standard error of the mean for three repeats of each time course and the uncertainties in the inset table indicating the standard error of the fit. RT, reverse transcriptase.
Figure 4
Figure 4
The effect of RT0 loop mutations on template switching by GsI-IIC RT.A, close-up view of the RT0 loop highlighting the location of mutated amino acid residues N23 (blue stick) and Q24 (green stick) and the polypeptide backbone of residues 23 to 31 (red cartoon). Nucleic acids are colored as in Figure 1, A and B. B, the plot shows kobs as a function of acceptor concentration fit by a hyperbolic equation to obtain the maximal rate constant kTS and the second-order rate constant kTS/K1/2. Template-switching reactions were done as described in Figure 3. Each rate constant measurement was performed twice, and representative time courses are shown in Figure S3. The error bars in the plot show the standard error of the mean, and the uncertainties in the kTS and kTS/K1/2 values in the table below indicate the standard error of the fit. RT, reverse transcriptase
Figure 6
Figure 6
The effect of the F143A mutation on nontemplated nucleotide addition and template switching (TS) by GsI-IIC RT.A, close-up view of the dNTP-binding site showing F143 (pink stick) pi stacking with the ribose of the incoming dATP (black stick). Nucleic acids are colored as in Figure 1, A and B. B, NTA reactions for WT and F143A mutant GsI-IIC RT as a function of dNTP concentrations. The reactions were performed with blunt-end RNA template–DNA primer duplex of the same sequence as that used for TS but lacking the 1-nt 3′-DNA overhang and under the same reaction conditions as those used for TS in Figure 3. The plot shows kobs as a function of dNTP concentration fit by a hyperbolic equation to obtain the maximal rate constant kNTA and the second-order rate constant kNTA/K1/2 values. Each rate constant determination was performed at least twice, and a representative gel is shown in Figure S6A. The error bars in the plot show the standard error of the mean, and the uncertainties in the kNTA and kNTA/K1/2 values in the table above indicate the standard error of the fit. The 0.04 mM concentration for F143A was omitted because of poor fitting due to low amounts of product formation. C, TS reactions of the F143A mutant from a 1-nt 3′-DNA overhang RNA template–DNA primer duplex. Reactions were performed as described in Figure 3. The numbers to the left of the gel indicate the length and position of size markers (5′-32P-labeled single-stranded DNA ladder; ss20 DNA Ladder; Simplex Sciences) run in a parallel lane of the same gel. Each rate constant determination was performed at least twice. The plot to the right shows the observed rate constant kobs as a function of acceptor RNA concentration for the initial template switch from the donor duplex (TS1) and the second template switch from the 5′ end of first RNA template to the 3′ end of a second RNA template (TS2). The data points were fit by a hyperbolic function. D, TS of WT and F143A mutant GsI-IIC RT from a blunt-end duplex. TS reactions were done as described in Figure 3. Each rate constant determination was performed three times, and a representative gel is shown in Figure 5B. The plot shows kobs as a function of acceptor concentration fit by a hyperbolic equation to obtain the maximal rate constant kTS and the second-order rate constant kTS/K1/2, as indicated in the inset table. In panels C and D, the error bars in the plots show the standard error of the mean, and the uncertainties in the tables below each plot indicate the standard error of the fit. RT, reverse transcriptase.
Figure 7
Figure 7
The F134A mutation decreases secondary template switches in TGIRT-Seq.A, outline of the RNA-Seq workflow. Template-switching reactions using WT or F143A GsI-IIC RTs were performed with an unlabeled starter duplex with a 1-nt 3′-DNA primer overhang that was an equimolar mixture of A, C, G, and T residues (denoted N) and a 24-nt acceptor RNA of which each of the last three nucleotides was an equimolar mixture of A, C, G, and U residues (denoted N). After a 30-min preincubation, reactions were initiated by adding dNTPs, incubated at 60 °C for 15 min, and terminated by adding NaOH and heating to 95 °C for 3 min. Complementary DNA products were cleaned up by using a MinElute column (Qiagen) and then ligated to a 5′-adenylated R1R adapter using Thermostable 5′ App DNA/RNA Ligase (New England Biolabs). After another MinElute clean up, Illumina RNA-Seq capture sites (P5 and P7) and indices were added by PCR, and the resulting libraries were cleaned up by using AMPure XP beads (Beckman Coulter) prior to sequencing on an Illumina MiSeq version 2 to obtain 150-nt paired-end reads. B, bioanalyzer (Agilent; High Sensitivity DNA chip) traces of TGIRT-Seq libraries prepared via template switching at 0.4 and 4 mM dNTPs to the 24-nt acceptor RNA. The lengths indicated on the x-axis are those of internal DNA size markers, which were omitted from the trace for clarity. C, stacked bar graphs show the percentages of reads containing a single template switch from the starter duplex (1×) or multiple template switches from the 5′ end of one RNA template to the 3′ end of another (2× to 6×) in TGIRT-Seq datasets obtained with WT GsI-IIC RT and the F143A mutant at 0.4 or 4 mM dNTPs. D, stacked bar graphs showing the proportions of different nucleotides for the first, second, and third nontemplated-nucleotide additions at the 3′ end of the final complementary DNA synthesized after the last template switch in TGIRT-Seq datasets obtained with WT GsI-IIC RT and the F143A mutant at 0.4 and 4 mM dNTPs. The table below shows the percentages of 0, 1, 2, or 3 nt NTAs for each condition. Estacked bar graphs showing nucleotide frequencies of the 3′-terminal nucleotide of the acceptor RNA in TGIRT-Seq datasets obtained with WT GsI-IIC RT and the F143A mutant at 0.4 and 4 mM dNTPs for acceptor to acceptor (A–A) and starter duplex to acceptor (D–A) template switches. RT, reverse transcriptase; TGIRT, thermostable group II intron reverse transcriptase.
Figure 8
Figure 8
Template switching (TS) by GsI-IIC RT favors a longer acceptor RNA.A, schematic of the experiment. WT GsI-IIC RT (200 nM) in complex with a labeled 20 nM 1-nt 3′-DNA overhang starter duplex was incubated with 100 nM of a 21- or 34-nt acceptor RNA for 30 min, after which the reaction was started by adding 4 mM dNTPs and an excess (2 μM) of a reciprocal 34- or 21-nt acceptor RNA. B, WT GsI-IIC RT (200 nM) in complex with a labeled 20 nM 1-nt 3′-DNA overhang starter duplex was incubated for 30 min, after which the reaction was started by adding 4 mM total dNTPs, 100 nM of a 21- or 34-nt acceptor RNA, and 2 μM of a 34-nt or 21-nt acceptor RNA. Reaction time courses were analyzed by electrophoresis in a denaturing 6% polyacrylamide gel. The numbers to the left of the gel indicate the lengths of size markers (5′-32P-labeled single-stranded DNA ladder; ss20 DNA Ladder; Simplex Sciences) run in a parallel lane of the same gel. C, electrostatic potential surface representation of GsI-IIC RT created using the APBS Electrostatics plugin for Pymol. Electropositive regions are blue, and electronegative regions are red. In the front view (top left), the entrance of the TS pocket is indicated by an arrow, and a scale bar is included to give a sense of the distance that could be reached from the 5′ end of an acceptor RNA extending outside the TS pocket. Close-up views of the TS pocket without and with the bound 5-nt acceptor RNA in the crystal structure (yellow stick) are shown at the bottom. RT, reverse transcriptase.
Figure 9
Figure 9
Comparison of upstream template RNA-binding regions that comprise the template-switching pocket of GsI-IIC RT compared with the same regions of HIV-1 RT and viral RdRPs.A, GsI-IIC RT (PDB ID: 6AR1 (24), tan); B, HIV-1 RT (PDB ID: 4PQU (39), amino acids 1–312 showing the RT and thumb domains, orange); C, HCV RdRP (PDB ID: 4WTA (56), light blue); D, SARS-CoV-2 RdRP (PDB ID: 72CK (57) with the nonhomologous N-terminal amino acids 1–356 removed, light green). For each enzyme, cartoon representations are shown as overviews (top) or zoomed in on the putative template-switching pocket region (bottom). Primer strands are cyan (stick representation), and RNA strands are purple (stick representation) in all three proteins. The RT0 loop and the RT0 loop cognate “motif G” in RdRPs are highlighted and shown in red carton within a dotted red circle. The fingertips (FT) loop is indicated by an arrow. Structural alignments were done using Coot (67). HCV, hepatitis C virus; PDB, Protein Data Bank; RdRP, RNA-dependent RNA polymerase; RT, reverse transcriptase; SARS-CoV-2, severe acute respiratory syndrome coronavirus 2.

References

    1. Coffin J.M. Structure, replication, and recombination of retrovirus genomes: Some unifying hypotheses. J. Gen. Virol. 1979;42:1–26. - PubMed
    1. Lambowitz A.M., Belfort M. Mobile bacterial group II introns at the Crux of eukaryotic evolution. Microbiol. Spectr. 2015;3 MDNA3-0050-2014. - PMC - PubMed
    1. Shih C., Yang C.C., Choijilsuren G., Chang C.H., Liou A.T. Hepatitis B virus. Trends Microbiol. 2018;26:386–387. - PubMed
    1. Martin-Alonso S., Frutos-Beltran E., Menendez-Arias L. Reverse transcriptase: From transcriptomics to genome editing. Trends Biotechnol. 2021;39:194–210. - PubMed
    1. Inouye S., Hsu M.Y., Eagle S., Inouye M. Reverse transcriptase associated with the biosynthesis of the branched RNA-linked msDNA in Myxococcus xanthus. Cell. 1989;56:709–717. - PubMed

Publication types

MeSH terms