

Effects of Mobile Phone Use on Driving Performance: An Experimental Study of Workload and Traffic Violations
- PMID: 34281034
- PMCID: PMC8297239
- DOI: 10.3390/ijerph18137101
Effects of Mobile Phone Use on Driving Performance: An Experimental Study of Workload and Traffic Violations
Abstract
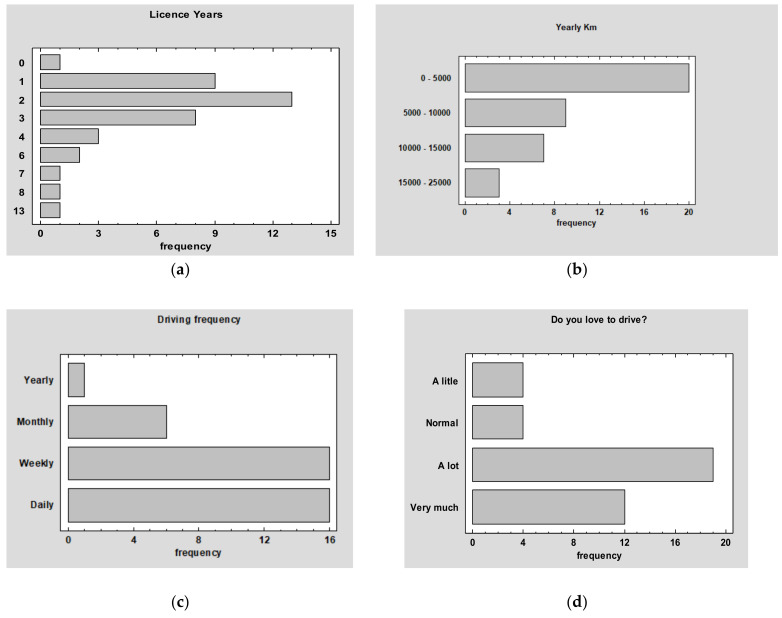
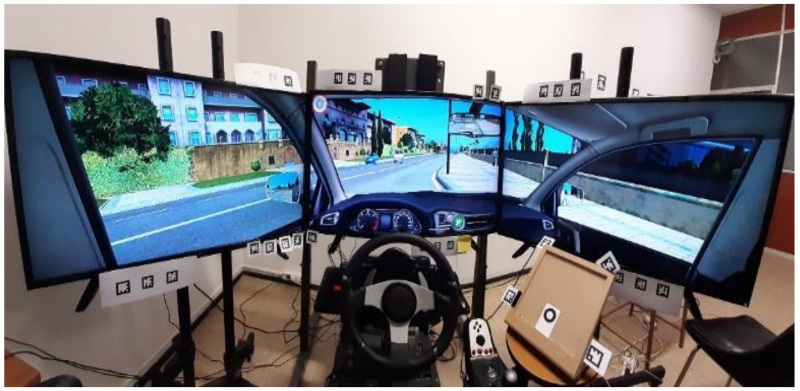
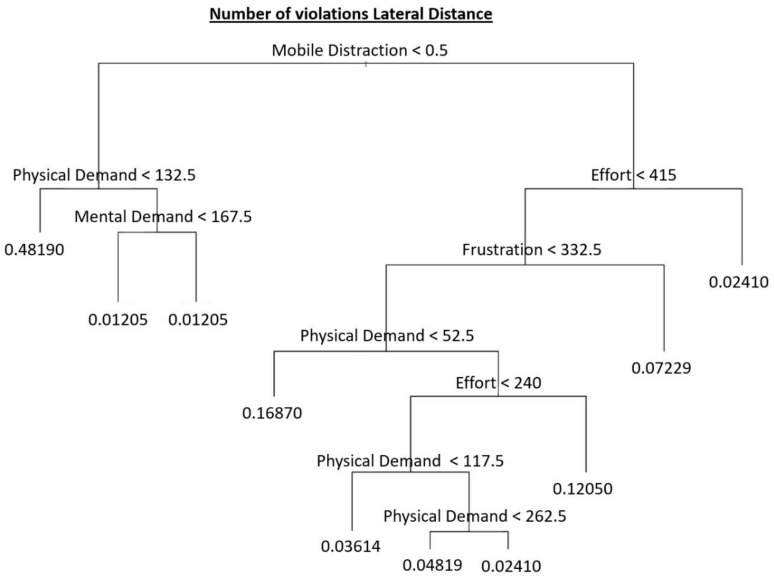
The use of communication technologies, e.g., mobile phones, has increased dramatically in recent years, and their use among drivers has become a great risk to traffic safety. The present study assessed the workload and road ordinary violations, utilizing driving data collected from 39 young participants who underwent a dual-task while driving a simulator, i.e., respond to a call, text on WhatsApp, and check Instagram. Findings confirmed that there are significant differences in the driving performance of young drivers in terms of vehicle control (i.e., lateral distance and hard shoulder line violations) between distracted and non-distracted drivers. Furthermore, the overall workload score of young drivers increases with the use of their mobile phones while driving. The obtained results contribute to a better understanding of the driving performance of distracted young drivers and thus they could be useful for further improvements to traffic safety strategies.
Keywords: distractions; drivers; mobile; phone; traffic; violations; workload; young.
Conflict of interest statement
The authors declare no conflict of interest. The funders had no role in the design of the study; in the collection, analyses, or interpretation of data; in the writing of the manuscript; or in the decision to publish the results.
Figures
Similar articles
-
Texting While Driving: A Literature Review on Driving Simulator Studies.Int J Environ Res Public Health. 2023 Feb 28;20(5):4354. doi: 10.3390/ijerph20054354. Int J Environ Res Public Health. 2023. PMID: 36901364 Free PMC article. Review.
-
Smartwatches are more distracting than mobile phones while driving: Results from an experimental study.Accid Anal Prev. 2021 Jan;149:105846. doi: 10.1016/j.aap.2020.105846. Epub 2020 Nov 9. Accid Anal Prev. 2021. PMID: 33181456
-
Is it all about mobile phones? Exploring drivers' perceptions of government information and road rules on distracted driving.Accid Anal Prev. 2024 Dec;208:107770. doi: 10.1016/j.aap.2024.107770. Epub 2024 Sep 12. Accid Anal Prev. 2024. PMID: 39270506
-
Effects of road infrastructure and traffic complexity in speed adaptation behaviour of distracted drivers.Accid Anal Prev. 2017 Apr;101:67-77. doi: 10.1016/j.aap.2017.01.018. Epub 2017 Feb 10. Accid Anal Prev. 2017. PMID: 28189943
-
Is distraction on the road associated with maladaptive mobile phone use? A systematic review.Accid Anal Prev. 2023 Mar;181:106900. doi: 10.1016/j.aap.2022.106900. Epub 2022 Dec 27. Accid Anal Prev. 2023. PMID: 36580764
Cited by
-
Major injuries and associated factors in traffic accidents among motorcycle food delivery riders during the COVID-19 pandemic in Thailand.Heliyon. 2024 Oct 10;10(20):e39032. doi: 10.1016/j.heliyon.2024.e39032. eCollection 2024 Oct 30. Heliyon. 2024. PMID: 39640680 Free PMC article.
-
"It's okay because I'm just driving": an exploration of self-reported mobile phone use among Mexican drivers.PeerJ. 2024 Feb 23;12:e16899. doi: 10.7717/peerj.16899. eCollection 2024. PeerJ. 2024. PMID: 38410804 Free PMC article.
-
Texting While Driving: A Literature Review on Driving Simulator Studies.Int J Environ Res Public Health. 2023 Feb 28;20(5):4354. doi: 10.3390/ijerph20054354. Int J Environ Res Public Health. 2023. PMID: 36901364 Free PMC article. Review.
-
Talking on the Phone While Driving: A Literature Review on Driving Simulator Studies.Int J Environ Res Public Health. 2022 Aug 24;19(17):10554. doi: 10.3390/ijerph191710554. Int J Environ Res Public Health. 2022. PMID: 36078267 Free PMC article. Review.
-
Musculoskeletal Health Risks Associated With Smartphone Use: A Retrospective Study from Riyadh, Saudi Arabia.Cureus. 2024 Jun 29;16(6):e63446. doi: 10.7759/cureus.63446. eCollection 2024 Jun. Cureus. 2024. PMID: 39077297 Free PMC article.
References
-
- World Health Organization (WHO) Global Status Report on Road Safety. WHO Press; Geneva, Switzerland: 2018.
-
- Wang J., Li K., Lu X.-Y. Advances in Intelligent Vehicles. Elsevier; Amsterdam, The Netherlands: 2014. Effect of human factors on driver behavior; pp. 111–157.
-
- Koesdwiady A., Soua R., Karray F., Kamel M.S. Recent trends in driver safety monitoring systems: State of the art and challenges. IEEE Trans. Veh. Technol. 2017;66:4550–4563. doi: 10.1109/TVT.2016.2631604. - DOI
-
- Jørgensen F., Hanssen T.-E.S. Implications for traffic safety from car drivers’ secondary task engagement—An economist’s view. Econ. Transp. 2019;20:100136. doi: 10.1016/j.ecotra.2019.100136. - DOI
-
- Xing Y., Lv C., Cao D. Advanced Driver Intention Inference. Elsevier; Amsterdam, The Netherlands: 2020. State of the art of driver lane change intention inference; pp. 21–51.
Publication types
MeSH terms
LinkOut - more resources
Full Text Sources
Miscellaneous
