. 2021 Jul 19;21(1):342.
doi: 10.1186/s12870-021-03119-x.

The core autophagy machinery is not required for chloroplast singlet oxygen-mediated cell death in the Arabidopsis thaliana plastid ferrochelatase two mutant

Affiliations

The core autophagy machinery is not required for chloroplast singlet oxygen-mediated cell death in the Arabidopsis thaliana plastid ferrochelatase two mutant

Matthew D Lemke et al. BMC Plant Biol. .

Abstract

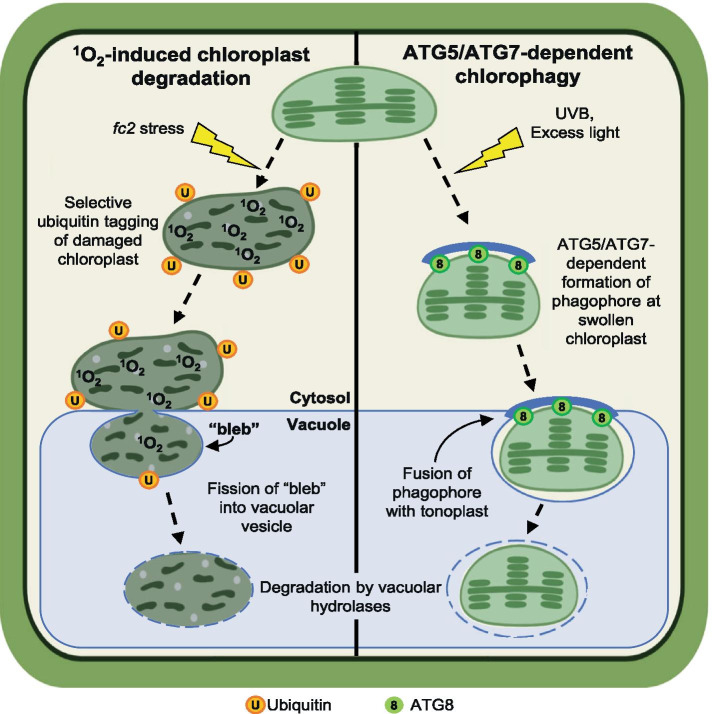
Background: Chloroplasts respond to stress and changes in the environment by producing reactive oxygen species (ROS) that have specific signaling abilities. The ROS singlet oxygen (1O2) is unique in that it can signal to initiate cellular degradation including the selective degradation of damaged chloroplasts. This chloroplast quality control pathway can be monitored in the Arabidopsis thaliana mutant plastid ferrochelatase two (fc2) that conditionally accumulates chloroplast 1O2 under diurnal light cycling conditions leading to rapid chloroplast degradation and eventual cell death. The cellular machinery involved in such degradation, however, remains unknown. Recently, it was demonstrated that whole damaged chloroplasts can be transported to the central vacuole via a process requiring autophagosomes and core components of the autophagy machinery. The relationship between this process, referred to as chlorophagy, and the degradation of 1O2-stressed chloroplasts and cells has remained unexplored.

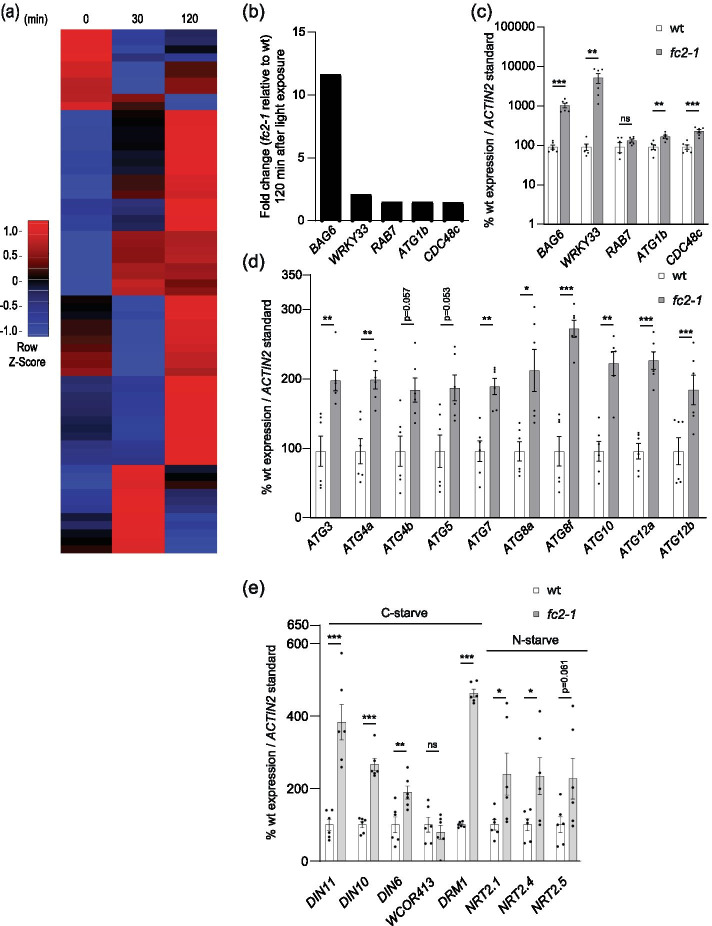
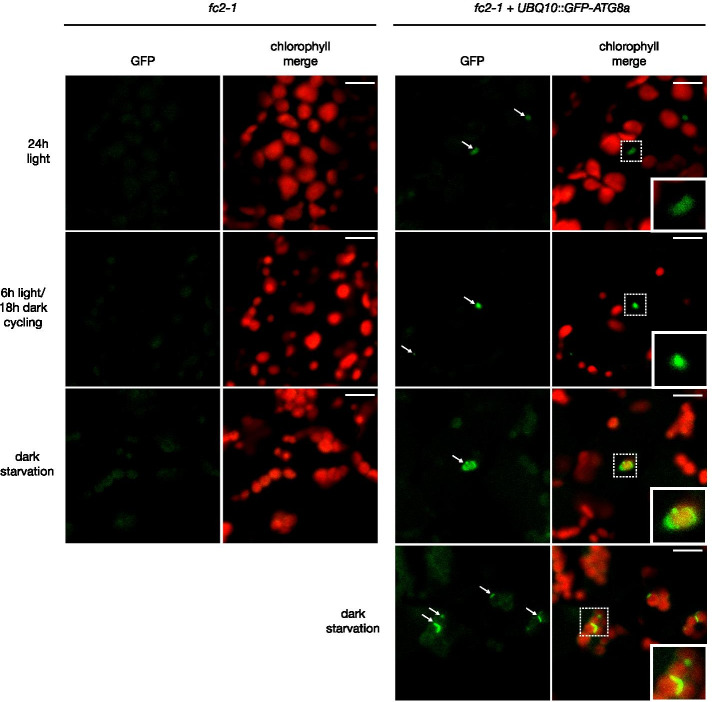
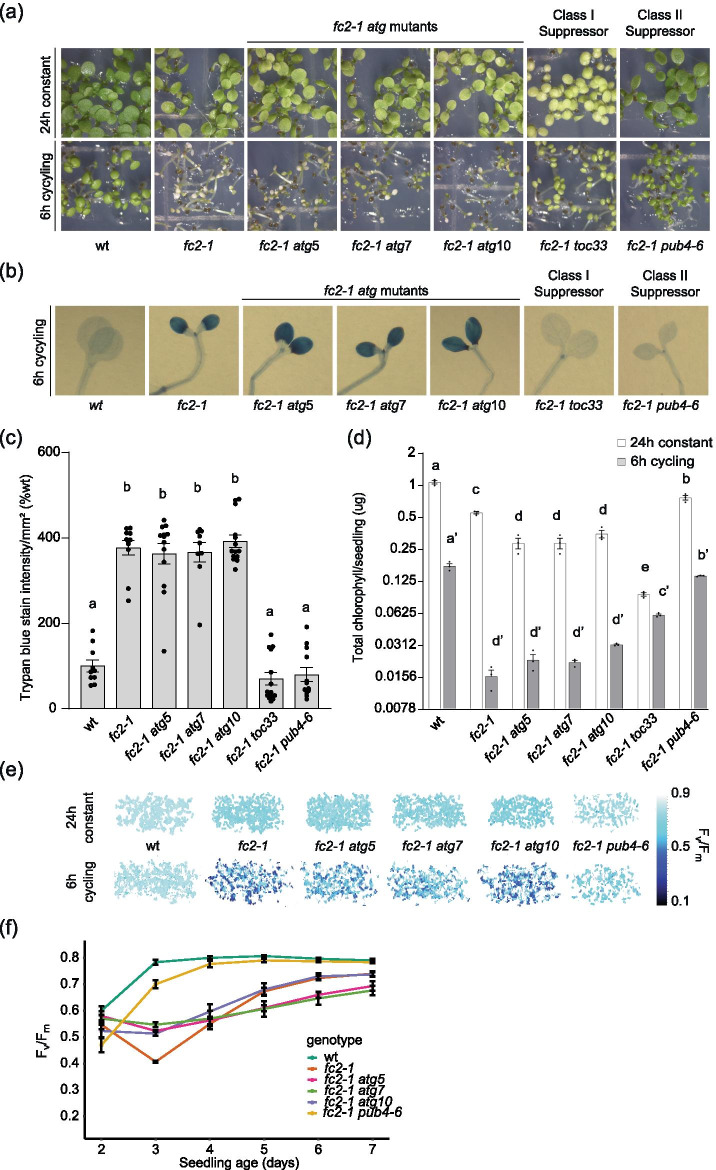
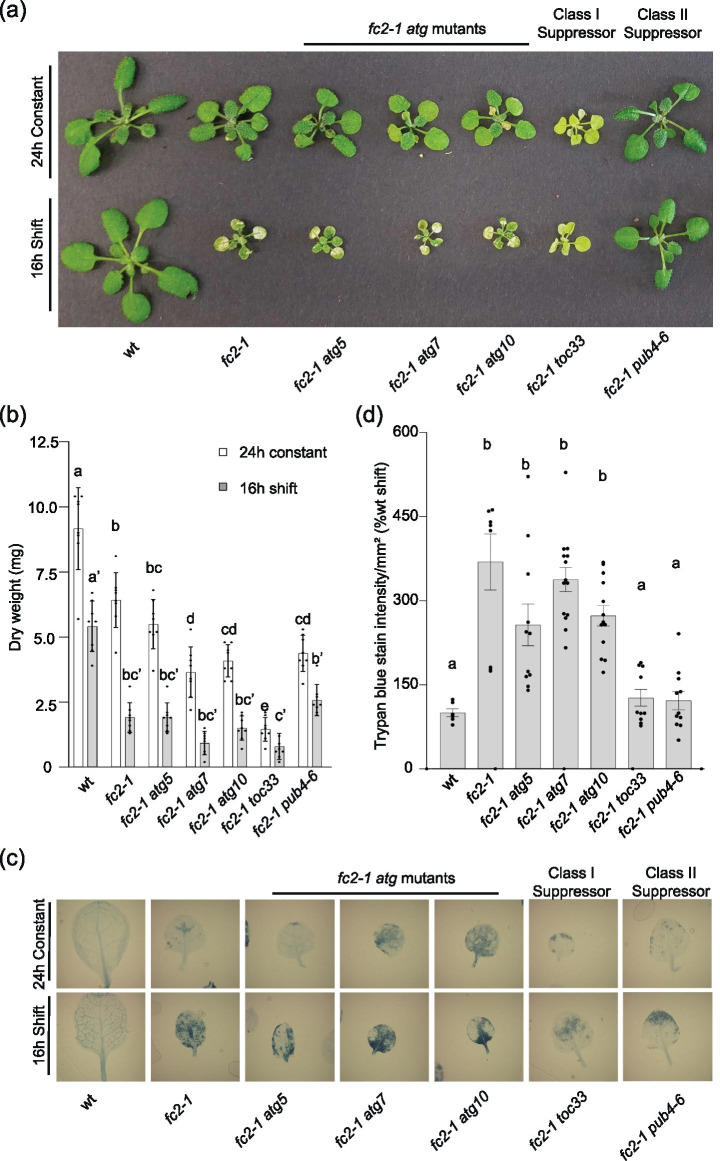
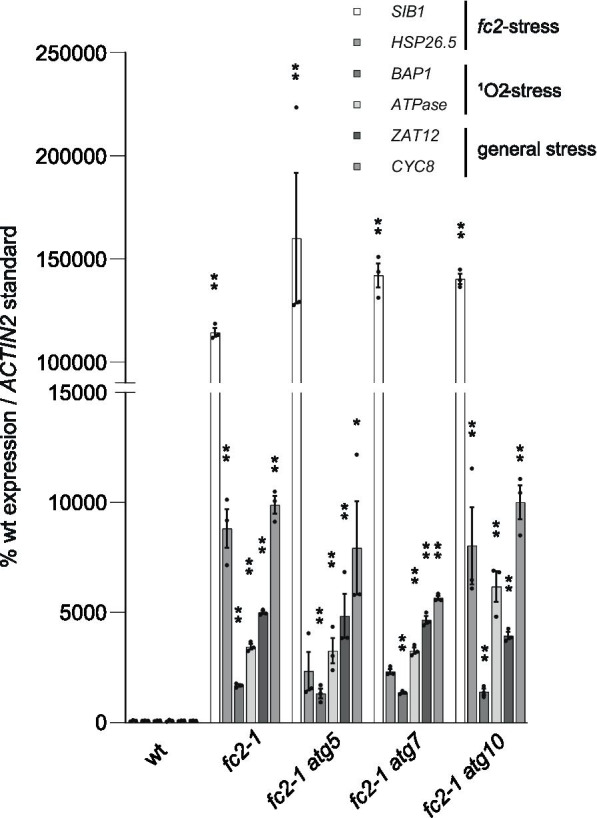
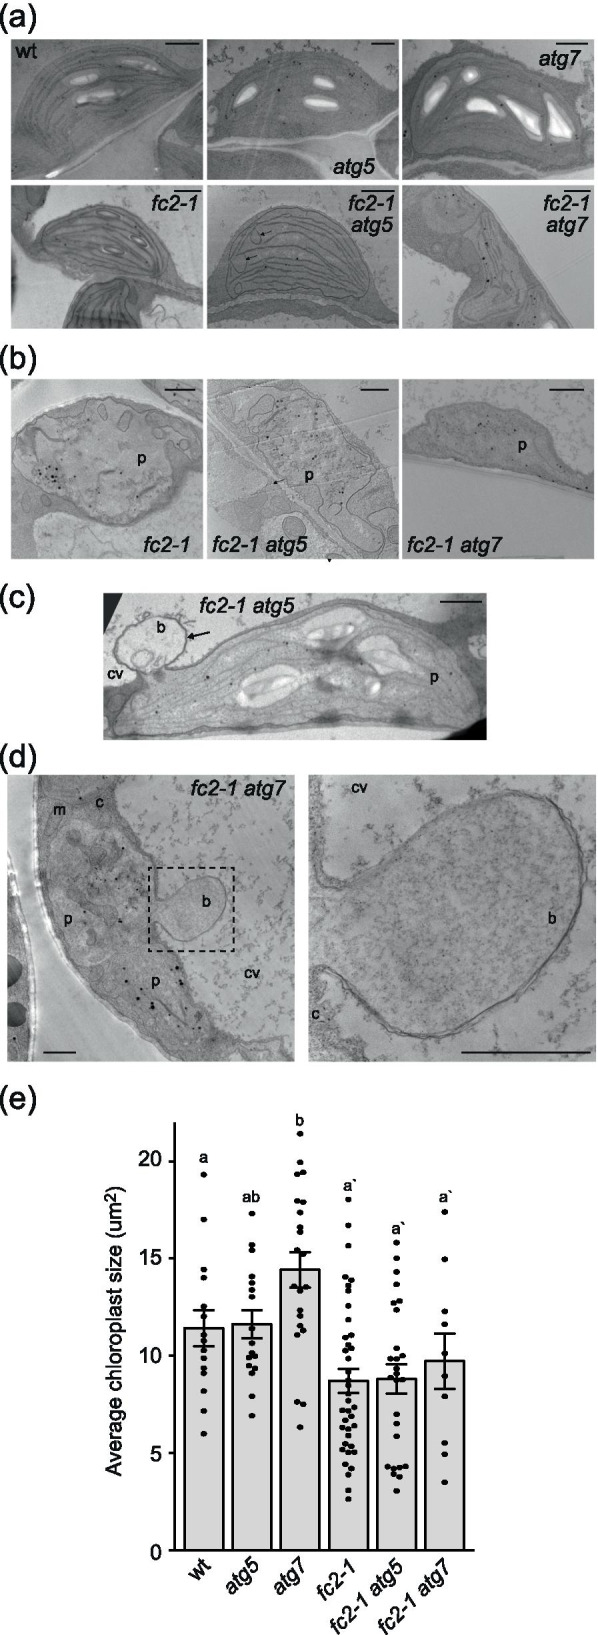
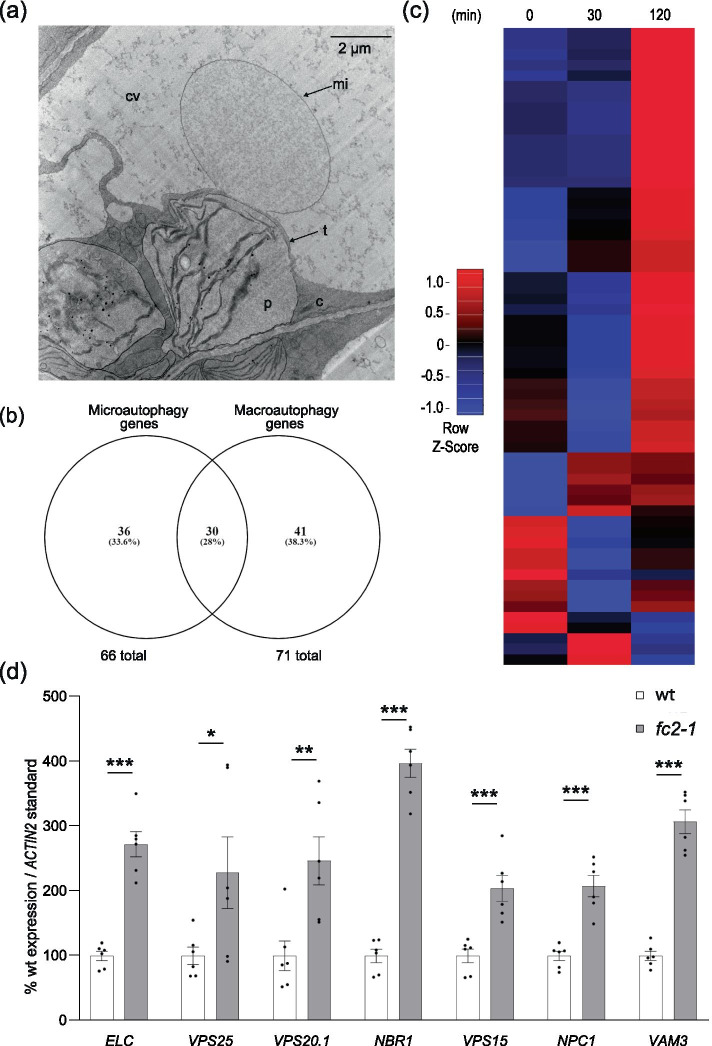
Results: To further understand 1O2-induced cellular degradation and determine what role autophagy may play, the expression of autophagy-related genes was monitored in 1O2-stressed fc2 seedlings and found to be induced. Although autophagosomes were present in fc2 cells, they did not associate with chloroplasts during 1O2 stress. Mutations affecting the core autophagy machinery (atg5, atg7, and atg10) were unable to suppress 1O2-induced cell death or chloroplast protrusion into the central vacuole, suggesting autophagosome formation is dispensable for such 1O2-mediated cellular degradation. However, both atg5 and atg7 led to specific defects in chloroplast ultrastructure and photosynthetic efficiencies, suggesting core autophagy machinery is involved in protecting chloroplasts from photo-oxidative damage. Finally, genes predicted to be involved in microautophagy were shown to be induced in stressed fc2 seedlings, indicating a possible role for an alternate form of autophagy in the dismantling of 1O2-damaged chloroplasts.

Conclusions: Our results support the hypothesis that 1O2-dependent cell death is independent from autophagosome formation, canonical autophagy, and chlorophagy. Furthermore, autophagosome-independent microautophagy may be involved in degrading 1O2-damaged chloroplasts. At the same time, canonical autophagy may still play a role in protecting chloroplasts from 1O2-induced photo-oxidative stress. Together, this suggests chloroplast function and degradation is a complex process utilizing multiple autophagy and degradation machineries, possibly depending on the type of stress or damage incurred.

Keywords: Abiotic stress; Autophagy; Cellular degradation; Chloroplast; Microautophagy; Oxidative stress; Photosynthesis; Reactive oxygen species; Signaling; Singlet oxygen.


Conflict of interest statement

The authors declare that they have no competing interests.

Figures

Fig. 1
Fig. 1
Autophagy-related genes are transcriptionally induced in stressed fc2-1 seedlings. The expression of autophagy-related genes was monitored in fc2-1 mutants. A A heatmap of autophagy-related gene expression (relative to wt) in etiolated seedlings at time points prior to (0 min) and during de-etiolation (30 min and 120 min). Microarray data was previously generated from etiolated seedlings grown in the dark for four days and exposed to light for the indicated amount of time [15]. The list of genes considered is presented in Table S1. B Expression fold change (relative to wt) of the top five most up-regulated core autophagy and autophagy genes at 120 min from panel A. C, D, and E RT-qPCR analysis of autophagy-related, core autophagy, and starvation (carbon and nitrogen) marker transcripts, respectively, from four-day-old seedlings grown under 6 h light/18 h dark light cycling conditions. Shown are mean values ± SEM (n = 6 biological replicates). Statistical analyses were performed by student’s t-tests. *, **, *** indicate a p-value of ≤ 0.05, ≤ 0.01, and ≤ 0.001, respectively. In all bar graphs, closed circles represent individual data points
Fig. 2
Fig. 2
ATG8a does not associate with 1O2-stressed chloroplasts in fc2 seedlings. The localization of GFP-ATG8a was assessed in stressed fc2-1 seedlings. Shown are representative images of GFP-ATG8a in four day-old fc2-1 seedlings grown in 24 h constant light or 6 h light/18 h dark cycling light. The same line was also subjected to dark-induced carbon starvation for six additional days. Also shown are representative images of untransformed fc2-1 plants from each condition. Shown are the GFP signal (green) and merged overlays with chlorophyll autofluorescence (red). White arrows indicate GFP-ATG8a punctae in cells. Boxes with dashed lines mark magnified sections included on bottom right of select panels. Scale bars = 10 µm
Fig. 3
Fig. 3
Blocking ATG-dependent autophagy does not suppress 1O2-induced cell death in fc2 seedlings. atg mutations were tested for their ability to suppress cell death in the fc2-1 mutant. A Seven-day old seedlings grown in constant light (24 h) or 6 h light/18 h dark (6 h) cycling light conditions. B Trypan blue stains of seedlings from panel A. The dark blue color is indicative of cell death. C Mean values (± SEM) of the trypan blue signal in panel B (n ≥ 10 seedlings). D Mean chlorophyll content (µg/seedling) (± SEM) of groups of six-day old seedlings grown in 24 h light or 6 h cycling light conditions (n = 3 biological replicates)(y-axis in log2 scale). E Representative images of maximum quantum yield of PSII (Fv/Fm) measured from three-day-old seedlings grown in the indicated light regiment. F Changes in Fv/Fm of seedlings grown over seven days in 6 h cycling light conditions. Mean values are shown ± SEM (n = 3 biological replicates). Statistical analyses were performed by one-way ANOVA tests followed by Tukey's HSD. Different letters above bars indicate significant differences (p value ≤ 0.05). For panel D, separate statistical analyses were performed for the different light treatments and the significance for the 6 h cycling values is denoted by letters with a ʹ. In all bar graphs, closed circles represent individual data points
Fig. 4
Fig. 4
Blocking ATG-dependent autophagy does not suppress 1O2-induced cell death in fc2 adult plants. The phenotypes of fc2-1 atg double mutant plants were assessed in the adult stage. A Three-week old plants grown in 24 h constant light or under stressed conditions (two weeks in 24 h constant light and one week in 16 h light/8 h dark cycling light conditions). B Mean biomass (± SD) of same plants (n = 8 plants). C Representative trypan blue stains of single leaves from same plants. Dark blue color is indicative of cell death. D Quantification of mean trypan blue signal (± SEM) from plants in 16 h light/8 h dark cycling light conditions (n ≥ 6 leaves from individual plants). Statistical analyses were performed by one-way ANOVA tests followed by Tukey's HSD. Different letters above bars indicate significant differences (p value ≤ 0.05). For panel B, separate statistical analyses were performed for the different light treatments and the significance for the light stressed group is denoted by letters with a ʹ. In all bar graphs, closed circles represent individual data points
Fig. 5
Fig. 5
ATG-dependent autophagy is not required for 1O2 retrograde signaling in fc2 mutants. The expression of nuclear genes controlled by chloroplast 1O2 stress signaling were monitored in the fc2-1 atg double mutants. RT-qPCR analyses of stress gene transcript abundance in four-day old fc2-1 and fc2-1 atg double mutants grown under 6 h light/18 h dark cycling light conditions collected one hour after subjective dawn. Shown are means of biological replicates (n = 3) ± SEM. Statistical analyses were performed by a one-way ANOVA followed by Dunnett’s multiple comparisons test with the wt. * and ** indicates an adjusted p value of ≤ 0.05 and ≤ 0.01, respectively. Closed circles represent individual data points
Fig. 6
Fig. 6
ATG-dependent autophagy is not required for selective chloroplast degradation in fc2 mutants. Chloroplast ultrastructure was assessed by transmission electron microscopy (TEM) in the atg mutants. Shown are representative A intact and B degrading chloroplasts in four day old seedlings grown under 24 h constant light conditions. Arrows indicate unusual horseshoe membrane structures. Shown is a blebbing chloroplast interacting with the central vacuole in the C fc2-1 atg5 and D fc2-1 atg7 mutants. Arrows indicate the bleb-like structure protruding into the central vacuole. The right panel is a zoomed-in image of the boxed region. b; bleb, c; cytoplasm, cv; central vacuole, m; mitochondria, p; plastid. Bars = 1 µm. E Mean chloroplast area (± SEM) from the same seedlings (n ≥ 10). Statistical analyses were performed using one-way ANOVA tests followed by Tukey's HSD. Different letters above bars indicate significant differences (p value ≤ 0.05). Separate statistical analyses were performed for seedlings in the wt and fc2-1 backgrounds and the significance for the fc2-1 background group is denoted by letters with a ʹ. Closed circles represent individual data points
Fig. 7
Fig. 7
Microautophagy-related genes are transcriptionally induced in stressed fc2 seedlings The induction of microautophagy was assessed in fc2-1 seedlings. A Shown is a representative TEM image of the invagination of the vacuolar membrane associated next to a degrading chloroplast in the fc2-1 atg5 mutant. c; cytoplasm, cv; central vacuole, mi; microautophagy structure, p; plastid, t; tonoplast. B A Venn diagram showing overlap of putative microautophagy-related genes and autophagy-related genes used in this study (Tables S1 and S2). C A heatmap of microautophagy-related gene expression (relative to wt) in etiolated seedlings at time points prior to (0 min) and during de-etiolation (30 min and 120 min). Microarray data was previously generated from etiolated seedlings grown in the dark for four days at time points before and after light exposure [15]. The list of genes considered is presented in Table S2. D RT-qPCR analysis of select microautophagy-related transcripts from four-day-old seedlings grown under 6 h light/18 h dark light cycling conditions. Shown are mean values ± SEM (n = 6 biological replicates). Statistical analyses were performed by student’s t-tests. *, **, *** indicate a p-value of ≤ 0.05, ≤ 0.01, and ≤ 0.001, respectively. In all bar graphs, closed circles represent individual data points
Fig. 8
Fig. 8
Model for two microautophagy-like processes for selective chloroplast turnover in plants. A hypothetical model depicting the proposed 1O2-induced chloroplast quality control [15] (left side) and ATG5/ATG7-dependent chlorophagy [–40] (right side). In 1O2-induced chloroplast degradation, damaged chloroplasts are ubiquitin-tagged and begin degrading in the cytosol before being “blebbed” into the central vacuole for final turnover of chloroplast components. Vacuolar vesiculation of this bleb may proceed by “pinching off” via an autophagosome-independent fission-like mechanism [36]. Conversely, ATG5/ATG7-dependent chlorophagy, proceeds by a mechanism that requires phagophore formation and association with swollen, membrane damaged chloroplasts. Final vacuolar vesiculation in this process is likely achieved by a fusion of the chloroplast associated phagophore with the tonoplast membrane . In both processes, final degradation of chloroplast components are then degraded by vacuolar hydrolases

Similar articles

Cited by

References

    1. Asada K. Production and scavenging of reactive oxygen species in chloroplasts and their functions. Plant Physiol. 2006;141(2):391–396. doi: 10.1104/pp.106.082040. - DOI - PMC - PubMed
    1. Poljsak B, Šuput D, Milisav I. Achieving the balance between ROS and antioxidants: When to use the synthetic antioxidants. Oxid Med Cell Longev. 2013;2013:956792. - PMC - PubMed
    1. Müller P, Li XP, Niyogi KK. Non-photochemical quenching. A response to excess light energy. Plant Physiol. 2001;125(4):1558–66. - PMC - PubMed
    1. Horton P, Ruban A. Molecular design of the photosystem II light-harvesting antenna: Photosynthesis and photoprotection. J Exp Botany. 2005;56(411):365–373. doi: 10.1093/jxb/eri023. - DOI - PubMed
    1. Triantaphylidès C, Krischke M, Hoeberichts FA, Ksas B, Gresser G, Havaux M, et al. Singlet oxygen is the major reactive oxygen species involved in photooxidative damage to plants. Plant Physiol. 2008;148(2):960–968. doi: 10.1104/pp.108.125690. - DOI - PMC - PubMed