

Chronic complement dysregulation drives neuroinflammation after traumatic brain injury: a transcriptomic study
- PMID: 34281628
- PMCID: PMC8287781
- DOI: 10.1186/s40478-021-01226-2
Chronic complement dysregulation drives neuroinflammation after traumatic brain injury: a transcriptomic study
Abstract
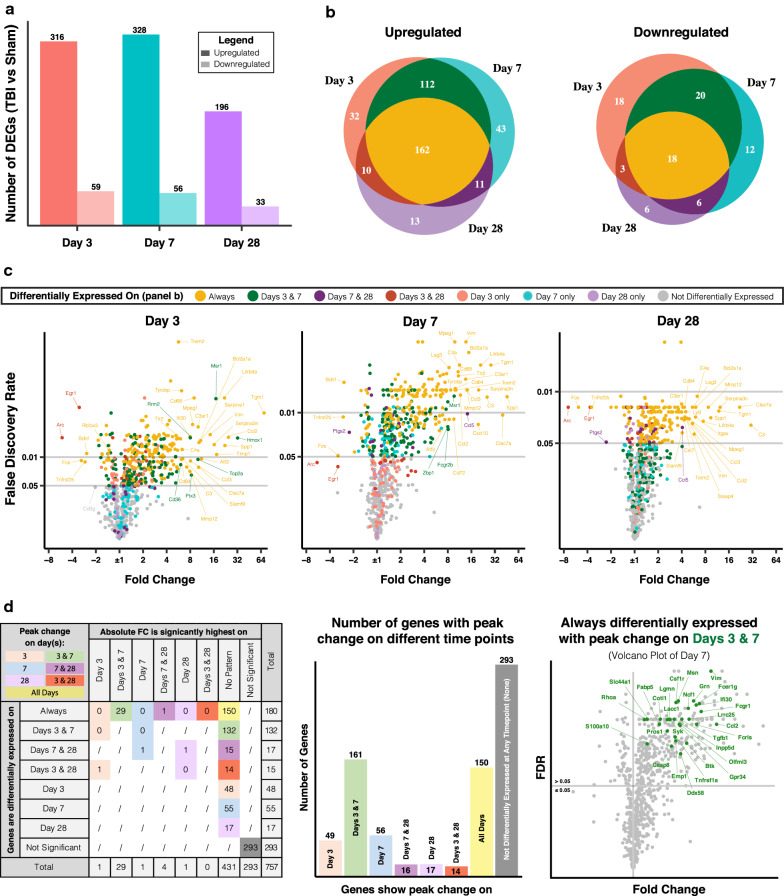
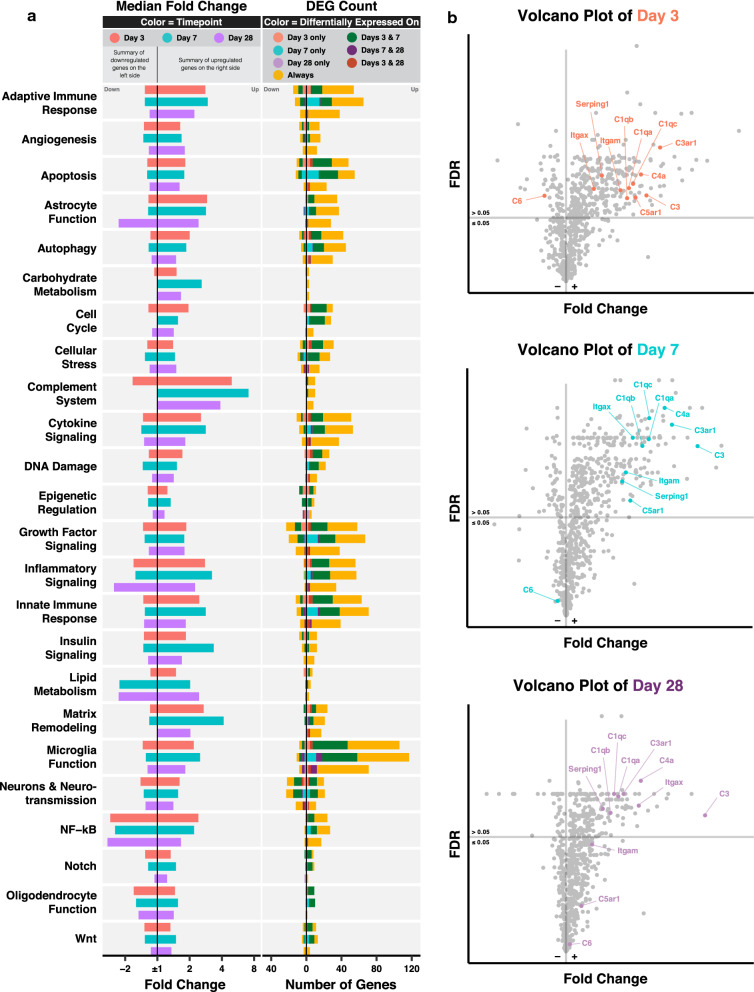
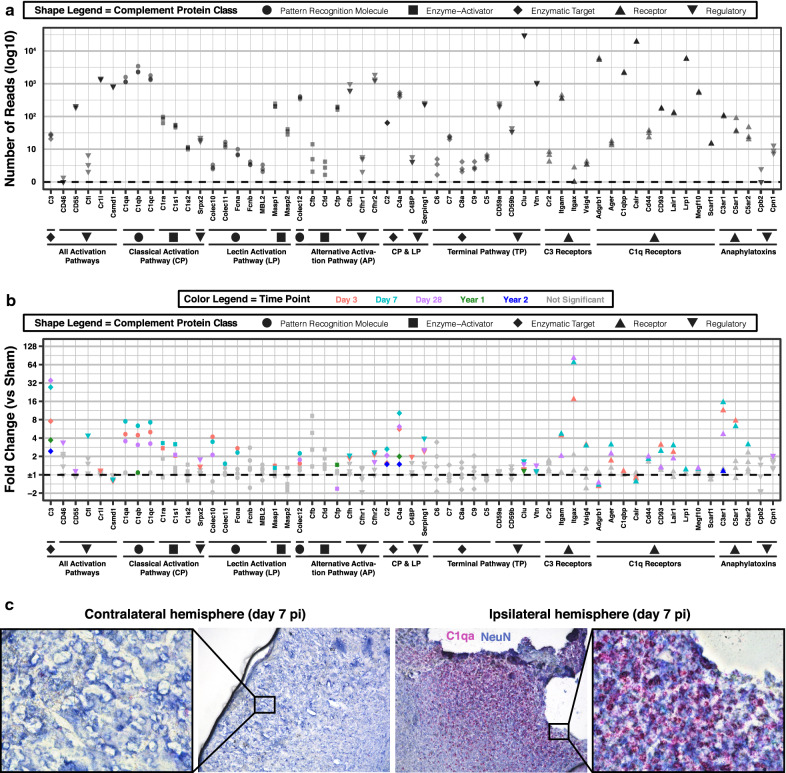
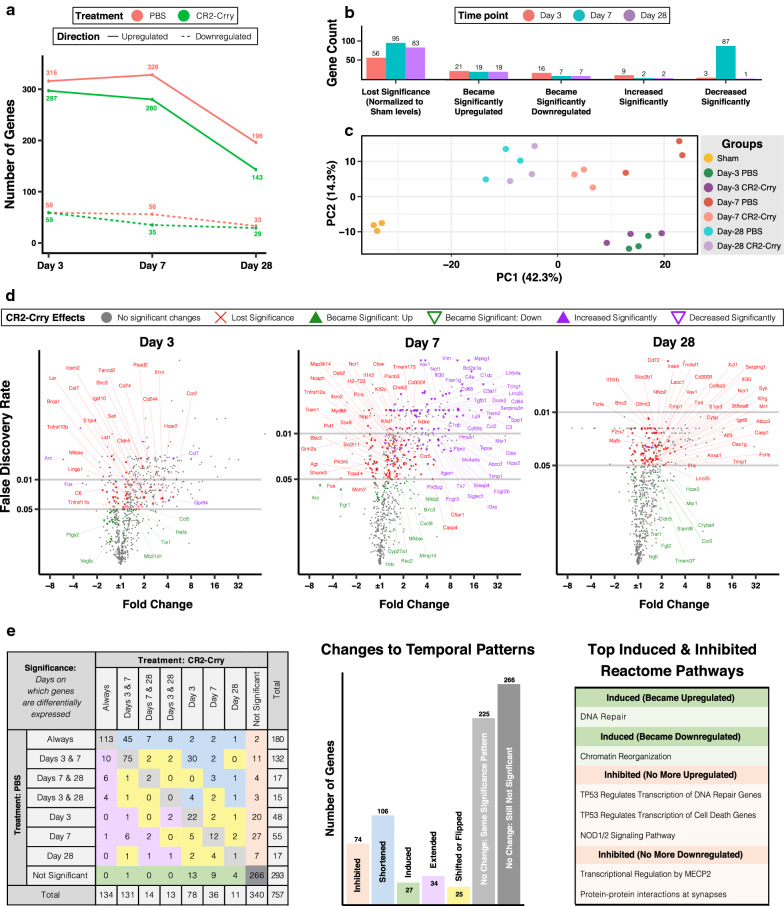
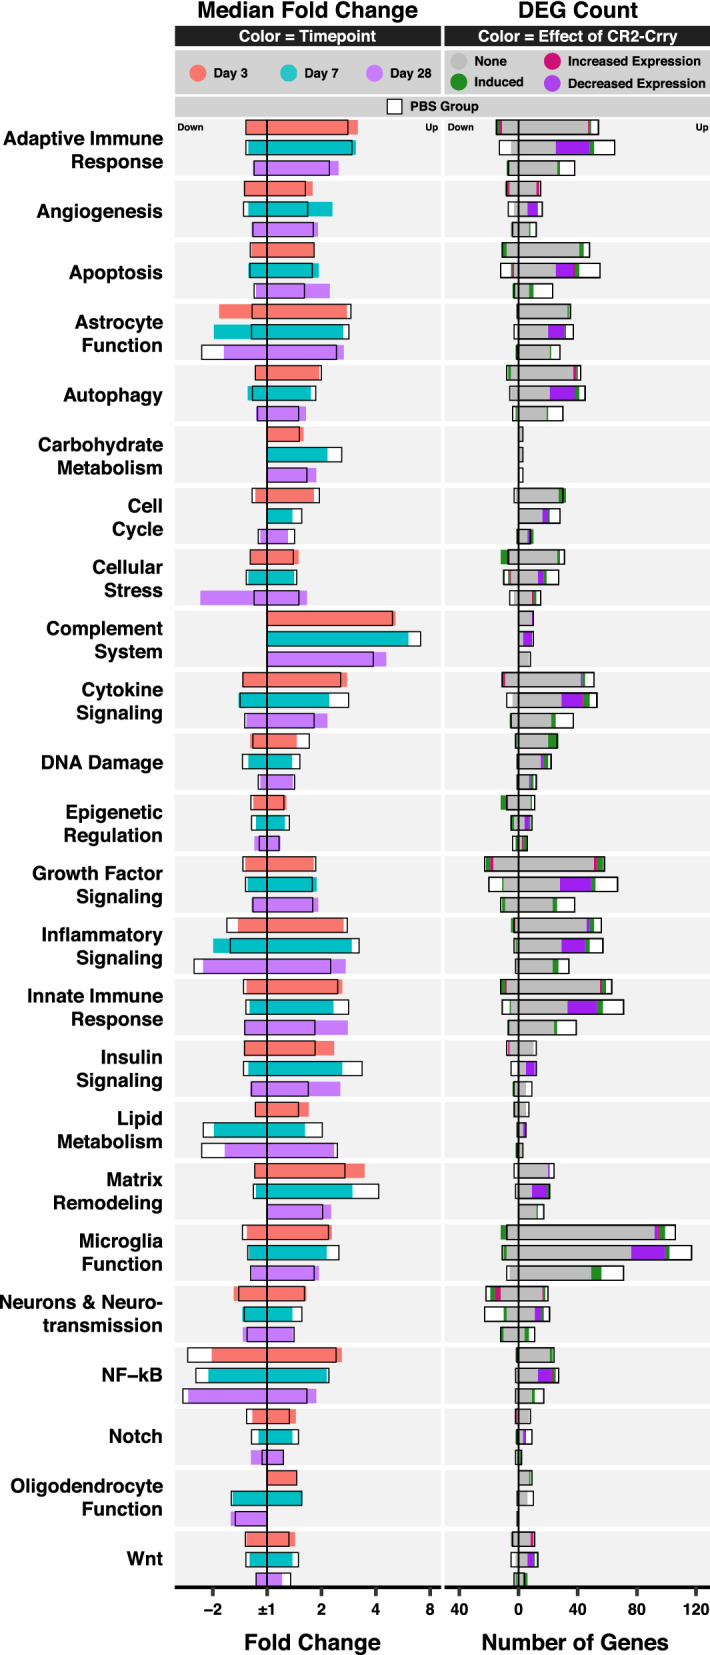
Activation of the complement system propagates neuroinflammation and brain damage early and chronically after traumatic brain injury (TBI). The complement system is complex and comprises more than 50 components, many of which remain to be characterized in the normal and injured brain. Moreover, complement therapeutic studies have focused on a limited number of histopathological outcomes, which while informative, do not assess the effect of complement inhibition on neuroprotection and inflammation in a comprehensive manner. Using high throughput gene expression technology (NanoString), we simultaneously analyzed complement gene expression profiles with other neuroinflammatory pathway genes at different time points after TBI. We additionally assessed the effects of complement inhibition on neuropathological processes. Analyses of neuroinflammatory genes were performed at days 3, 7, and 28 post injury in male C57BL/6 mice following a controlled cortical impact injury. We also characterized the expression of 59 complement genes at similar time points, and also at 1- and 2-years post injury. Overall, TBI upregulated the expression of markers of astrogliosis, immune cell activation, and cellular stress, and downregulated the expression of neuronal and synaptic markers from day 3 through 28 post injury. Moreover, TBI upregulated gene expression across most complement activation and effector pathways, with an early emphasis on classical pathway genes and with continued upregulation of C2, C3 and C4 expression 2 years post injury. Treatment using the targeted complement inhibitor, CR2-Crry, significantly ameliorated TBI-induced transcriptomic changes at all time points. Nevertheless, some immune and synaptic genes remained dysregulated with CR2-Crry treatment, suggesting adjuvant anti-inflammatory and neurotropic therapy may confer additional neuroprotection. In addition to characterizing complement gene expression in the normal and aging brain, our results demonstrate broad and chronic dysregulation of the complement system after TBI, and strengthen the view that the complement system is an attractive target for TBI therapy.
Keywords: Complement inhibition; Complement system; Gene expression; NanoString; Neuroinflammation; Traumatic brain injury.
© 2021. The Author(s).
Conflict of interest statement
None.
Figures
Similar articles
-
Complement propagates visual system pathology following traumatic brain injury.J Neuroinflammation. 2024 Apr 17;21(1):98. doi: 10.1186/s12974-024-03098-4. J Neuroinflammation. 2024. PMID: 38632569 Free PMC article.
-
Identifying the Role of Complement in Triggering Neuroinflammation after Traumatic Brain Injury.J Neurosci. 2018 Mar 7;38(10):2519-2532. doi: 10.1523/JNEUROSCI.2197-17.2018. Epub 2018 Feb 6. J Neurosci. 2018. PMID: 29437855 Free PMC article.
-
Complement Drives Synaptic Degeneration and Progressive Cognitive Decline in the Chronic Phase after Traumatic Brain Injury.J Neurosci. 2021 Feb 24;41(8):1830-1843. doi: 10.1523/JNEUROSCI.1734-20.2020. Epub 2021 Jan 14. J Neurosci. 2021. PMID: 33446516 Free PMC article.
-
Tackling Neuroinflammation After Traumatic Brain Injury: Complement Inhibition as a Therapy for Secondary Injury.Neurotherapeutics. 2023 Jan;20(1):284-303. doi: 10.1007/s13311-022-01306-8. Epub 2022 Oct 12. Neurotherapeutics. 2023. PMID: 36222978 Free PMC article. Review.
-
Medusa's Head: The Complement System in Traumatic Brain and Spinal Cord Injury.J Neurotrauma. 2018 Jan 15;35(2):226-240. doi: 10.1089/neu.2017.5168. Epub 2017 Nov 10. J Neurotrauma. 2018. PMID: 28816089 Review.
Cited by
-
Transcriptional Pathology Evolves over Time in Rat Hippocampus after Lateral Fluid Percussion Traumatic Brain Injury.Neurotrauma Rep. 2021 Nov 23;2(1):512-525. doi: 10.1089/neur.2021.0021. eCollection 2021. Neurotrauma Rep. 2021. PMID: 34909768 Free PMC article.
-
The brain-bone marrow axis and its implications for chronic traumatic brain injury.Res Sq [Preprint]. 2023 Oct 6:rs.3.rs-3356007. doi: 10.21203/rs.3.rs-3356007/v3. Res Sq. 2023. PMID: 37790560 Free PMC article. Preprint.
-
Complement propagates visual system pathology following traumatic brain injury.J Neuroinflammation. 2024 Apr 17;21(1):98. doi: 10.1186/s12974-024-03098-4. J Neuroinflammation. 2024. PMID: 38632569 Free PMC article.
-
The potential of gene delivery for the treatment of traumatic brain injury.J Neuroinflammation. 2024 Jul 28;21(1):183. doi: 10.1186/s12974-024-03156-x. J Neuroinflammation. 2024. PMID: 39069631 Free PMC article. Review.
-
Bioinformatics analysis of the mechanisms of traumatic brain injury-associated dementia based on the competing endogenous RNA.Psychopharmacology (Berl). 2024 Dec;241(12):2441-2452. doi: 10.1007/s00213-024-06691-w. Epub 2024 Sep 25. Psychopharmacology (Berl). 2024. PMID: 39317770
References
-
- Kelsen J, Karlsson M, Hansson MJ, Yang Z, Fischer W, Hugerth M, Nordström C-H, Åstrand R, Keep MF, Kilbaugh T, Wang KKW, Møller K, Juhler M, Elmér E. Copenhagen head injury ciclosporin study: a phase iia safety, pharmacokinetics, and biomarker study of ciclosporin in severe traumatic brain injury patients. J Neurotrauma. 2019;36:3253–3263. doi: 10.1089/neu.2018.6369. - DOI - PMC - PubMed
-
- Scott G, Zetterberg H, Jolly A, Cole JH, De Simoni S, Jenkins PO, Feeney C, Owen DR, Lingford-Hughes A, Howes O, Patel MC, Goldstone AP, Gunn RN, Blennow K, Matthews PM, Sharp DJ. Minocycline reduces chronic microglial activation after brain trauma but increases neurodegeneration. Brain. 2018;141:459–471. doi: 10.1093/brain/awx339. - DOI - PMC - PubMed
-
- Ciechanowska A, Ciapała K, Pawlik K, Oggioni M, Mercurio D, De Simoni M-G, Mika J. Initiators of classical and lectin complement pathways are differently engaged after traumatic brain injury-time-dependent changes in the cortex, striatum, thalamus and hippocampus in a mouse model. Int J Mol Sci. 2020 doi: 10.3390/ijms22010045. - DOI - PMC - PubMed
Publication types
MeSH terms
Substances
Grants and funding
LinkOut - more resources
Full Text Sources
Medical
Molecular Biology Databases
Miscellaneous
