. 2021 Jul 27;118(30):e2102007118.
doi: 10.1073/pnas.2102007118.

Long-term decrease in Asian monsoon rainfall and abrupt climate change events over the past 6,700 years

Affiliations

Long-term decrease in Asian monsoon rainfall and abrupt climate change events over the past 6,700 years

Bao Yang et al. Proc Natl Acad Sci U S A. .

Abstract

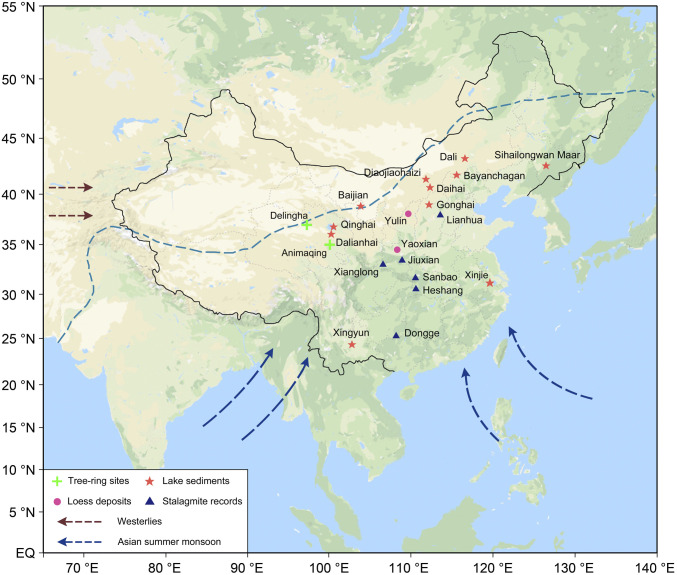
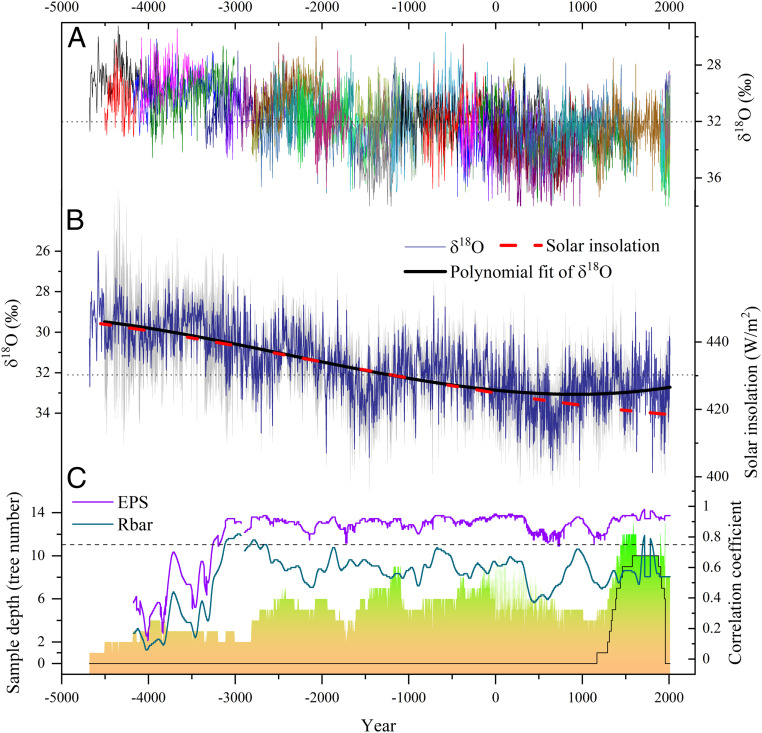
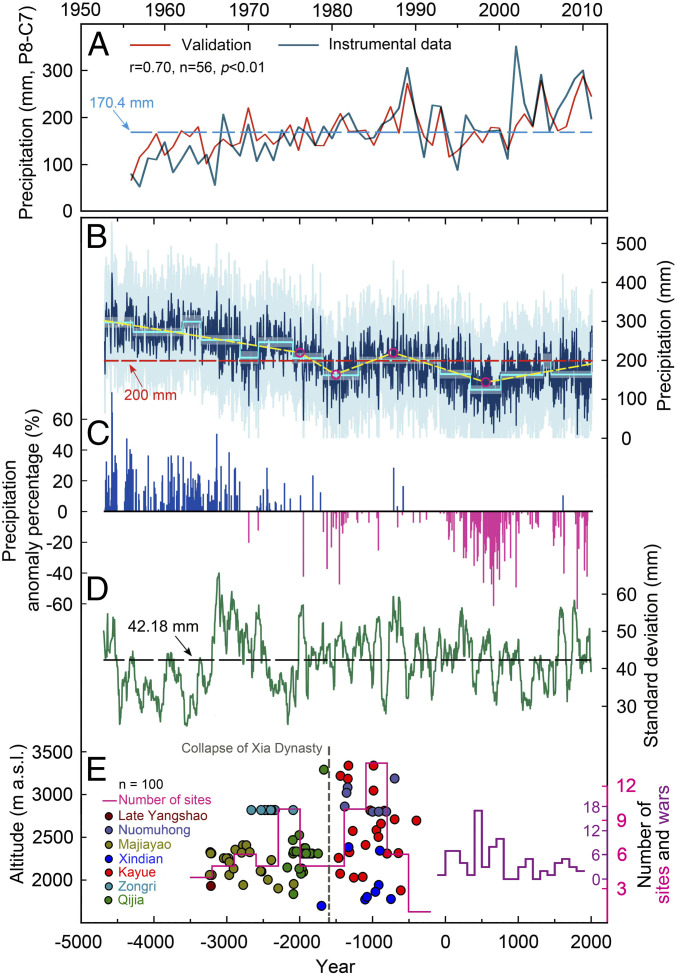
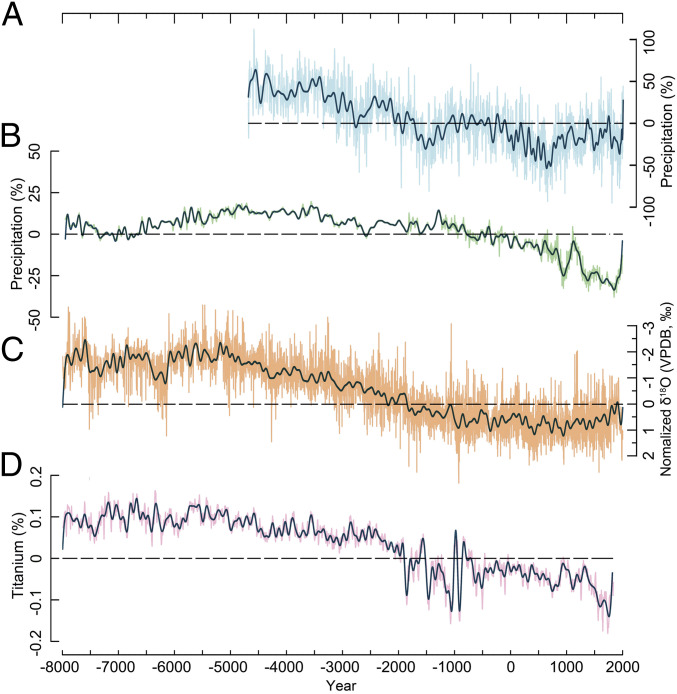
Asian summer monsoon (ASM) variability and its long-term ecological and societal impacts extending back to Neolithic times are poorly understood due to a lack of high-resolution climate proxy data. Here, we present a precisely dated and well-calibrated tree-ring stable isotope chronology from the Tibetan Plateau with 1- to 5-y resolution that reflects high- to low-frequency ASM variability from 4680 BCE to 2011 CE. Superimposed on a persistent drying trend since the mid-Holocene, a rapid decrease in moisture availability between ∼2000 and ∼1500 BCE caused a dry hydroclimatic regime from ∼1675 to ∼1185 BCE, with mean precipitation estimated at 42 ± 4% and 5 ± 2% lower than during the mid-Holocene and the instrumental period, respectively. This second-millennium-BCE megadrought marks the mid-to late Holocene transition, during which regional forests declined and enhanced aeolian activity affected northern Chinese ecosystems. We argue that this abrupt aridification starting ∼2000 BCE contributed to the shift of Neolithic cultures in northern China and likely triggered human migration and societal transformation.

Keywords: Asian summer monsoon; climate variability; megadrought; stable isotopes; tree rings.


Conflict of interest statement

The authors declare no competing interest.

Figures

Fig. 1.
Fig. 1.
Locations of Holocene paleoclimate records included in this study. The arrows depict the ASM and the Westerlies. The blue dashed line indicates the approximate present-day northern extent of the ASM region based on the observed mean 2 mm/d summer isohyet after ref. . The blue triangles represent stalagmite records, the purple dots indicate loess-paleosol profiles, the red asterisks indicate lake sediment records, and the green crosses indicate tree-ring chronologies (including DLH). See SI Appendix, Table S6 for details about each paleoclimate record.
Fig. 2.
Fig. 2.
The DLH tree-ring δ18O chronology. (A) Visualization of all 44 δ18O measurement series. (B) DLH δ18O chronology (navy blue line), third-order polynomial fitting of this chronology (thick black line), and July solar insolation between 30°N and 60°N (red line). The gray shading indicates the 95% CI of the composite δ18O chronology. For better comparison, the y-axis of the δ18O chronology was reversed. (C) Sample depth (with the black line indicating the number of trees in the pooled series) of the DLH δ18O chronology and Rbar (gray line) and EPS (purple line) of the δ18O dataset, calculated over a 250-y window in steps of 1 y. The Rbar time series was smoothed with a 100-y Gaussian-weighted filter. The annual values with EPS ≥ 0.85 accounts for 80.2% during 3250 BCE to 2011 CE, whereas 91.2% of values have EPS ≥ 0.25 and 37.7% are ≥ 0.50 before 3250 BCE.
Fig. 3.
Fig. 3.
Annual (prior August to current July) tree-ring δ18O precipitation reconstruction ranging from 4680 BCE to 2011 CE. (A) Comparison between reconstructed (red) and instrumental (blue) precipitation (1956 to 2011 CE). The horizontal dashed line indicates the annual mean precipitation (170.4 mm) over the instrumental period (1956 to 2011 CE). (B) Reconstructed precipitation (blue) and 95% CIs (light blue shading). The sky-blue step lines represent regime shifts, and the associated shading indicates 95% CIs for each subperiod (SI Appendix, Materials and Methods). Significant changes in temporal trends (yellow line, with magenta circles indicating trend change point years with P < 0.05: 544 CE, 709 BCE, 1501 BCE, and 2000 BCE; SI Appendix, Materials and Methods). The red horizontal line is the reconstructed mean precipitation of the entire period (4680 BCE to 2011 CE). (C) Extreme dry and wet annual events 4680 BCE to 2011 CE. The events were identified in the precipitation reconstruction as those years in which the precipitation exceeded the 10th and 90th percentiles of the whole period and expressed as percent anomalies from the instrumental period mean. (D) The 100-y running SD of the reconstructed mean annual precipitation. (E) Prehistoric cultural responses to rapid climatic change on the northeastern TP and in northern China (47, 53). The dots of different colors indicate calibrated accelerator mass spectrometry dates of charred grains and bones unearthed from Neolithic and Bronze sites on the northeastern TP, while the pink step line represents temporal variations of number of dated sites every 300 y. The purple step line denotes variations of war frequency over time in east Qinghai Province during the past two millennia (32, 33).
Fig. 4.
Fig. 4.
Comparison of the DLH tree-ring δ18O precipitation reconstruction with other paleoclimatic records spanning the Holocene. (A) Anomaly percentage of the DLH precipitation reconstruction calculated over the period 4680 BCE to 1950 CE (this study). (B) Pollen-based annual precipitation anomaly percentage in Gonghai Lake calculated over the common period 4680 BCE to 1950 CE (24). (C) Normalized stalagmite composite δ18O record from eastern China. The y-axis of the composite δ18O record was reversed for better comparison. Each stalagmite δ18O record was first normalized over the common period 4700 BCE to 1300 CE using the equation (abm) / bs, where a is the original value, and bm and bs are the mean and SD of the common period, respectively. See SI Appendix, Table S6 (site no.: 1 to 6) for details about each stalagmite record employed in the calculation. (D) Variation in location of the ITCZ reflected by Cariaco Basin Ti concentrations (26). All horizontal lines represent the long-term average calculated over the common period 4680 BCE to 1950 CE. The long-term precipitation average values are 200 and 511 mm, respectively for panels (A and B). For panels (AD), all series were first interpolated annually by using a piecewise linear interpolation method, and then each series (thin line) was smoothed by a 100-point low-pass filter (heavy line) to highlight the centennial scale variability.

Similar articles

Cited by

References

    1. Büntgen U., et al. ., 2500 years of European climate variability and human susceptibility. Science 331, 578–582 (2011). - PubMed
    1. Büntgen U., et al. ., Cooling and societal change during the Late Antique Little Ice Age from 536 to around 660 AD. Nat. Geosci. 9, 231–236 (2016).
    1. deMenocal P. B., Cultural responses to climate change during the late Holocene. Science 292, 667–673 (2001). - PubMed
    1. Stenseth N. C., et al. ., Ecological effects of climate fluctuations. Science 297, 1292–1296 (2002). - PubMed
    1. Buckley B. M., et al. ., Climate as a contributing factor in the demise of Angkor, Cambodia. Proc. Natl. Acad. Sci. U.S.A. 107, 6748–6752 (2010). - PMC - PubMed

Publication types

LinkOut - more resources