. 2021 Jul 27;118(30):e2102344118.
doi: 10.1073/pnas.2102344118.

Genome-scale metabolic network reconstruction of model animals as a platform for translational research

Affiliations

Genome-scale metabolic network reconstruction of model animals as a platform for translational research

Hao Wang et al. Proc Natl Acad Sci U S A. .

Abstract

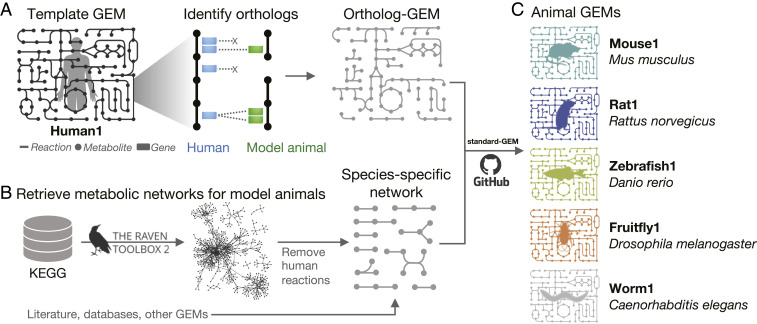
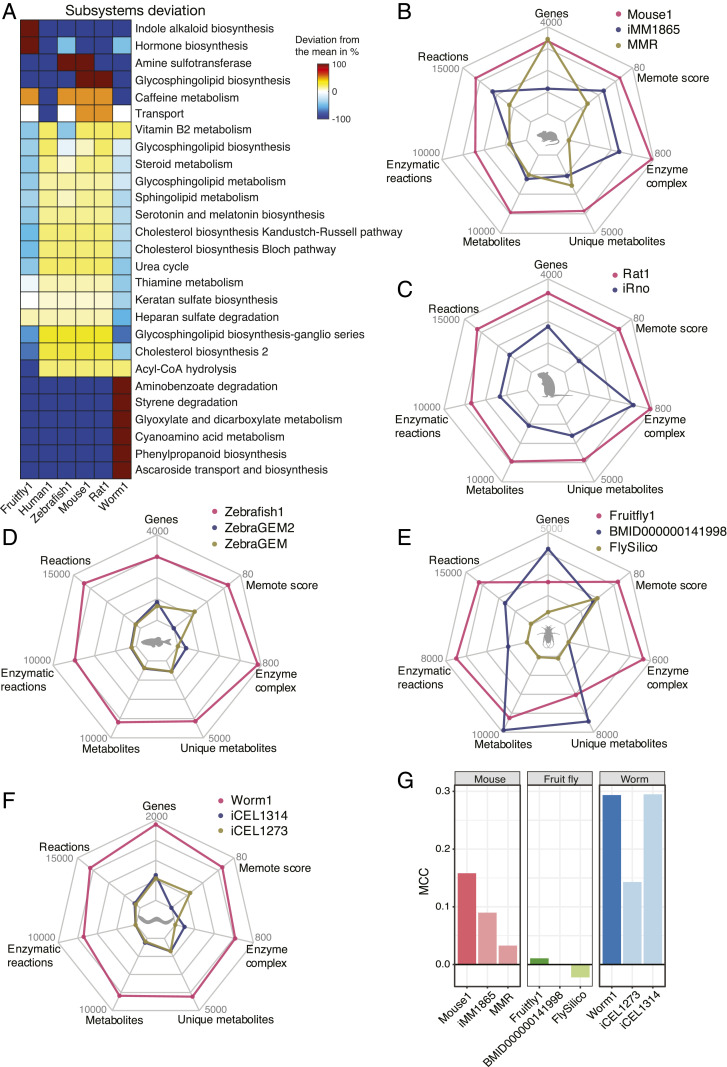
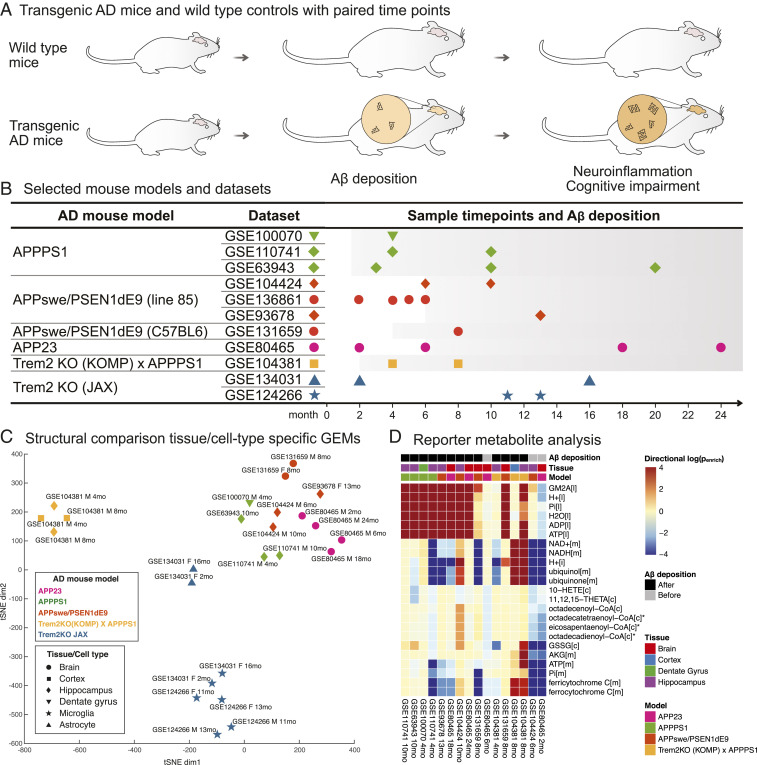
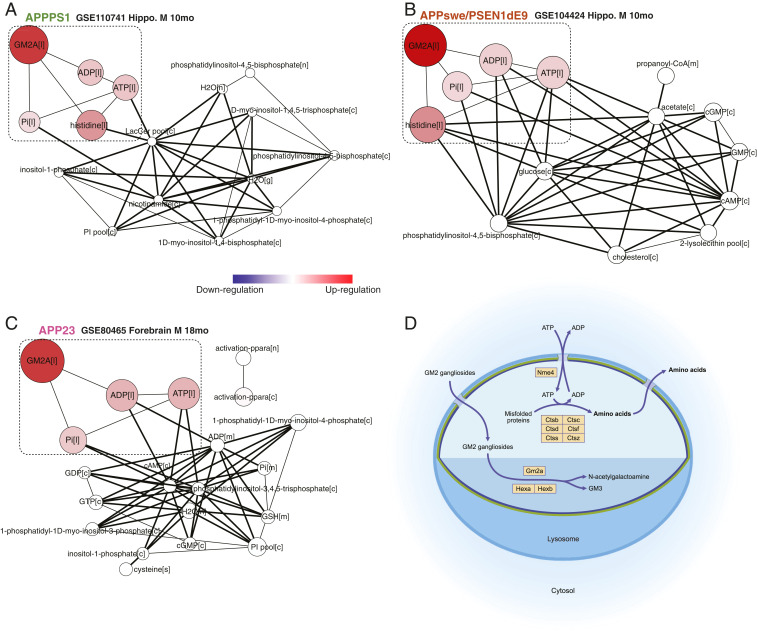
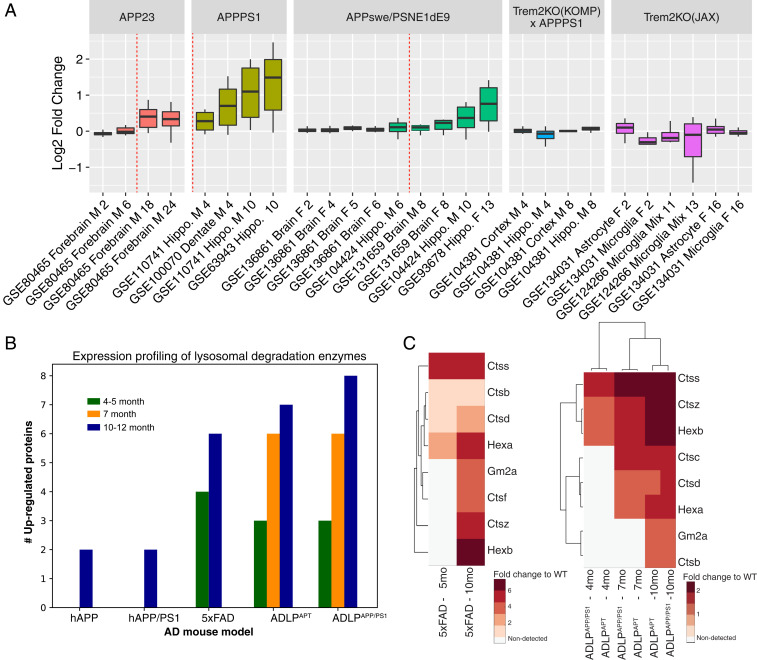
Genome-scale metabolic models (GEMs) are used extensively for analysis of mechanisms underlying human diseases and metabolic malfunctions. However, the lack of comprehensive and high-quality GEMs for model organisms restricts translational utilization of omics data accumulating from the use of various disease models. Here we present a unified platform of GEMs that covers five major model animals, including Mouse1 (Mus musculus), Rat1 (Rattus norvegicus), Zebrafish1 (Danio rerio), Fruitfly1 (Drosophila melanogaster), and Worm1 (Caenorhabditis elegans). These GEMs represent the most comprehensive coverage of the metabolic network by considering both orthology-based pathways and species-specific reactions. All GEMs can be interactively queried via the accompanying web portal Metabolic Atlas. Specifically, through integrative analysis of Mouse1 with RNA-sequencing data from brain tissues of transgenic mice we identified a coordinated up-regulation of lysosomal GM2 ganglioside and peptide degradation pathways which appears to be a signature metabolic alteration in Alzheimer's disease (AD) mouse models with a phenotype of amyloid precursor protein overexpression. This metabolic shift was further validated with proteomics data from transgenic mice and cerebrospinal fluid samples from human patients. The elevated lysosomal enzymes thus hold potential to be used as a biomarker for early diagnosis of AD. Taken together, we foresee that this evolving open-source platform will serve as an important resource to facilitate the development of systems medicines and translational biomedical applications.

Keywords: Alzheimer’s disease; Aβ deposition; animal model; genome-scale model; translational medicine.


Conflict of interest statement

The authors declare no competing interest.

Figures

Fig. 1.
Fig. 1.
Genome-scale metabolic modeling for model animals. A reconstruction approach of combining (A) ortholog-GEMs derived from the Human1 template and (B) species-specific metabolic networks extracted from the KEGG database by the RAVEN package was used to obtain (C) the model animal GEMs that were deposited on GitHub according to the standard-GEM scheme (28).
Fig. 2.
Fig. 2.
Systematic comparison and evaluation of generic model animal GEMs. (A) Significantly altered subsystems with deviated reaction content between the newly generated GEMs and Human1. The color indicates the percent difference in the number of reactions within each subsystem for a GEM compared to the mean number of reactions in that subsystem across all GEMs. Radar plots showing the comparison in the numbers of reactions, metabolites, genes, and enzyme complexes that have a GPR with “and” relation, as well as benchmarking MEMOTE scores between the GEMs for (B) mouse, (C) rat, (D) zebrafish, (E) fruit fly, and (F) worm. (G) Evaluation of gene essentiality prediction performance among GEMs of mouse, fruit fly, and worm using the MCC, which scores the relative amount of true and false positive and negative predictions of gene essentiality.
Fig. 3.
Fig. 3.
RNA-seq data integration and gene set analysis using Mouse1. (A) Various AD models of transgenic mice have been developed to recapitulate the pathology of Aβ deposition and subsequent phenotypes of subsequent neuroinflammation and cognitive impairment. (B) RNA-seq datasets from transgenic and wild-type mice with paired time points were selected for studying the metabolic changes associated with AD progression. The colored symbols are used to depict the different datasets and their sampling time points in relation to the onset and progression of Aβ deposition, which is illustrated by a shaded background (Dataset S3). (C) Structural comparison of tissue/cell type-specific GEMs using t-distributed stochastic neighbor embedding (tSNE) analysis. (D) Reporter metabolite gene set analysis using Mouse1. The log-transformed Penrich value quantifies the significance of substantially up- (in positive values) or down-regulated (in negative values) gene sets between diseased and normal conditions. Subcellular compartment is indicated in brackets, in which l, m, and c refer to lysosome, mitochondrion, and cytosol, respectively. *The full names of the CoA metabolites are (6Z,9Z,12Z,15Z)-octadecatetraenoyl-CoA, (5Z,8Z,11Z,14Z,17Z)-eicosapentaenoyl-CoA, and (7Z)-octadecenoyl-CoA and (6Z,9Z)-octadecadienoyl-CoA, respectively.
Fig. 4.
Fig. 4.
Integrative analysis of reporter metabolite gene sets with Mouse1. The up-regulation of a GM2A-centric subnetwork in lysosome is identified as a signature response to in APP overexpression models: (A) APPPS1, (B) APPswe/PSEN1dE9, and (C) APP23. This subnetwork, indicated by a dashed box, was found to be the most significant and consistent metabolic change to Aβ deposition. The nodes depict significantly changed reporter metabolite gene sets (cutoff: P < 0.002), each of which comprises all genes associated with reactions in which one metabolite is involved. The node color reflects directionality score that indicates the overall differential direction of the gene set, ranging from down- (blue) to up-regulation (red). The node sizes are proportional to the −log10p values of corresponding gene sets, and the edge width indicates the number of reactions shared by the metabolites. (D) The diagram depicts the lysosomal degradation pathways that were detected from the elevated mouse genes through integrative analysis.
Fig. 5.
Fig. 5.
Validation of elevated lysosomal enzymes at the RNA and protein level. (A) Log2 fold changes of lysosomal genes (Gm2a, Hexa, Hexb, Ctsb, Ctsc, Ctsd, Ctsf, Ctss, Ctsz, and Nme4) that are involved in GM2 ganglioside and peptide degradation. The data from each AD model are displayed in the order of sampling time, while the onset of Aβ deposition is indicated by a dashed red line. (B) Bar plot showing the number of significantly (P < 0.05) up-regulated lysosomal enzymes from five APP overexpression mouse models (hAPP, hAPP/PS1, 5xFAD, ADLPAPPPS1, and ADLPAPT) (Dataset S4). (C) Heat maps showing the fold changes of these significantly up-regulated lysosomal enzymes along AD progression.

References

    1. Beck A. P., Meyerholz D. K., Evolving challenges to model human diseases for translational research. Cell Tissue Res. 380, 305–311 (2020). - PubMed
    1. Phillips K. A., et al., Why primate models matter. Am. J. Primatol. 76, 801–827 (2014). - PMC - PubMed
    1. Daneshian M., Busquet F., Hartung T., Leist M., Animal use for science in Europe. ALTEX 32, 261–274 (2015). - PubMed
    1. Rosenthal N., Brown S., The mouse ascending: Perspectives for human-disease models. Nat. Cell Biol. 9, 993–999 (2007). - PubMed
    1. Davis E. E., Katsanis N., Zebrafish: A Model System to Study the Architecture of Human Genetic Disease (Elsevier, 2017).

Publication types

LinkOut - more resources