. 2021 Dec 1;11(12):3158-3177.
doi: 10.1158/2159-8290.CD-21-0209.

Genetic Screens Identify a Context-Specific PI3K/p27Kip1 Node Driving Extrahepatic Biliary Cancer

Affiliations

Genetic Screens Identify a Context-Specific PI3K/p27Kip1 Node Driving Extrahepatic Biliary Cancer

Chiara Falcomatà et al. Cancer Discov. .

Abstract

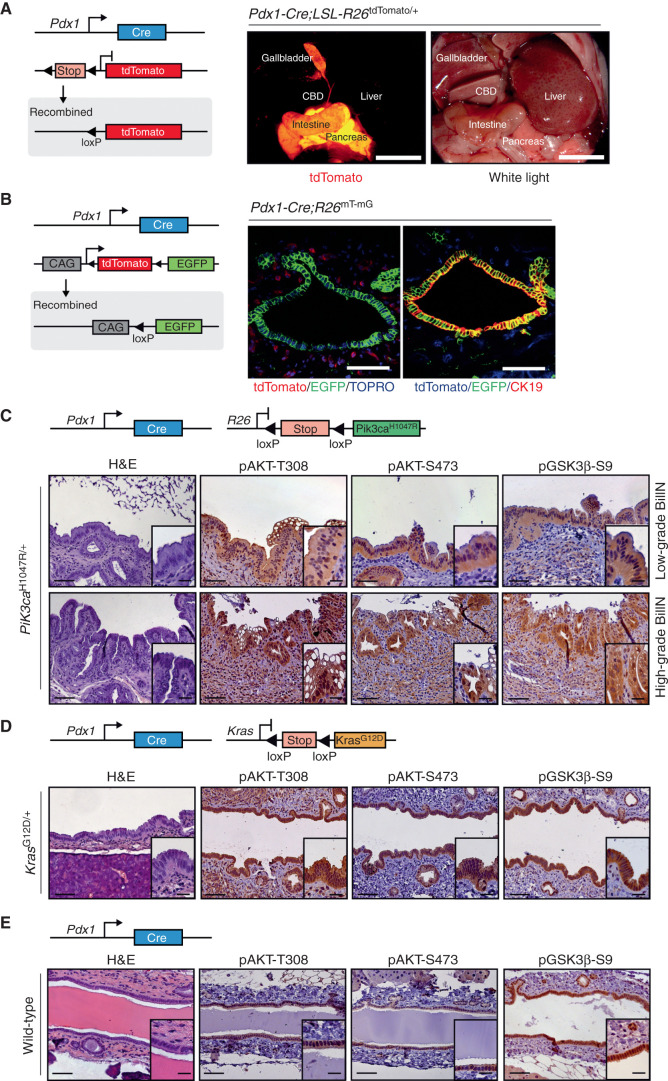
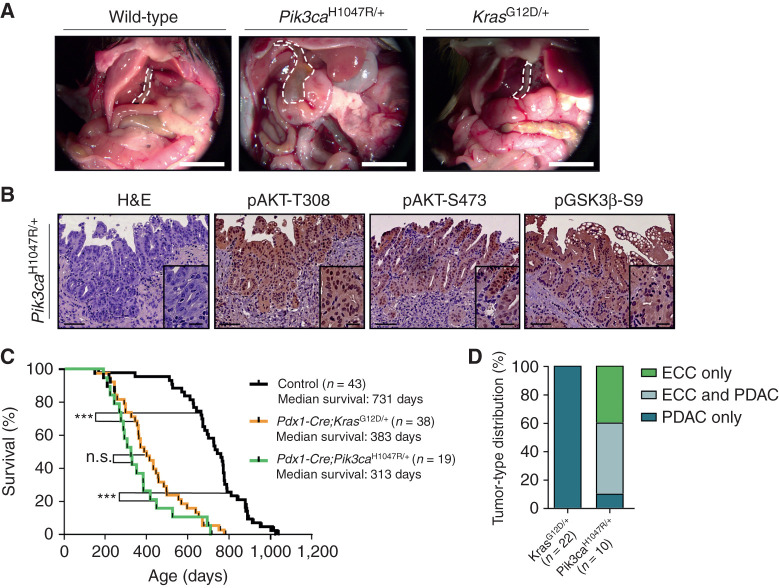
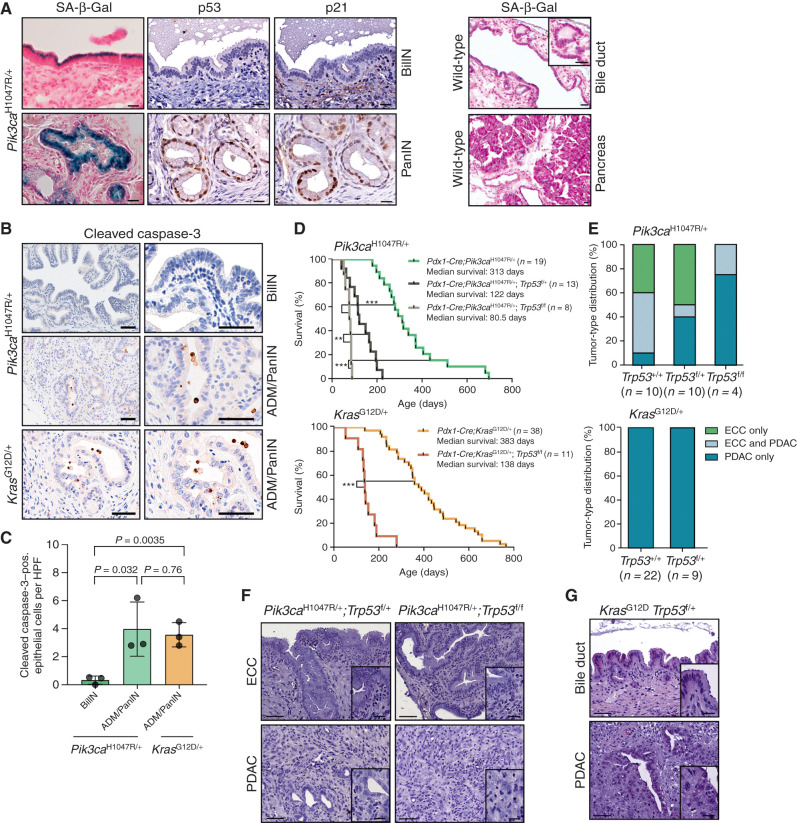
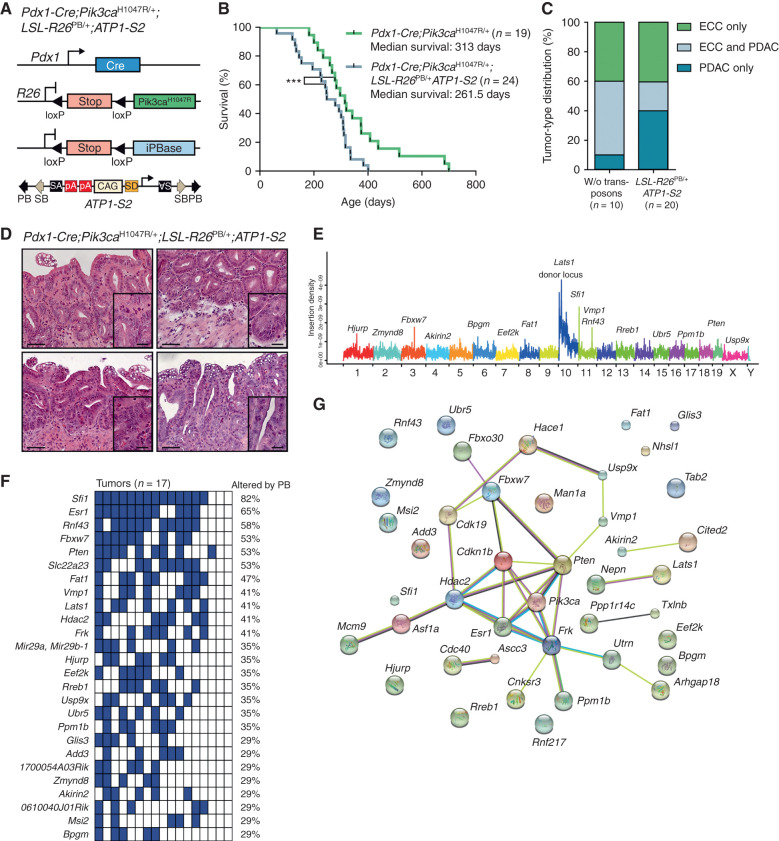
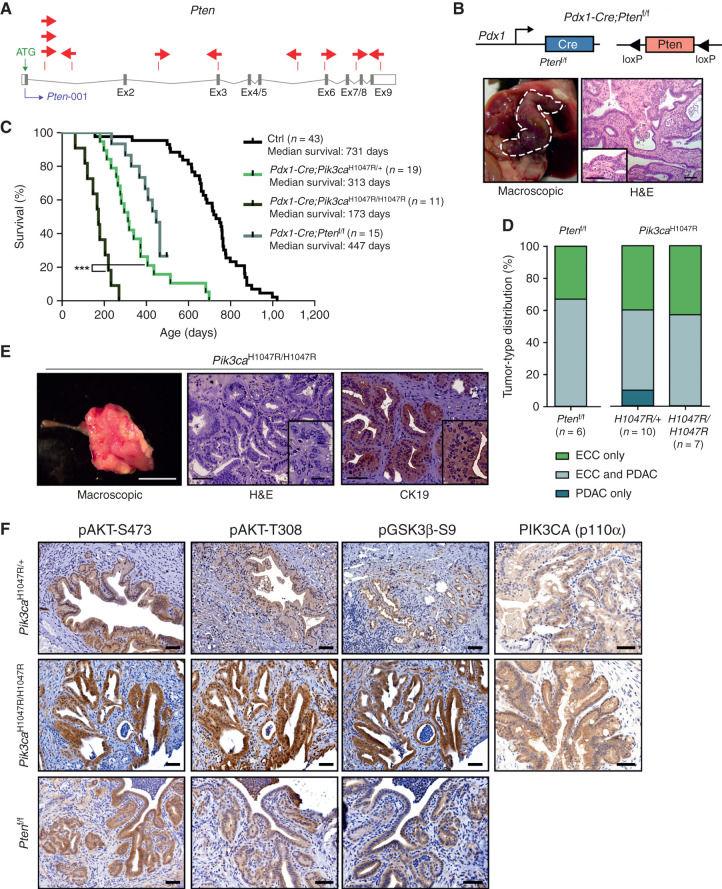
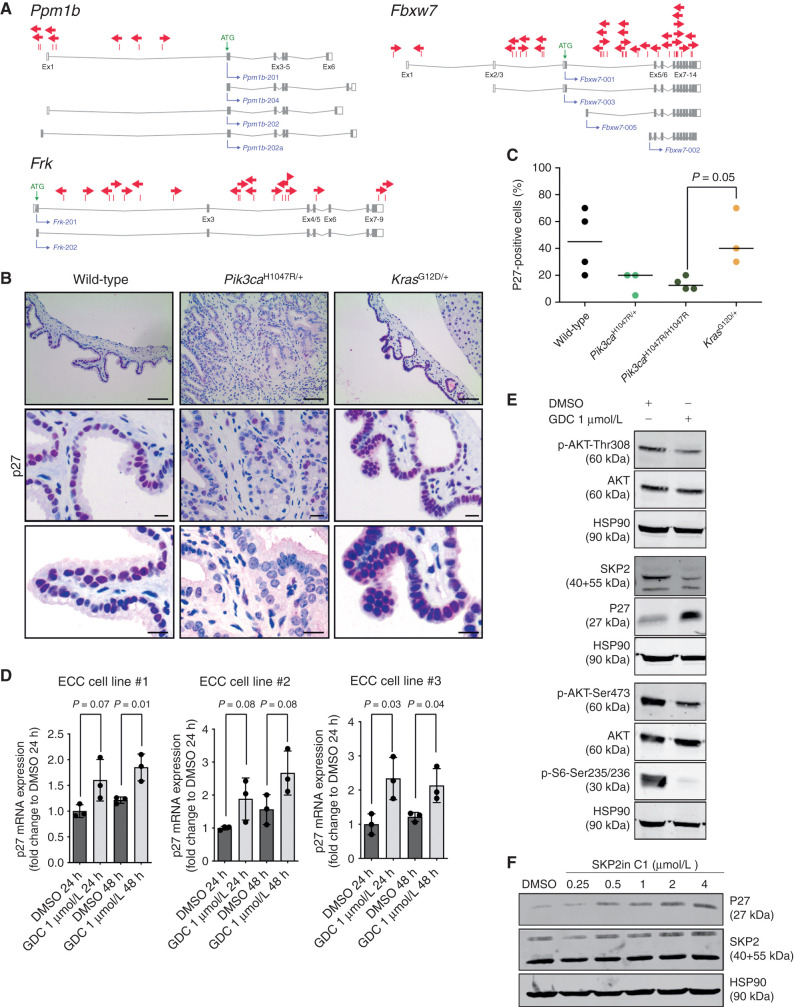
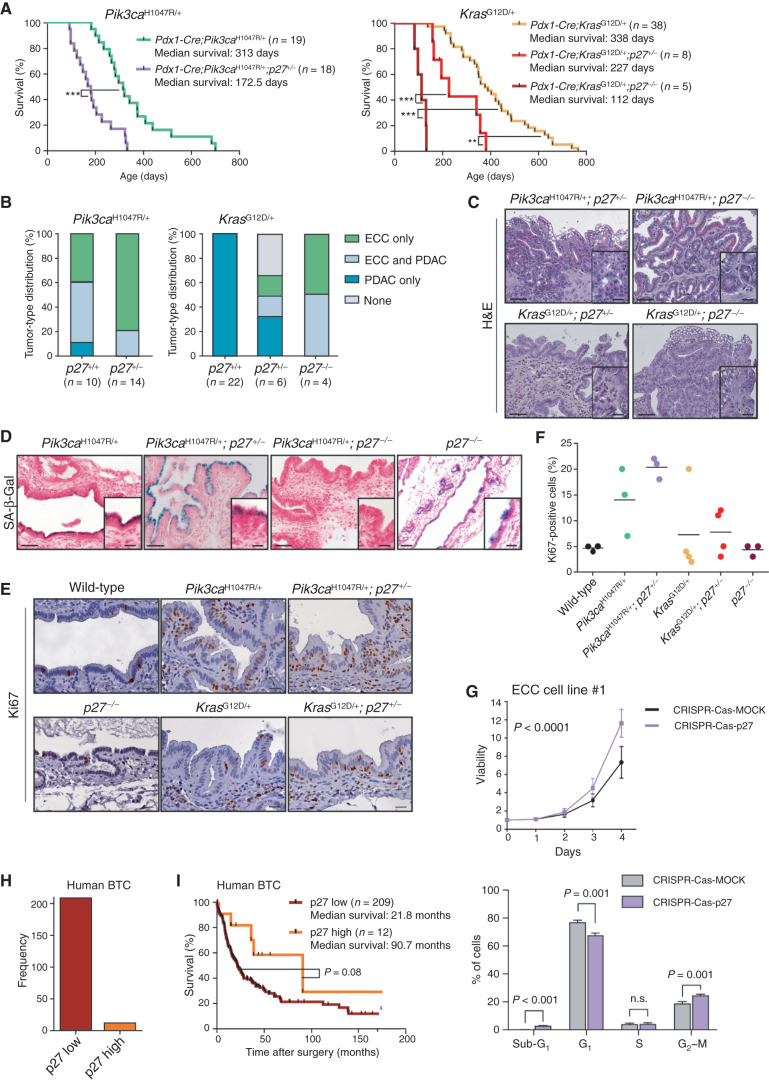
Biliary tract cancer ranks among the most lethal human malignancies, representing an unmet clinical need. Its abysmal prognosis is tied to an increasing incidence and a fundamental lack of mechanistic knowledge regarding the molecular basis of the disease. Here, we show that the Pdx1-positive extrahepatic biliary epithelium is highly susceptible toward transformation by activated PIK3CAH1047R but refractory to oncogenic KrasG12D. Using genome-wide transposon screens and genetic loss-of-function experiments, we discover context-dependent genetic interactions that drive extrahepatic cholangiocarcinoma (ECC) and show that PI3K signaling output strength and repression of the tumor suppressor p27Kip1 are critical context-specific determinants of tumor formation. This contrasts with the pancreas, where oncogenic Kras in concert with p53 loss is a key cancer driver. Notably, inactivation of p27Kip1 permits KrasG12D-driven ECC development. These studies provide a mechanistic link between PI3K signaling, tissue-specific tumor suppressor barriers, and ECC pathogenesis, and present a novel genetic model of autochthonous ECC and genes driving this highly lethal tumor subtype.

Significance: We used the first genetically engineered mouse model for extrahepatic bile duct carcinoma to identify cancer genes by genome-wide transposon-based mutagenesis screening. Thereby, we show that PI3K signaling output strength and p27Kip1 function are critical determinants for context-specific ECC formation. This article is highlighted in the In This Issue feature, p. 2945.


Figures

Figure 1. Constitutive activation of the PI3K signaling pathway induces premalignant biliary intraepithelial neoplasia (BilIN). A, Left: genetic strategy and recombination scheme to analyze the patterns of Pdx1-Cre transgene expression using a conditional tdTomato reporter allele (LSL-R26tdTomato/+). Right: macroscopic fluorescence and white-light images of the Pdx1-Cre;LSL-R26tdTomato/+ reporter mouse. Visualization of tdTomato reveals reporter gene expression (red) in the pancreas, duodenum, gallbladder, and common bile duct (CBD). Scale bars, 1 cm. B, Left: genetic strategy and recombination scheme to analyze the patterns of Pdx1-Cre transgene expression using a switchable floxed double-color fluorescent tdTomato-EGFP Cre reporter line (R26mT-mG). Right panel, left image: representative confocal microscopic image of tdTomato (red color, non–Cre-recombined cells) and Cre-induced EGFP (green color) expression in the common bile duct. Note: Cre-mediated EGFP expression in the biliary epithelium and peribiliary glands, but not stromal cells. Nuclei were counterstained with TOPRO-3 (blue). Right image: representative immunofluorescence staining of CK19 (red color) of Pdx1-Cre;R26mT-mG/+ animal. Note: Blue color shows expression of tdTomato in unrecombined cells. Green color labels Cre-recombined cells that express EGFP. Colocalization of CK19 immunofluorescence staining (red) and EGFP expression (green) results in yellow color. Scale bars, 50 μm. C–E, Genetic strategy used to express oncogenic Pik3caH1047R (C), KrasG12D (D), or only Cre as control (E) in the common bile duct (top). Hematoxylin and eosin (H&E) staining and IHC analysis of PI3K/AKT pathway activation in the biliary epithelium of the common bile duct and different grades of dysplasia in BilIN (bottom). Scale bars, 50 μm for micrographs and 20 μm for insets.
Figure 1.
Constitutive activation of the PI3K signaling pathway induces premalignant biliary intraepithelial neoplasia (BilIN). A, Left: genetic strategy and recombination scheme to analyze the patterns of Pdx1-Cre transgene expression using a conditional tdTomato reporter allele (LSL-R26tdTomato/+). Right: macroscopic fluorescence and white-light images of the Pdx1-Cre;LSL-R26tdTomato/+ reporter mouse. Visualization of tdTomato reveals reporter gene expression (red) in the pancreas, duodenum, gallbladder, and common bile duct (CBD). Scale bars, 1 cm. B, Left: genetic strategy and recombination scheme to analyze the patterns of Pdx1-Cre transgene expression using a switchable floxed double-color fluorescent tdTomato-EGFP Cre reporter line (R26mT-mG). Right panel, left image: representative confocal microscopic image of tdTomato (red color, non–Cre-recombined cells) and Cre-induced EGFP (green color) expression in the common bile duct. Note: Cre-mediated EGFP expression in the biliary epithelium and peribiliary glands, but not stromal cells. Nuclei were counterstained with TOPRO-3 (blue). Right image: representative immunofluorescence staining of CK19 (red color) of Pdx1-Cre;R26mT-mG/+ animal. Note: Blue color shows expression of tdTomato in unrecombined cells. Green color labels Cre-recombined cells that express EGFP. Colocalization of CK19 immunofluorescence staining (red) and EGFP expression (green) results in yellow color. Scale bars, 50 μm. C–E, Genetic strategy used to express oncogenic Pik3caH1047R (C), KrasG12D (D), or only Cre as control (E) in the common bile duct (top). Hematoxylin and eosin (H&E) staining and IHC analysis of PI3K/AKT pathway activation in the biliary epithelium of the common bile duct and different grades of dysplasia in BilIN (bottom). Scale bars, 50 μm for micrographs and 20 μm for insets.
Figure 2. Expression of oncogenic Pik3caH1047R but not KrasG12D induces ECC. A, Representative in situ images of 12-month-old wild-type (control), Pdx1-Cre;LSL-Pik3caH1047R/+, and Pdx1-Cre;LSL-KrasG12D/+ mice. The common bile duct is outlined by a white dashed line. Scale bars, 1 cm. B, Representative hematoxylin and eosin (H&E) stainings and IHC analyses of PI3K/AKT pathway activation in the common bile duct of aged Pdx1-Cre;LSL-Pik3caH1047R/+ mice with invasive ECC. Scale bars, 50 μm for micrographs and 20 μm for insets. C, Kaplan–Meier survival curves of the indicated genotypes (n.s., not significant; ***, P < 0.001, log-rank test). D, Tumor-type distribution in percentage according to histologic analysis of the extrahepatic bile duct and the pancreas from Pdx1-Cre;LSL-KrasG12D/+ and Pdx1-Cre;LSL-Pik3caH1047R/+ mice.
Figure 2.
Expression of oncogenic Pik3caH1047R but not KrasG12D induces ECC. A, Representative in situ images of 12-month-old wild-type (control), Pdx1-Cre;LSL-Pik3caH1047R/+, and Pdx1-Cre;LSL-KrasG12D/+ mice. The common bile duct is outlined by a white dashed line. Scale bars, 1 cm. B, Representative hematoxylin and eosin (H&E) stainings and IHC analyses of PI3K/AKT pathway activation in the common bile duct of aged Pdx1-Cre;LSL-Pik3caH1047R/+ mice with invasive ECC. Scale bars, 50 μm for micrographs and 20 μm for insets. C, Kaplan–Meier survival curves of the indicated genotypes (n.s., not significant; ***, P < 0.001, log-rank test). D, Tumor-type distribution in percentage according to histologic analysis of the extrahepatic bile duct and the pancreas from Pdx1-Cre;LSL-KrasG12D/+ and Pdx1-Cre;LSL-Pik3caH1047R/+ mice.
Figure 3. Oncogenic PI3K signaling induces senescence in the extrahepatic bile duct that is independent of the Trp53 pathway. A, Left, representative SA-β-Gal staining, and p53 and p21 IHC of BilIN (top) and PanIN (bottom) lesions of a Pdx1-Cre;Pik3caH1047R/+ mouse. Right, representative SA-β-Gal staining of wild-type extrahepatic bile duct and pancreas. Scale bars, 20 μm. B, Representative IHC cleaved caspase-3 staining of BilIN and ADM/PanIN of a Pdx1-Cre;LSL-Pik3caH1047R/+ mouse and an ADM/PanIN of Pdx1-Cre;LSL-KrasG12D/+ mouse. Scale bars, 50 μm. C, Quantification of cleaved caspase-3–positive epithelial cells in BilIN and ADM/PanIN lesions of the indicated genotypes. Each dot represents one animal (mean ± SD; P values are indicated, two-tailed Student t test). HPF, high-power field; pos., positive. D, Kaplan–Meier survival curves of the indicated genotypes (**, P < 0.01; ***, P < 0.001, log-rank test). E, Top: tumor-type distribution according to histologic analysis of the extrahepatic bile duct and pancreas of Pdx1-Cre;LSL-Pik3caH1047R/+, Pdx1-Cre;LSL-Pik3caH1047R/+;p53f/+, and Pdx1-Cre;LSL-Pik3caH1047R/+;p53f/f mice. Note: Reduced ECC fraction in mice with the Pdx1-Cre;Pik3caH1047R/+;p53f/f genotype (P = 0.02, Fisher exact test). Bottom: tumor-type distribution according to histologic analysis of the extrahepatic bile duct and pancreas of Pdx1-Cre;LSL-KrasG12D/+ and Pdx1-Cre;LSL-KrasG12D/+;p53f/+ mice. F, Representative hematoxylin and eosin (H&E) staining of ECC and PDAC of Pdx1-Cre;LSL-Pik3caH1047R/+;p53f/+ and Pdx1-Cre;LSL-Pik3caH1047R/+;p53f/f mice. G, Representative H&E staining of the common bile duct and PDAC of a Pdx1-Cre;LSL-KrasG12D/+;p53f/+ mouse. Scale bars, 50 μm for micrographs and 20 μm for insets. The Pdx1-Cre;Pik3caH1047R/+ and Pdx1-Cre;LSL-KrasG12D/+ cohorts shown in D and E are the same as those shown in Fig. 2C and D.
Figure 3.
Oncogenic PI3K signaling induces senescence in the extrahepatic bile duct that is independent of the Trp53 pathway. A, Left, representative SA-β-Gal staining, and p53 and p21 IHC of BilIN (top) and PanIN (bottom) lesions of a Pdx1-Cre;Pik3caH1047R/+ mouse. Right, representative SA-β-Gal staining of wild-type extrahepatic bile duct and pancreas. Scale bars, 20 μm. B, Representative IHC cleaved caspase-3 staining of BilIN and ADM/PanIN of a Pdx1-Cre;LSL-Pik3caH1047R/+ mouse and an ADM/PanIN of Pdx1-Cre;LSL-KrasG12D/+ mouse. Scale bars, 50 μm. C, Quantification of cleaved caspase-3–positive epithelial cells in BilIN and ADM/PanIN lesions of the indicated genotypes. Each dot represents one animal (mean ± SD; P values are indicated, two-tailed Student t test). HPF, high-power field; pos., positive. D, Kaplan–Meier survival curves of the indicated genotypes (**, P < 0.01; ***, P < 0.001, log-rank test). E, Top: tumor-type distribution according to histologic analysis of the extrahepatic bile duct and pancreas of Pdx1-Cre;LSL-Pik3caH1047R/+, Pdx1-Cre;LSL-Pik3caH1047R/+;p53f/+, and Pdx1-Cre;LSL-Pik3caH1047R/+;p53f/f mice. Note: Reduced ECC fraction in mice with the Pdx1-Cre;Pik3caH1047R/+;p53f/f genotype (P = 0.02, Fisher exact test). Bottom: tumor-type distribution according to histologic analysis of the extrahepatic bile duct and pancreas of Pdx1-Cre;LSL-KrasG12D/+ and Pdx1-Cre;LSL-KrasG12D/+;p53f/+ mice. F, Representative hematoxylin and eosin (H&E) staining of ECC and PDAC of Pdx1-Cre;LSL-Pik3caH1047R/+;p53f/+ and Pdx1-Cre;LSL-Pik3caH1047R/+;p53f/f mice. G, Representative H&E staining of the common bile duct and PDAC of a Pdx1-Cre;LSL-KrasG12D/+;p53f/+ mouse. Scale bars, 50 μm for micrographs and 20 μm for insets. The Pdx1-Cre;Pik3caH1047R/+ and Pdx1-Cre;LSL-KrasG12D/+ cohorts shown in D and E are the same as those shown in Fig. 2C and D.
Figure 4. Identification of cancer genes in the extrahepatic biliary tract by a piggyBac transposon mutagenesis screen. A, Genetic strategy used to activate ATP1-S2 transposons by the piggyBac (PB) transposase in a Pdx1-Cre;LSL-Pik3caH1047R/+-mutant background. The ATP1-S2 mouse line carries 20 copies of the transposon construct on chromosome 10, which can be mobilized by the piggyBac transposase. Unidirectional integration of the transposon can lead to gene activation through its CAG promoter. Gene inactivation is independent of transposon orientation. CAG, CAG promoter; iPBase, insect version of the piggyBac transposase; pA, poly adenylation site; SA, splice acceptor; SD, splice donor. B, Kaplan–Meier survival curves of the indicated genotypes (***, P < 0.001, log-rank test). The Pdx1-Cre;Pik3caH1047R/+ cohort is the same as that shown in Fig. 2C. C, Tumor-type distribution according to histologic analysis of the extrahepatic bile duct and pancreas from Pdx1-Cre;LSL-Pik3caH1047R/+ and Pdx1-Cre;LSL-Pik3caH1047R/+;LSL-R26PB;ATP1-S2 mice. W/o, without. D, Representative hematoxylin and eosin stainings of four individual piggyBac-induced ECC of Pdx1-Cre;LSL-Pik3caH1047R/+;LSL-R26PB;ATP1-S2 mice. Scale bars, 50 μm for micrographs and 20 μm for insets. E, Genome-wide representation of transposon insertion densities in ECCs (pooled data from 17 tumors). Selected CIS genes are depicted. Chromosomes are labeled by different colors, and chromosome number is indicated on the x-axis. The transposon donor locus is on chromosome 10. F, Co-occurrence analysis of the CIS identified by TAPDANCE analysis in 17 tumors. Each column represents one tumor where insertions in the respective genes are indicated in blue. The fraction of tumors carrying an insertion in the respective genes is given as percentage. G, Network of protein interactions between CIS genes generated by STRING analysis (38). Each network node represents one protein. Interactions are marked by lines in different colors (green, neighborhood evidence; purple, experimental evidence; light blue, database evidence; black, coexpression evidence). Cdkn1b, p27Kip1.
Figure 4.
Identification of cancer genes in the extrahepatic biliary tract by a piggyBac transposon mutagenesis screen. A, Genetic strategy used to activate ATP1-S2 transposons by the piggyBac (PB) transposase in a Pdx1-Cre;LSL-Pik3caH1047R/+-mutant background. The ATP1-S2 mouse line carries 20 copies of the transposon construct on chromosome 10, which can be mobilized by the piggyBac transposase. Unidirectional integration of the transposon can lead to gene activation through its CAG promoter. Gene inactivation is independent of transposon orientation. CAG, CAG promoter; iPBase, insect version of the piggyBac transposase; pA, poly adenylation site; SA, splice acceptor; SD, splice donor. B, Kaplan–Meier survival curves of the indicated genotypes (***, P < 0.001, log-rank test). The Pdx1-Cre;Pik3caH1047R/+ cohort is the same as that shown in Fig. 2C. C, Tumor-type distribution according to histologic analysis of the extrahepatic bile duct and pancreas from Pdx1-Cre;LSL-Pik3caH1047R/+ and Pdx1-Cre;LSL-Pik3caH1047R/+;LSL-R26PB;ATP1-S2 mice. W/o, without. D, Representative hematoxylin and eosin stainings of four individual piggyBac-induced ECC of Pdx1-Cre;LSL-Pik3caH1047R/+;LSL-R26PB;ATP1-S2 mice. Scale bars, 50 μm for micrographs and 20 μm for insets. E, Genome-wide representation of transposon insertion densities in ECCs (pooled data from 17 tumors). Selected CIS genes are depicted. Chromosomes are labeled by different colors, and chromosome number is indicated on the x-axis. The transposon donor locus is on chromosome 10. F, Co-occurrence analysis of the CIS identified by TAPDANCE analysis in 17 tumors. Each column represents one tumor where insertions in the respective genes are indicated in blue. The fraction of tumors carrying an insertion in the respective genes is given as percentage. G, Network of protein interactions between CIS genes generated by STRING analysis (38). Each network node represents one protein. Interactions are marked by lines in different colors (green, neighborhood evidence; purple, experimental evidence; light blue, database evidence; black, coexpression evidence). Cdkn1b, p27Kip1.
Figure 5. Functional validation of transposon integrations: PI3K signaling output is a critical determinant of ECC development. A, piggyBac insertion patterns in Pten. Pten possesses one protein-coding isoform consisting of nine exons. Each arrow represents one insertion and indicates the orientation of the CAG promoter that was introduced into the transposon. B, Top: genetic strategy used to inactivate Pten in the Pdx1 linage using a Pdx1-Cre line. Bottom: representative macroscopic picture (left, bile duct depicted by a white dashed line) and hematoxylin and eosin (H&E)–stained tissue section (right) of an ECC from a Pdx1-Cre;Ptenf/f mouse. Scale bars, 50 μm for micrographs and 50 μm for insets. C, Kaplan–Meier survival curves of the indicated genotypes (***, P < 0.001, log-rank test). The Pdx1-Cre;Pik3caH1047R/+ and the control cohort are the same as those shown in Fig. 2C. D, Tumor-type distribution according to histologic analysis of the bile duct and pancreas from Pdx1-Cre;Ptenf/f, Pdx1-Cre;LSL-Pik3caH1047R/+, and Pdx1-Cre;LSL-Pik3caH1047R/H1047R mice. The Pdx1-Cre;Pik3caH1047R/+ cohort is the same as shown in Fig. 2D. E, Left: representative macroscopic picture of an ECC from a Pdx1-Cre;LSL-Pik3caH1047R/H1047R mouse. Scale bar, 1 cm. Middle and right: representative H&E-stained (middle) and IHC CK19–stained (right) tissue section of an ECC from a Pdx1-Cre;Pik3caH1047R/H1047R mouse. Scale bars, 50 μm for micrographs and 20 μm for insets. F, Representative H&E stainings and IHC analyses of PI3K/AKT pathway activation and Pik3ca (p110α) expression in the common bile duct of Pdx1-Cre;LSL-Pik3caH1047R/+, Pdx1-Cre;LSL-Pik3caH1047R/H1047R, and Pdx1-Cre;Ptenf/f mice. Scale bars, 50 μm.
Figure 5.
Functional validation of transposon integrations: PI3K signaling output is a critical determinant of ECC development. A,piggyBac insertion patterns in Pten. Pten possesses one protein-coding isoform consisting of nine exons. Each arrow represents one insertion and indicates the orientation of the CAG promoter that was introduced into the transposon. B, Top: genetic strategy used to inactivate Pten in the Pdx1 linage using a Pdx1-Cre line. Bottom: representative macroscopic picture (left, bile duct depicted by a white dashed line) and hematoxylin and eosin (H&E)–stained tissue section (right) of an ECC from a Pdx1-Cre;Ptenf/f mouse. Scale bars, 50 μm for micrographs and 50 μm for insets. C, Kaplan–Meier survival curves of the indicated genotypes (***, P < 0.001, log-rank test). The Pdx1-Cre;Pik3caH1047R/+ and the control cohort are the same as those shown in Fig. 2C. D, Tumor-type distribution according to histologic analysis of the bile duct and pancreas from Pdx1-Cre;Ptenf/f, Pdx1-Cre;LSL-Pik3caH1047R/+, and Pdx1-Cre;LSL-Pik3caH1047R/H1047R mice. The Pdx1-Cre;Pik3caH1047R/+ cohort is the same as shown in Fig. 2D.E, Left: representative macroscopic picture of an ECC from a Pdx1-Cre;LSL-Pik3caH1047R/H1047R mouse. Scale bar, 1 cm. Middle and right: representative H&E-stained (middle) and IHC CK19–stained (right) tissue section of an ECC from a Pdx1-Cre;Pik3caH1047R/H1047R mouse. Scale bars, 50 μm for micrographs and 20 μm for insets. F, Representative H&E stainings and IHC analyses of PI3K/AKT pathway activation and Pik3ca (p110α) expression in the common bile duct of Pdx1-Cre;LSL-Pik3caH1047R/+, Pdx1-Cre;LSL-Pik3caH1047R/H1047R, and Pdx1-Cre;Ptenf/f mice. Scale bars, 50 μm.
Figure 6. p27Kip1 (Cdkn1b) expression is downregulated by mutant PIK3CAH1047R. A, piggyBac insertion patterns for selected CIS genes implicated in p27Kip1 (Cdkn1b) regulation. Ppmb1b and Fbxw7 possess four protein-coding transcripts. Frk has two protein-coding isoforms consisting of eight and nine exons. Each arrow represents one insertion and indicates the orientation of the CAG promoter that was introduced into the transposon. B, Representative IHC analysis of p27Kip1 expression in the common bile duct of 6-month-old wild-type, Pdx1-Cre;LSL-Pik3caH1047R/+, and Pdx1-Cre;LSL-KrasG12D/+ mice. Scale bars, 80 μm (top) and 20 μm (middle and bottom). IHC staining was performed using 3-amino-9-ethylcarbazole (AEC) as chromogen, resulting in a pink color of positively stained cells. C, Quantification of p27Kip1-positive bile duct epithelial cells in 6-month-old wild-type, Pdx1-Cre;LSL-Pik3caH1047R/+, Pdx1-Cre;LSL-Pik3caH1047R/H1047R, and Pdx1-Cre;LSL-KrasG12D/+ mice (n = 3–4 animals per genotype). Each dot represents one animal; the horizontal line represents the mean (P = 0.05, Pdx1-Cre;LSL-Pik3caH1047R/H1047R vs. Pdx1-Cre;LSL-KrasG12D/+, Wilcoxon rank sum test). D, qRT-PCR analysis of p27Kip1 mRNA expression in three primary murine ECC cell lines from Pdx1-Cre;LSL-Pik3caH1047R/+ mice treated with either vehicle (DMSO) or 1 μmol/L GDC-0941 (GDC) for 24 or 48 hours (h) as indicated. Data are shown as fold change to DMSO treatment (n = 3; mean + SD; P values are indicated, Student t test). E, Immunoblot analysis of PI3K/AKT pathway activation and p27Kip1 expression in primary murine ECC cell line #1 treated with either vehicle (DMSO) or 1 μmol/L GDC-0941 for 48 hours. Hsp90α/β was used as loading control. F, Immunoblot analysis of p27Kip1 expression in primary murine ECC cell line #1 treated with either vehicle (DMSO) or the indicated concentrations of the SKP2 inhibitor SKP2in C1 for 48 hours. Hsp90α/β was used as loading control.
Figure 6.
p27Kip1 (Cdkn1b) expression is downregulated by mutant PIK3CAH1047R. A,piggyBac insertion patterns for selected CIS genes implicated in p27Kip1 (Cdkn1b) regulation. Ppmb1b and Fbxw7 possess four protein-coding transcripts. Frk has two protein-coding isoforms consisting of eight and nine exons. Each arrow represents one insertion and indicates the orientation of the CAG promoter that was introduced into the transposon. B, Representative IHC analysis of p27Kip1 expression in the common bile duct of 6-month-old wild-type, Pdx1-Cre;LSL-Pik3caH1047R/+, and Pdx1-Cre;LSL-KrasG12D/+ mice. Scale bars, 80 μm (top) and 20 μm (middle and bottom). IHC staining was performed using 3-amino-9-ethylcarbazole (AEC) as chromogen, resulting in a pink color of positively stained cells. C, Quantification of p27Kip1-positive bile duct epithelial cells in 6-month-old wild-type, Pdx1-Cre;LSL-Pik3caH1047R/+, Pdx1-Cre;LSL-Pik3caH1047R/H1047R, and Pdx1-Cre;LSL-KrasG12D/+ mice (n = 3–4 animals per genotype). Each dot represents one animal; the horizontal line represents the mean (P = 0.05, Pdx1-Cre;LSL-Pik3caH1047R/H1047R vs. Pdx1-Cre;LSL-KrasG12D/+, Wilcoxon rank sum test). D, qRT-PCR analysis of p27Kip1 mRNA expression in three primary murine ECC cell lines from Pdx1-Cre;LSL-Pik3caH1047R/+ mice treated with either vehicle (DMSO) or 1 μmol/L GDC-0941 (GDC) for 24 or 48 hours (h) as indicated. Data are shown as fold change to DMSO treatment (n = 3; mean + SD; P values are indicated, Student t test). E, Immunoblot analysis of PI3K/AKT pathway activation and p27Kip1 expression in primary murine ECC cell line #1 treated with either vehicle (DMSO) or 1 μmol/L GDC-0941 for 48 hours. Hsp90α/β was used as loading control. F, Immunoblot analysis of p27Kip1 expression in primary murine ECC cell line #1 treated with either vehicle (DMSO) or the indicated concentrations of the SKP2 inhibitor SKP2in C1 for 48 hours. Hsp90α/β was used as loading control.
Figure 7. p27Kip1 is a context-specific roadblock for Kras-induced ECC formation. A, Kaplan–Meier survival curves of the indicated genotypes (***, P < 0.001; **, P < 0.01, log-rank test). B, Tumor type distribution according to histologic analysis of the extrahepatic bile duct and pancreas from Pdx1-Cre;LSL-Pik3caH1047R/+ and Pdx1-Cre;LSL-Pik3caH1047R/+;p27+/− mice (left) and Pdx1-Cre;LSL-KrasG12D/+, Pdx1-Cre;LSL-KrasG12D/+;p27+/−, and Pdx1-Cre;LSL-KrasG12D/+;p27−/− animals (right). Significant increase of ECC development in mice with the Pdx1-Cre;LSL-KrasG12D/+;p27−/− genotype (P < 0.0001, Fisher exact test). C, Representative hematoxylin and eosin (H&E) staining of the common bile duct of aged Pdx1-Cre;LSL-Pik3caH1047R/+;p27+/−, Pdx1-Cre;LSL-Pik3caH1047R/+;p27−/−, Pdx1-Cre;LSL-KrasG12D/+;p27+/−, and Pdx1-Cre;LSL-KrasG12D/+;p27−/− mice. D, Representative SA-β-Gal staining of the common bile duct of Pdx1-Cre;LSL-Pik3caH1047R/+, Pdx1-Cre;LSL-Pik3caH1047R/+;p27+/−, Pdx1-Cre;LSL-Pik3caH1047R/+;p27−/−, and p27−/− mice. C and D, Scale bars, 50 μm for micrographs and 20 μm for insets. E, Representative images of Ki67-stained common bile duct tissue sections of 3-month-old wild-type (control), Pdx1-Cre;LSL-Pik3caH1047R/+, Pdx1-Cre;LSL-Pik3caH1047R/+;p27+/−, p27−/−, Pdx1-Cre;LSL-KrasG12D/+, and Pdx1-Cre;LSL-KrasG12D/+;p27+/− mice. Scale bars, 20 μm. F, Quantification of Ki67-positive biliary epithelial cells of indicated genotypes. Each dot represents one animal, and the horizontal line represents the mean. G, Top: viability assay of primary murine ECC cell line #1 from a Pdx1-Cre;LSL-Pik3caH1047R/+ mouse after CRISPR-Cas9–mediated deletion of p27Kip1 (Cdkn1b). Cells were transfected with either Cas9-sgRNA-p27Kip1 targeting Cdkn1b (CRISPR-Cas-p27) or a MOCK Cas9-sgRNA-MOCK vector, selected using puromycin, and cell viability was measured in triplicate using the MTT assay (n = 4 independent experiments; mean ± SD; P < 0.0001, two-way ANOVA). Bottom: FACS-based cell-cycle analysis of the cells shown in the top panel. The P values were determined with multiple t tests and Benjamini correction and are shown in the figure. n.s., not significant. H, Quantification of p27Kip1 expression by IHC of 221 surgically resected human BTC specimens. I, Kaplan–Meier survival curves of patients with BTC with low or high p27Kip1 protein abundance (P = 0.08, log-rank test). The Pdx1-Cre;Pik3caH1047R/+ and Pdx1-Cre;LSL-KrasG12D/+ cohorts shown in A and B are the same as those shown in Fig. 2C and D.
Figure 7.
p27Kip1 is a context-specific roadblock for Kras-induced ECC formation. A, Kaplan–Meier survival curves of the indicated genotypes (***, P < 0.001; **, P < 0.01, log-rank test). B, Tumor type distribution according to histologic analysis of the extrahepatic bile duct and pancreas from Pdx1-Cre;LSL-Pik3caH1047R/+ and Pdx1-Cre;LSL-Pik3caH1047R/+;p27+/− mice (left) and Pdx1-Cre;LSL-KrasG12D/+, Pdx1-Cre;LSL-KrasG12D/+;p27+/−, and Pdx1-Cre;LSL-KrasG12D/+;p27−/− animals (right). Significant increase of ECC development in mice with the Pdx1-Cre;LSL-KrasG12D/+;p27−/− genotype (P < 0.0001, Fisher exact test). C, Representative hematoxylin and eosin (H&E) staining of the common bile duct of aged Pdx1-Cre;LSL-Pik3caH1047R/+;p27+/−, Pdx1-Cre;LSL-Pik3caH1047R/+;p27−/−, Pdx1-Cre;LSL-KrasG12D/+;p27+/−, and Pdx1-Cre;LSL-KrasG12D/+;p27−/− mice. D, Representative SA-β-Gal staining of the common bile duct of Pdx1-Cre;LSL-Pik3caH1047R/+, Pdx1-Cre;LSL-Pik3caH1047R/+;p27+/−, Pdx1-Cre;LSL-Pik3caH1047R/+;p27−/−, and p27−/− mice. C and D, Scale bars, 50 μm for micrographs and 20 μm for insets. E, Representative images of Ki67-stained common bile duct tissue sections of 3-month-old wild-type (control), Pdx1-Cre;LSL-Pik3caH1047R/+, Pdx1-Cre;LSL-Pik3caH1047R/+;p27+/−, p27−/−, Pdx1-Cre;LSL-KrasG12D/+, and Pdx1-Cre;LSL-KrasG12D/+;p27+/− mice. Scale bars, 20 μm. F, Quantification of Ki67-positive biliary epithelial cells of indicated genotypes. Each dot represents one animal, and the horizontal line represents the mean. G, Top: viability assay of primary murine ECC cell line #1 from a Pdx1-Cre;LSL-Pik3caH1047R/+ mouse after CRISPR-Cas9–mediated deletion of p27Kip1 (Cdkn1b). Cells were transfected with either Cas9-sgRNA-p27Kip1 targeting Cdkn1b (CRISPR-Cas-p27) or a MOCK Cas9-sgRNA-MOCK vector, selected using puromycin, and cell viability was measured in triplicate using the MTT assay (n = 4 independent experiments; mean ± SD; P < 0.0001, two-way ANOVA). Bottom: FACS-based cell-cycle analysis of the cells shown in the top panel. The P values were determined with multiple t tests and Benjamini correction and are shown in the figure. n.s., not significant. H, Quantification of p27Kip1 expression by IHC of 221 surgically resected human BTC specimens. I, Kaplan–Meier survival curves of patients with BTC with low or high p27Kip1 protein abundance (P = 0.08, log-rank test). The Pdx1-Cre;Pik3caH1047R/+ and Pdx1-Cre;LSL-KrasG12D/+ cohorts shown in A and B are the same as those shown in Fig. 2C and D.

Comment in

  • doi: 10.1158/2159-8290.CD-11-12-ITI

Similar articles

Cited by

  • Selecting an Appropriate Experimental Animal Model for Cholangiocarcinoma Research.
    Li M, Zhou X, Wang W, Ji B, Shao Y, Du Q, Yao J, Yang Y. Li M, et al. J Clin Transl Hepatol. 2022 Aug 28;10(4):700-710. doi: 10.14218/JCTH.2021.00374. Epub 2022 Feb 11. J Clin Transl Hepatol. 2022. PMID: 36062286 Free PMC article. Review.
  • Criteria for preclinical models of cholangiocarcinoma: scientific and medical relevance.
    Calvisi DF, Boulter L, Vaquero J, Saborowski A, Fabris L, Rodrigues PM, Coulouarn C, Castro RE, Segatto O, Raggi C, van der Laan LJW, Carpino G, Goeppert B, Roessler S, Kendall TJ, Evert M, Gonzalez-Sanchez E, Valle JW, Vogel A, Bridgewater J, Borad MJ, Gores GJ, Roberts LR, Marin JJG, Andersen JB, Alvaro D, Forner A, Banales JM, Cardinale V, Macias RIR, Vicent S, Chen X, Braconi C, Verstegen MMA, Fouassier L; CCA Model Consortium. Calvisi DF, et al. Nat Rev Gastroenterol Hepatol. 2023 Jul;20(7):462-480. doi: 10.1038/s41575-022-00739-y. Epub 2023 Feb 8. Nat Rev Gastroenterol Hepatol. 2023. PMID: 36755084 Review.
  • Genomic profiling of idiopathic peri-hilar cholangiocarcinoma reveals new targets and mutational pathways.
    Quinn LM, Haldenby S, Antzcak P, Fowler A, Bullock K, Kenny J, Gilbert T, Andrews T, Diaz-Nieto R, Fenwick S, Jones R, Costello-Goldring E, Poston G, Greenhalf W, Palmer D, Malik H, Goldring C. Quinn LM, et al. Sci Rep. 2023 Apr 24;13(1):6681. doi: 10.1038/s41598-023-33096-0. Sci Rep. 2023. PMID: 37095160 Free PMC article.
  • Cholangiocarcinoma: Molecular Abnormalities and Cells of Origin.
    Testa U, Pelosi E, Castelli G. Testa U, et al. Technol Cancer Res Treat. 2023 Jan-Dec;22:15330338221128689. doi: 10.1177/15330338221128689. Technol Cancer Res Treat. 2023. PMID: 36872875 Free PMC article. Review.
  • PTEN deficiency induces an extrahepatic cholangitis-cholangiocarcinoma continuum via aurora kinase A in mice.
    Yang Y, Wang J, Wan J, Cheng Q, Cheng Z, Zhou X, Wang O, Shi K, Wang L, Wang B, Zhu X, Chen J, Feng D, Liu Y, Jahan-Mihan Y, Haddock AN, Edenfield BH, Peng G, Hohenstein JD, McCabe CE, O'Brien DR, Wang C, Ilyas SI, Jiang L, Torbenson MS, Wang H, Nakhleh RE, Shi X, Wang Y, Bi Y, Gores GJ, Patel T, Ji B. Yang Y, et al. J Hepatol. 2024 Jul;81(1):120-134. doi: 10.1016/j.jhep.2024.02.018. Epub 2024 Feb 28. J Hepatol. 2024. PMID: 38428643 Free PMC article.

References

    1. Banales JM, Marin JJG, Lamarca A, Rodrigues PM, Khan SA, Roberts LRet al. . Cholangiocarcinoma 2020: the next horizon in mechanisms and management. Nat Rev Gastroenterol Hepatol 2020;17:557–88. - PMC - PubMed
    1. Rizvi S, Gores GJ. Pathogenesis, diagnosis, and management of cholangiocarcinoma. Gastroenterology 2013;145:1215–29. - PMC - PubMed
    1. Nakamura H, Arai Y, Totoki Y, Shirota T, Elzawahry A, Kato Met al. . Genomic spectra of biliary tract cancer. Nat Genet 2015;47:1003–10. - PubMed
    1. Zong Y, Stanger BZ. Molecular mechanisms of bile duct development. Int J Biochem Cell Biol 2011;43:257–64. - PMC - PubMed
    1. Spence JR, Lange AW, Lin S-CJ, Kaestner KH, Lowy AM, Kim Iet al. . Sox17 regulates organ lineage segregation of ventral foregut progenitor cells. Dev Cell 2009;17:62–74. - PMC - PubMed

Publication types