. 2021 Jul 16;7(1):180.
doi: 10.1038/s41420-021-00567-0.

Single-cell RNA-seq reveals cellular heterogeneity of mouse carotid artery under disturbed flow

Affiliations

Single-cell RNA-seq reveals cellular heterogeneity of mouse carotid artery under disturbed flow

Fengchan Li et al. Cell Death Discov. .

Abstract

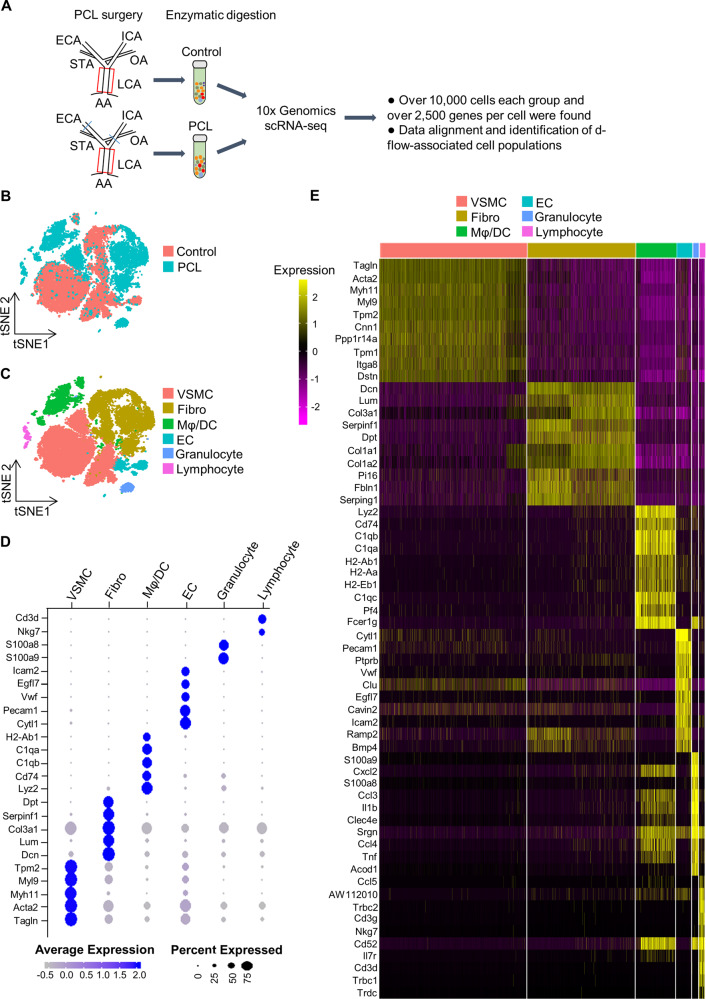
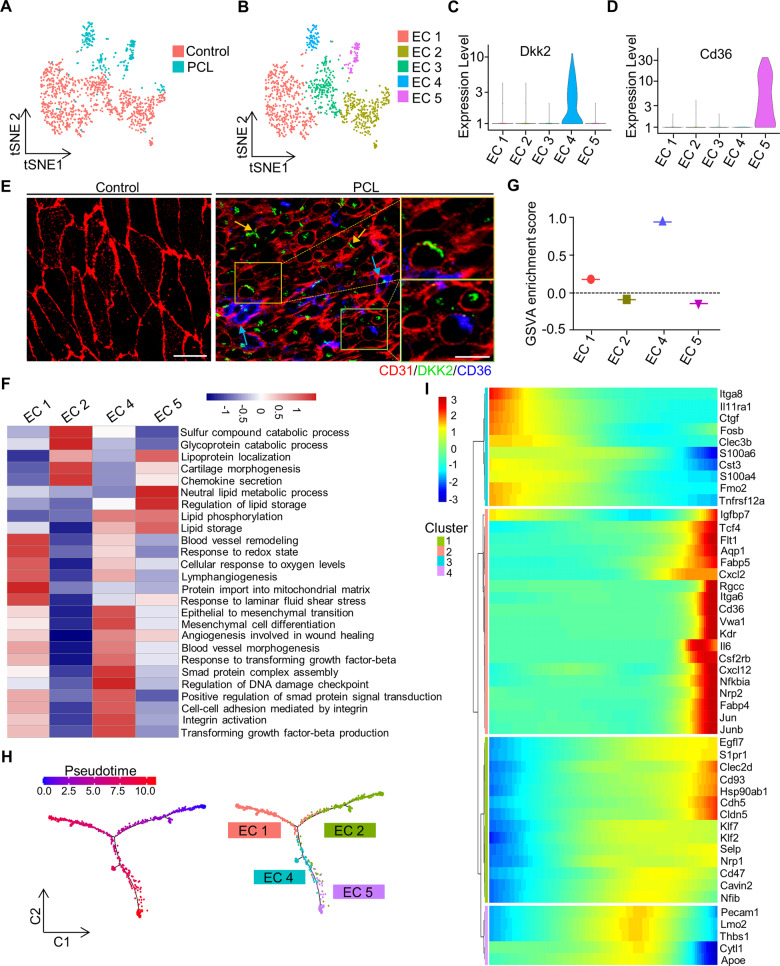
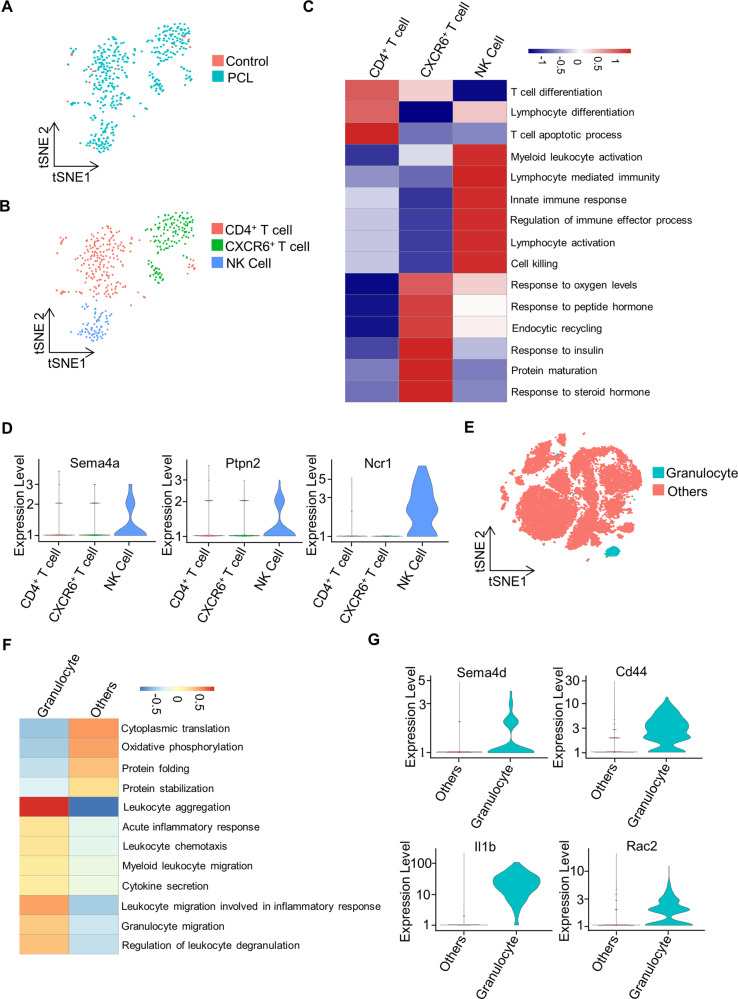
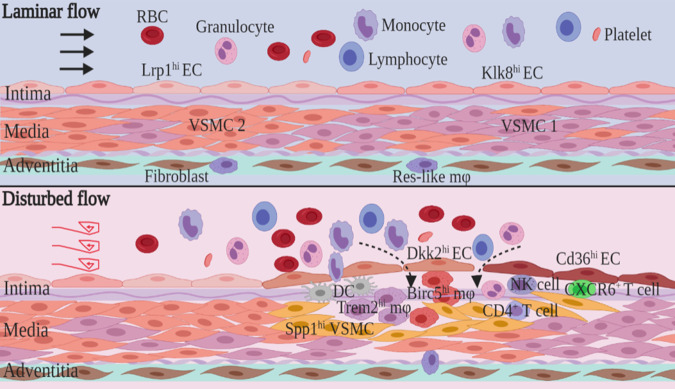
Disturbed blood flow (d-flow) has been known to induce changes of the cells in the arterial wall, increasing the risk of atherosclerosis. However, the heterogeneity of the vascular cell populations under d-flow remains less understood. To generate d-flow in vivo, partial carotid artery ligation (PCL) was performed. Seven days after ligation, single-cell RNA sequencing of nine left carotid arteries (LCA) from the PCL group (10,262 cells) or control group (14,580 cells) was applied and a single-cell atlas of gene expression was constructed. The integrated analysis identified 15 distinct carotid cell clusters, including 10 d-flow-relevant subpopulations. Among endothelial cells, at least four subpopulations were identified, including Klk8hi ECs, Lrp1hi ECs, Dkk2hi ECs, and Cd36hi ECs. Analysis of GSVA and single-cell trajectories indicated that the previously undescribed Dkk2hi ECs subpopulation was mechanosensitive and potentially transformed from Klk8hi ECs under d-flow. D-flow-induced Spp1hi VSMCs subpopulation that appeared to be endowed with osteoblast differentiation, suggesting a role in arterial stiffness. Among the infiltrating cell subpopulations, Trem2hi Mφ, Birc5hi Mφ, DCs, CD4+ T cells, CXCR6+ T cells, NK cells, and granulocytes were identified under d-flow. Of note, the novel Birc5hi Mφ was identified as a potential contributor to the accumulation of macrophages in atherosclerosis. Finally, Dkk2hi ECs, and Cd36hi ECs were also found in the proatherosclerotic area of the aorta where the d-flow occurs. In conclusion, we presented a comprehensive single-cell atlas of all cells in the carotid artery under d-flow, identified previously unrecognized cell subpopulations and their gene expression signatures, and suggested their specialized functions.


Conflict of interest statement

The authors declare no competing interests.

Figures

Fig. 1
Fig. 1. Single-cell RNA-sequencing (scRNA-seq) atlas of left carotid artery cell types.
A Schematic overview of experimental design. B t-distributed stochastic neighbor embedding (t-SNE) represents the aligned gene expression data in single cells extracted from the left carotid artery of wild-type mice 7 days after partial carotid ligation (PCL) surgery or without PCL (control). C t-SNE representation of single-cell gene expression shows the identified major left carotid artery cell types. D The top markers defining each type of cell cluster in C are listed. The size of each circle represents the proportion of cells within the group expressing each transcript. The blue color dots indicated highly expressed genes, while gray color dots correspond to low expressed genes. E The heatmap showing the 10 most upregulated genes in each cluster defined. ECA external carotid artery, ICA internal carotid artery, OA: occipital artery, STA superior thyroid artery, LCA left carotid artery, AA aortic arch, EC endothelial cells, VSMC vascular smooth muscle cells, fibro fibroblasts, Mφ/DC macrophages and dendritic cells.
Fig. 2
Fig. 2. Identification of endothelial cell clusters under disturbed blood flow.
A t-distributed stochastic neighbor embedding (t-SNE) plot of EC subpopulations from the left carotid artery of wild-type mice 7 days after partial carotid ligation (PCL) or without PCL (control). B t-SNE plot of five distinct EC clusters from the PCL and control. C The violin plots of Dkk2 (an EC 4-associated marker) expression in all five EC clusters. D The violin plots of Cd36 (an EC 5-associated marker) expression in all five EC clusters. E Representative en face immunostaining images for CD36 and DKK2 in the left carotid artery with partial carotid ligation (right) or without PCL (control) (left) (red: CD31; green: DKK2; blue: CD36). bar = 20 µm. The magnified image was shown on the right, where the arrows indicated the co-localization of the related proteins. bar = 10 µm. F The heatmap showing the differences in biological processes by GSVA enrichment scores among the different EC clusters. G GSVA enrichment scores by using upregulated gene set (Fosl2, Ctgf, Ctps, Lmo4, Angpt2, Icam1, Bmp4, and Sema7a) under d-flow. H Branched pseudotime trajectory, each cell being colored by its pseudotime value (left) and its seurat clusters (right). I The heatmap showing variable genes along the pseudotime trajectory. The X-axis represents cells ordered by the pseudotime (from left to right) and different colors correspond to the scaled expression of each gene in each cell (from Monocle).
Fig. 3
Fig. 3. Identification of vascular smooth muscle cell clusters under disturbed blood flow.
A t-distributed stochastic neighbor embedding (t-SNE) representation of aligned gene expression data in each individual cell extracted from the left carotid artery of wild-type mice 7 days after partial carotid ligation (PCL) or without PCL (control). B t-SNE plot of three VSMCs clusters from the PCL and control. C The heatmap showing differences of biological processes among three distinct VSMCs by GSVA. D Branched pseudotime trajectory, each cell being colored by its pseudotime value (left) and its seurat clusters (right). E The heatmap showing variable genes along the pseudotime trajectory. The X-axis represents cells ordered by pseudotime (from left to right) and different colors correspond to the scaled expression of each gene in each cell (from Monocle). F Representative immunofluorescence microscopy images for TSP-1 and CTGF in the carotid artery from wild-type mice with partial carotid ligation (PCL) or control. bar = 50 µm.
Fig. 4
Fig. 4. Distinct macrophage populations and their expression signatures.
A t-distributed stochastic neighbor embedding (t-SNE) plot of macrophages (Mφ)-dendritic cells (DCs) populations from the left carotid artery of wild-type mice 7 days after partial carotid ligation (PCL) or without PCL (control). B t-SNE plot of four Mφ-DCs clusters from the PCL and control. C The heatmap showing 10 most upregulated genes in each defined cluster. D Representative immunofluorescence microscopy images for BIRC5 and TREM2 in the left carotid artery with partial carotid ligation. The left panel is the control group, bar = 50 µm. The middle panel is the merged images either stained with CD68 (green) + BIRC5 (red) (top) or CD68 (green) + TREM2 (red) (bottom). The right panel is the enlarged image of the box in the middle panel. The arrow represents the co-localization of the related proteins. bar = 10 µm. E The heatmap of GSVA enrichment scores in biological processes among four distinct populations. F Cell-cycle analysis. Mφ/DCs were evaluated by calculating cell-cycle phase scores based on the canonical markers. G The violin plot of Ki67 expression in all four clusters. H Branched pseudotime trajectory, each cell population being colored by its pseudotime value (left) and its seurat clusters (right).
Fig. 5
Fig. 5. The infiltration of lymphocytes and granulocytes in carotid artery.
A T-Distributed Stochastic Neighbor Embedding (t-SNE) plot of lymphocyte subpopulations from the left carotid artery of wild-type mice 7 days after partial carotid ligation (PCL) or without PCL (control). B t-SNE plot of three lymphocyte clusters from LCA with PCL or control, including CD4+ T cells, CXCR6+ T cells, and NK cells. C The heatmap showing differences of biological processes among three distinct lymphocyte populations by GSVA. D The violin plots of the expression of Sema4a, Ptpn2, or Ncr1 in CD4+ T cells, CXCR6+ T cells, or NK cells. E t-SNE plot of populations of granulocyte and others. F The heatmap showing the biological processes of granulocyte population compared to others (without scaled). G The violin plots represent the expression of Sema4d, Cd44, Il1b, or Rac2 in granulocyte.
Fig. 6
Fig. 6. Detection of Dkk2hi ECs and Cd36hi ECs in mouse aorta.
A Representative en face immunostaining images for DKK2 in the aortic arch (AA) and the descending aorta (DA) of wild-type mice (blue: DAPI; red: CD31; green: DKK2). LC indicates lesser curvatures of the aortic arch. bar = 400 µm. B Representative en face immunostaining images for CD36 in the aortic arch (AA) and the descending aorta (DA) of wild-type mice (blue: DAPI; red: CD31; green: CD36), bar = 400 µm. C–E The DKK2 and CD36 protein expression in the greater (GC) and lesser (LC) curvatures of wild-type mice aortic arch was analyzed by Western blotting, normalized to β-actin. Data are mean ± SD. F-I Representative immunofluorescence microscopy images and its statistical analysis for DKK2 or CD36 in the aortic arch of ApoE−/− mice on a high-fat diet (9 weeks), bar = 100 µm. The magnified image was shown on the right, bar = 20 µm.
Fig. 7
Fig. 7. A proposed model for the cellular heterogeneity of mouse carotid artery under d-flow.
In normal carotid arteries that blood flow was laminar and parallel to the blood vessel, endothelial cell subpopulations were Klk8hi ECs and Lrp1hi ECs, while smooth muscle cells were VSMC1 and VSMC2 clusters. When exposed to d-flow, the heterogeneity of vascular wall cells was changed compared with normal carotid arteries. New subpopulations, such as Dkk2hi ECs, Cd36hi ECs, and Spp1hi VSMCs, were emerged. Among the infiltrating cell subpopulations, Trem2hi Mφ, Birc5hi Mφ, DCs, CD4+ T cells, CXCR6+ T cells, NK cells, and granulocytes were identified under d-flow.

References

    1. Feaver RE, Gelfand BD, Blackman BR. Human haemodynamic frequency harmonics regulate the inflammatory phenotype of vascular endothelial cells. Nat Commun. 2013;4:1525. doi: 10.1038/ncomms2530. - DOI - PMC - PubMed
    1. Hu S, Liu Y, You T, Heath J, Xu L, Zheng X, et al. Vascular semaphorin 7A upregulation by disturbed flow promotes atherosclerosis through endothelial beta1 integrin. Arterioscler Thromb Vasc Biol. 2018;38:335–43. doi: 10.1161/ATVBAHA.117.310491. - DOI - PMC - PubMed
    1. Heo KS, Lee H, Nigro P, Thomas T, Le NT, Chang E, et al. PKCzeta mediates disturbed flow-induced endothelial apoptosis via p53 SUMOylation. J Cell Biol. 2011;193:867–84. doi: 10.1083/jcb.201010051. - DOI - PMC - PubMed
    1. Hong L, Li F, Tang C, Li L, Sun L, Li X, et al. Semaphorin 7A promotes endothelial to mesenchymal transition through ATF3 mediated TGF-beta2/Smad signaling. Cell Death Dis. 2020;11:695. doi: 10.1038/s41419-020-02818-x. - DOI - PMC - PubMed
    1. Fernandez Esmerats J, Villa-Roel N, Kumar S, Gu L, Salim MT, Ohh M, et al. Disturbed flow increases UBE2C (Ubiquitin E2 Ligase C) via loss of miR-483-3p, inducing aortic valve calcification by the pVHL (von Hippel-Lindau protein) and HIF-1alpha (hypoxia-inducible factor-1alpha) pathway in endothelial cells. Arterioscler Thromb Vasc Biol. 2019;39:467–81. doi: 10.1161/ATVBAHA.118.312233. - DOI - PMC - PubMed