. 2021 Jul 19;12(1):4383.
doi: 10.1038/s41467-021-24622-7.

SARS-CoV-2 antibody dynamics and transmission from community-wide serological testing in the Italian municipality of Vo'

Affiliations

SARS-CoV-2 antibody dynamics and transmission from community-wide serological testing in the Italian municipality of Vo'

Ilaria Dorigatti et al. Nat Commun. .

Erratum in

  • Author Correction: SARS-CoV-2 antibody dynamics and transmission from community-wide serological testing in the Italian municipality of Vo'.
    Dorigatti I, Lavezzo E, Manuto L, Ciavarella C, Pacenti M, Boldrin C, Cattai M, Saluzzo F, Franchin E, Del Vecchio C, Caldart F, Castelli G, Nicoletti M, Nieddu E, Salvadoretti E, Labella B, Fava L, Guglielmo S, Fascina M, Grazioli M, Alvisi G, Vanuzzo MC, Zupo T, Calandrin R, Lisi V, Rossi L, Castagliuolo I, Merigliano S, Unwin HJT, Plebani M, Padoan A, Brazzale AR, Toppo S, Ferguson NM, Donnelly CA, Crisanti A. Dorigatti I, et al. Nat Commun. 2021 Aug 12;12(1):5020. doi: 10.1038/s41467-021-25321-z. Nat Commun. 2021. PMID: 34385465 Free PMC article. No abstract available.

Abstract

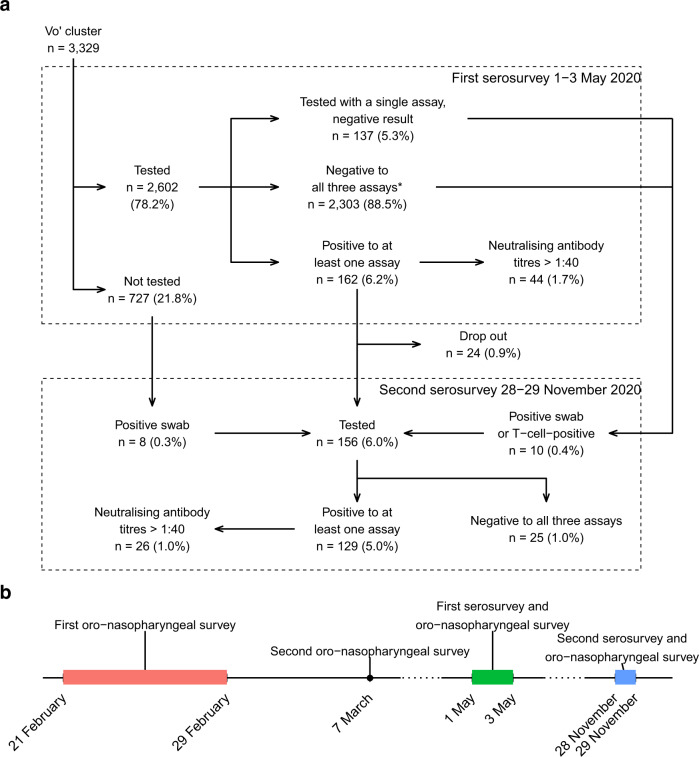
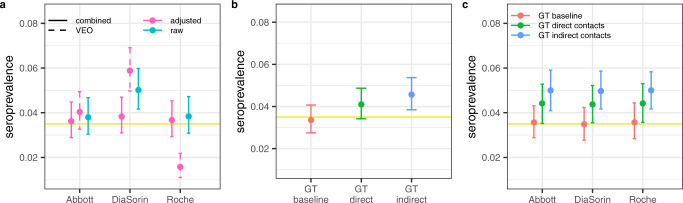
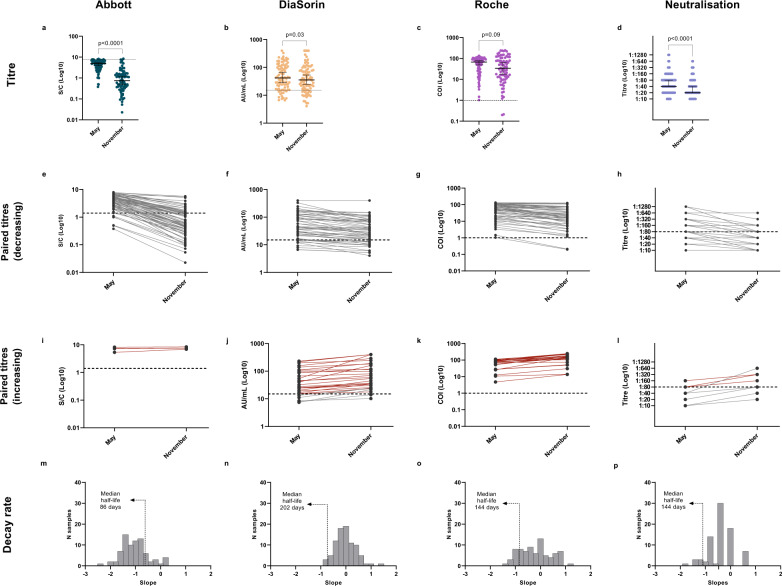
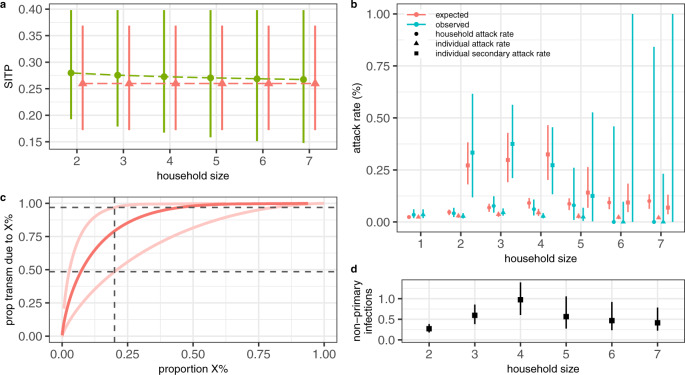
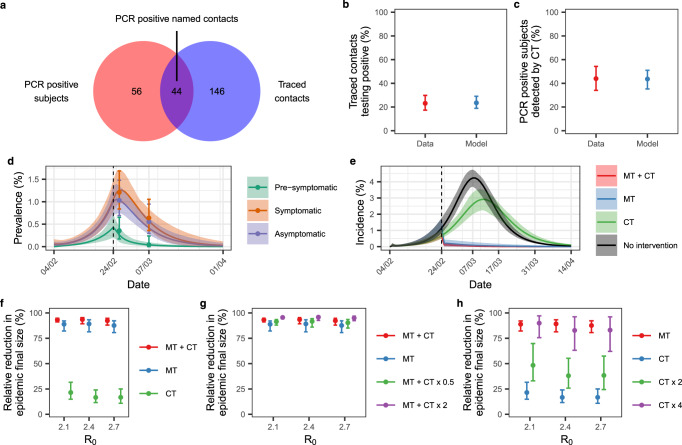
In February and March 2020, two mass swab testing campaigns were conducted in Vo', Italy. In May 2020, we tested 86% of the Vo' population with three immuno-assays detecting antibodies against the spike and nucleocapsid antigens, a neutralisation assay and Polymerase Chain Reaction (PCR). Subjects testing positive to PCR in February/March or a serological assay in May were tested again in November. Here we report on the results of the analysis of the May and November surveys. We estimate a seroprevalence of 3.5% (95% Credible Interval (CrI): 2.8-4.3%) in May. In November, 98.8% (95% Confidence Interval (CI): 93.7-100.0%) of sera which tested positive in May still reacted against at least one antigen; 18.6% (95% CI: 11.0-28.5%) showed an increase of antibody or neutralisation reactivity from May. Analysis of the serostatus of the members of 1,118 households indicates a 26.0% (95% CrI: 17.2-36.9%) Susceptible-Infectious Transmission Probability. Contact tracing had limited impact on epidemic suppression.


Conflict of interest statement

The authors declare no competing interests.

Figures

Fig. 1
Fig. 1. Study description.
a Flow chart illustrating the study design and the stratification according to test results rates on the occasion of the serosurveys conducted in Vo’ on 1–3 May 2020 and 28–29 November 2020. b Timeline of the surveys conducted in the study area since the start of the SARS-CoV-2 epidemic in Vo’.
Fig. 2
Fig. 2. Seroprevalence estimates in Vo’ in May 2020.
a Assay-specific seroprevalence estimates: the raw seroprevalence estimates (cyan) represent the proportion of subjects testing positive; adjusted seroprevalence estimates (pink) are the raw seroprevalence estimates adjusted for the estimated assay-specific sensitivity and specificity (Table 3) from the validation experiments only (VEO) (dashed) and the results of the combined analysis of validation experiments and serosurvey results (solid); b Estimated seroprevalence in May 2020 using the three ground truth definitions: baseline (red), direct contacts (green) and indirect contacts (blue). c Assay-specific seroprevalence estimates adjusted for the sensitivity and specificity of three ground truth (GT) definitions (Supplementary Table 3). In each panel, the horizontal solid yellow line represents the mean seroprevalence estimate obtained from the multinomial likelihood model; the horizontal yellow shading represents the 95% CrI. Points represent the mean, the error bar identifies the 95% CrI. The results were obtained by sampling n = 1,000 realisations from the posterior distribution of the parameters.
Fig. 3
Fig. 3. Antibody titres and dynamics at nine-month post-infection follow up.
ad Observed antibody titres among subjects testing positive in May and re-tested in November by Abbott (n = 78), DiaSorin (n = 86), Roche (n = 78), and micro-neutralisation assays (84), respectively (two-sided Wilcoxon signed-rank test). Only subjects belonging to the baseline ground truth definition have been included. The horizontal line represents the median, the vertical line represents the 95% confidence intervals. el Antibody dynamics of individual subjects testing positive between May and November, by Abbott, DiaSorin, Roche, and micro-neutralisation. 88.9% (64 out of 72, 95% CI 79.3–95.1%), 20.5% (15 out of 73, 95% CI 12.0–31.6%), and 35.9% (28 out of 78, 95% CI 25.3–47.6%) of individuals showed a reduction of antibody titre of 50% or more by November when tested with Abbott, DiaSorin, and Roche, respectively, whereas 34.7% (25 out of 72, 95% CI 23.9–46.9%), 89.0% (65 out of 73, 95% CI 79.5–95.1%), and 97.4% (76 out of 78, 95% CI 91.0–99.7%) of subjects were still positive in November. For the micro-neutralisation assay, 41.0% (16 out of 39, 95% CI 25.6–57.9%) of subjects had their neutralising titres decreased by at least two dilution factors by November, and 46.1% (18 out of 39, 95% CI 30.1–62.8%) who had a titre greater than 1:40 (1/dil) in May still preserved that level by November. Subjects with an increasing trend between the two timepoints are shown separately in panels (il), where red lines highlight individuals who tested positive in May and showed an increase in their antibody titres by November (38 subjects in total, 1 for Abbott, 24 for DiaSorin, 23 for Roche, and 4 for micro-neutralisation). mp Distribution of the estimated antibody decay rates. Among the subjects with a positive serological test result in May and excluding the subjects with a doubling antibody titre between May and November, we estimated a median half-life of 86 (95% CI 73–94) days, 202 (95% CI 140–270) days, 144 (95% CI 114–217) days, and 144 days (95% CI 117–178) for the antibodies detected by the Abbott, DiaSorin, Roche, and micro-neutralisation assays, respectively.
Fig. 4
Fig. 4. Association between antibody titres and antibody decay rate with age group and BMI category.
Antibody titre distribution by age group (ac) and by BMI (df) and the estimated antibody decay rate distribution by age group (gi) according to Abbott, DiaSorin, and Roche assays, respectively. In all panels, bold is the median, box is the interquartile range, whiskers define the range having removed the outliers; outliers are defined as observations further from 1.5 times the interquartile range. The association analysis was conducted on the subjects identified as exposed to SARS-CoV-2 according to the baseline ground truth definition. The numbers at the bottom of each panel represent the number of subjects in each category.
Fig. 5
Fig. 5. Within-household SARS-CoV-2 transmission estimates.
a Mean (points) and 95% CrI (lines) of the Susceptible-Infectious Transmission Probability (SITP) estimates by household size obtained with model V (red) and PV (green). b Mean (points) and 95% CI (lines) of the observed household, individual-level and secondary attack rates compared to the mean and 95% CrI of the estimated attack rates obtained with model V. c Median (dark) and 95% CrI (light) proportion of transmission (y-axis) attributable to the most infectious proportion of infections (x-axis) obtained with model V; homogeneity in transmission would result in y = x. d Mean (points) and 95% CrI (lines) of the estimated number of non-primary infections by household size obtained with model V. In all panels, the results were obtained by sampling n = 1,000 realisations from the posterior distribution of the model parameters.
Fig. 6
Fig. 6. Impact of contract tracing on the epidemic dynamics.
a PCR-positive subjects identified by mass testing (red) in comparison to all subjects contacted by contact tracing (blue) and the positive traced individuals (intersection). b Observed (red, mean 95% exact binomial CI) and estimated (blue, mean and 95% CrI) proportion of traced contacts testing positive by PCR (c) and proportion of PCR positive subjects detected by contact tracing. d Observed and estimated SARS-CoV-2 prevalence. The points represent the observed prevalence data, with the 95% exact binomial CI. The solid lines represent the mean, and the shading represents the 95% credible interval. e Simulated incidence of SARS-CoV-2 infection assuming the following interventions: mass testing, lockdown, and contact tracing (MT + CT, red); mass testing and lockdown (MT, blue); contact tracing (CT, green). The unmitigated (no intervention) epidemic is shown in black. The dark lines represent the mean, shading represents the 95% credible interval. In d and e, the vertical dashed line represents the time interventions were implemented. f Relative reduction in the epidemic final size compared to the unmitigated epidemic obtained assuming the same interventions of e. g Relative reduction in the epidemic final size compared to the unmitigated epidemic obtained assuming the implementation of mass testing, lockdown and contact tracing (MT + CT, red), mass testing and lockdown (MT, blue), mass testing, lockdown and half the estimated rate of contact tracing (MT + CT x 0.5) and mass testing, lockdown and double the estimated rate of contact tracing (MT + CT x 2). g Relative reduction in the epidemic final size compared to the unmitigated epidemic obtained assuming the implementation of mass testing and lockdown (MT), contact tracing (CT), contact tracing with double the estimated tracing rates (CT x 2) and contact tracing with four times the estimated tracing rates (CT x 4). In f, g, and h points represent the mean and bars the 95% CrI. All estimates were obtained using 100 samples from the posterior distribution of the parameters. be show the results obtained with R0 = 2.4.

References

    1. World Health Organization, WHO Coronavirus Disease (COVID-19) Dashboard. Available at https://covid19.who.int/. (Accessed 23 February 2021).
    1. European Centre for Disease Control and Prevention. COVID-19 situation update for the EU/EEA as of week 6, updated 18 February 2021. Available at https://www.ecdc.europa.eu/en/cases-2019-ncov-eueea. (Accessed 23 February 2021).
    1. EpidemicForecasting.org, Epidemic forecasting global NPI database (2020). Available at http://epidemicforecasting.org/datasets. (Accessed 23 February 2021).
    1. Hale, T. et al. Oxford COVID-19 Government Response Tracker, Blavatnik School of Government (2020). Available at www.bsg.ox.ac.uk/research/research-projects/coronavirus-government-respo.... (Accessed 23 February 2021).
    1. European Centres for Disease Control. Data on Country Response measures to COVID-19. Available at https://www.ecdc.europa.eu/en/publications-data/download-data-response-m.... (Accessed 23 February 2021).

Publication types