. 2021 Jul 19;12(1):4389.
doi: 10.1038/s41467-021-24384-2.

Specificities of exosome versus small ectosome secretion revealed by live intracellular tracking of CD63 and CD9

Affiliations

Specificities of exosome versus small ectosome secretion revealed by live intracellular tracking of CD63 and CD9

Mathilde Mathieu et al. Nat Commun. .

Abstract

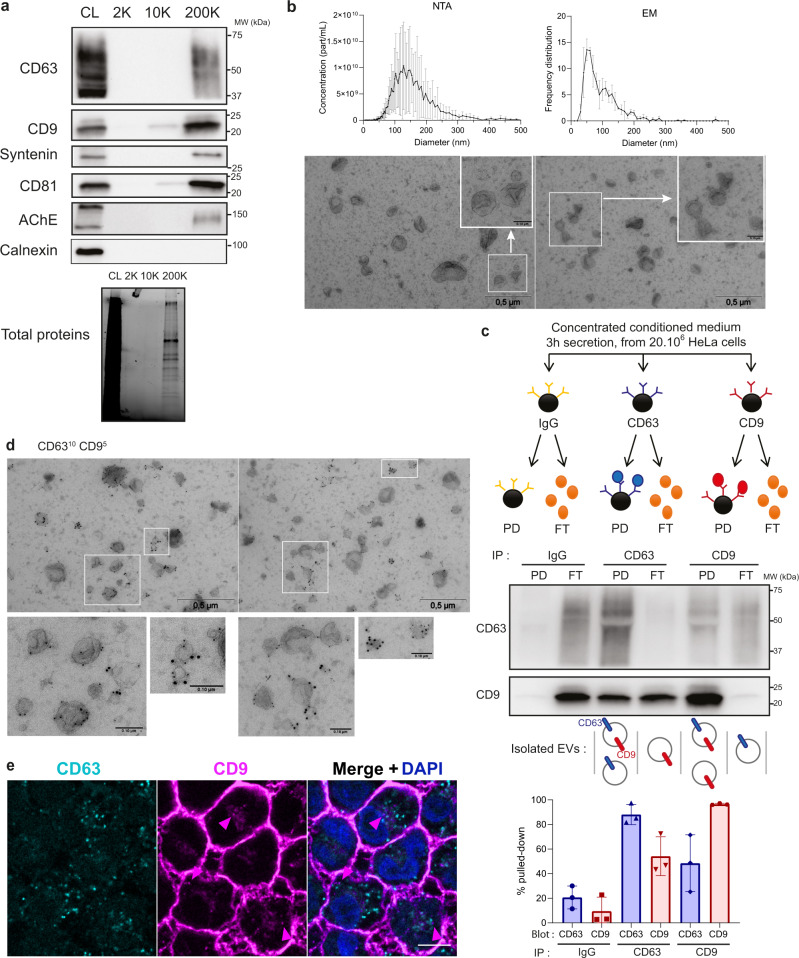
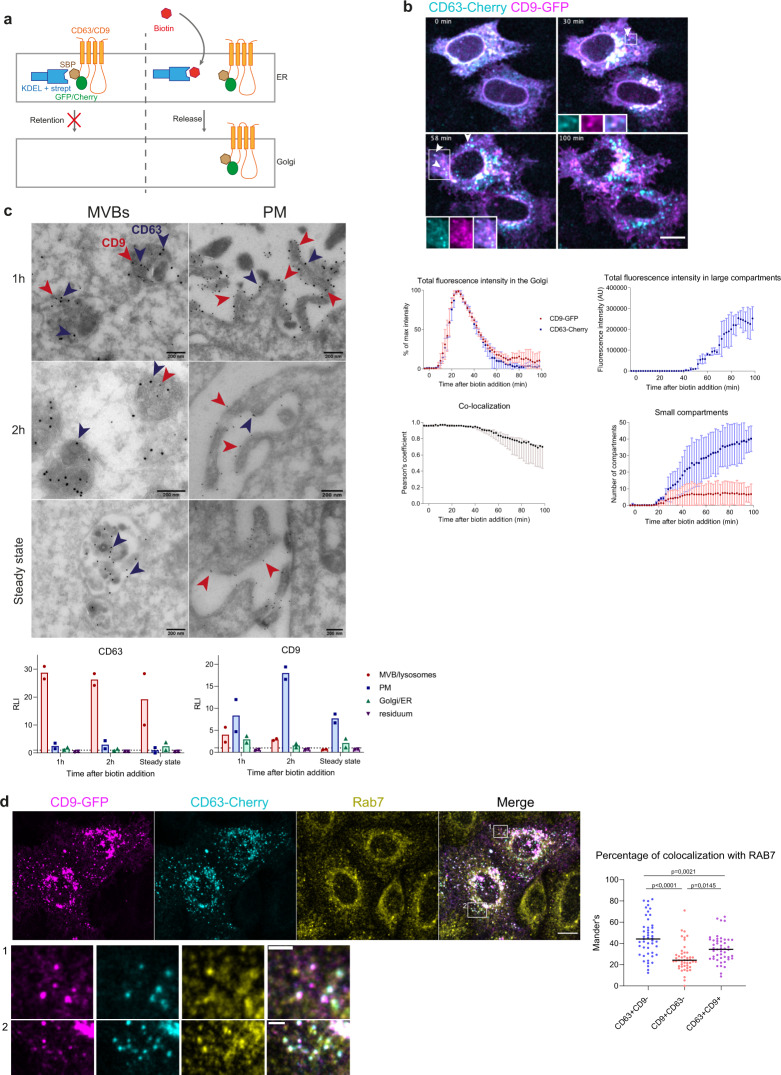
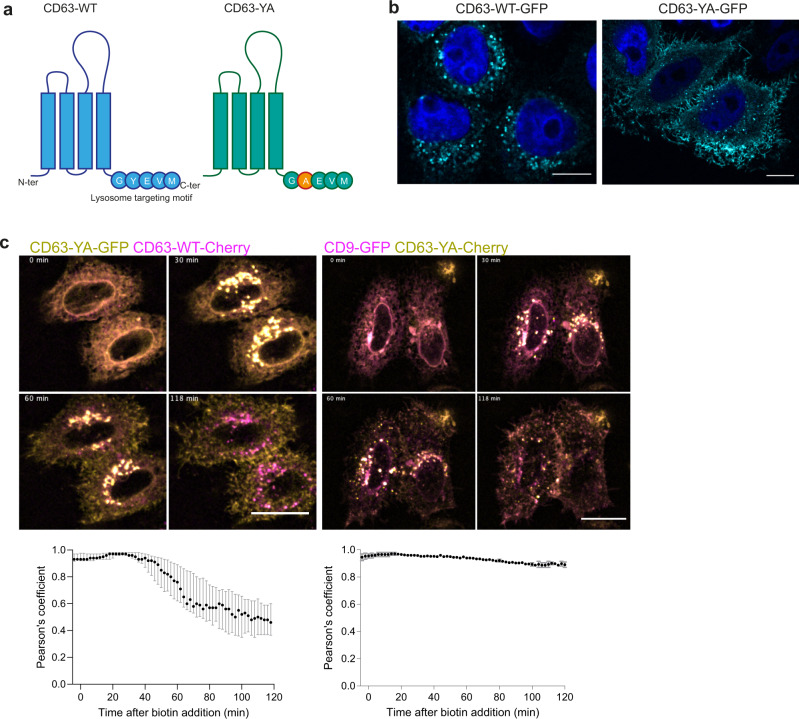
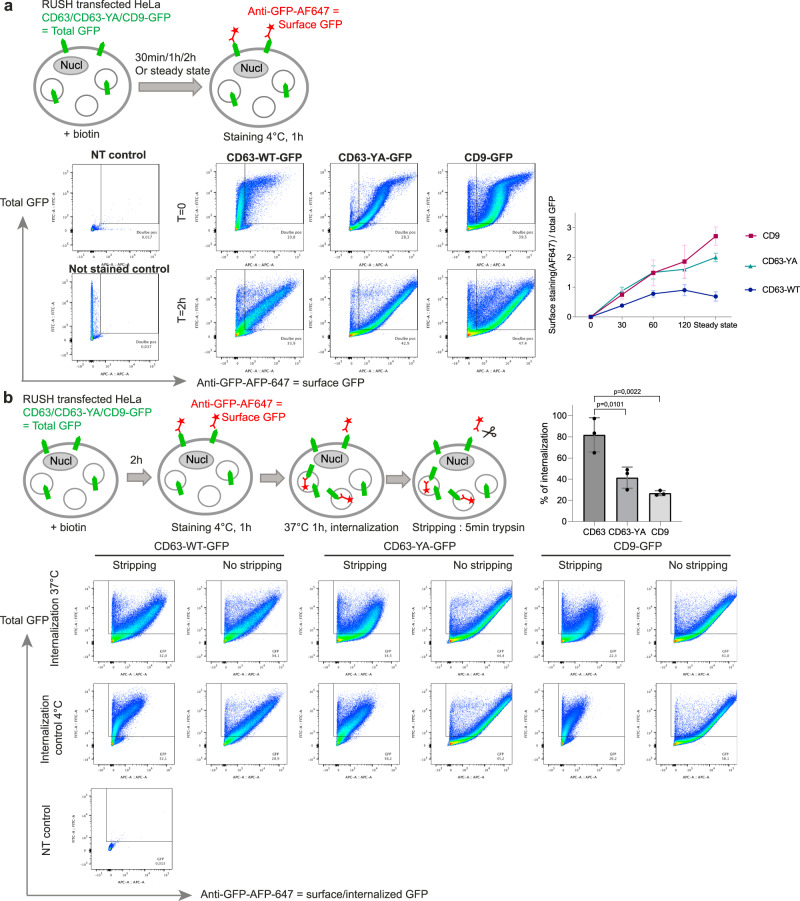
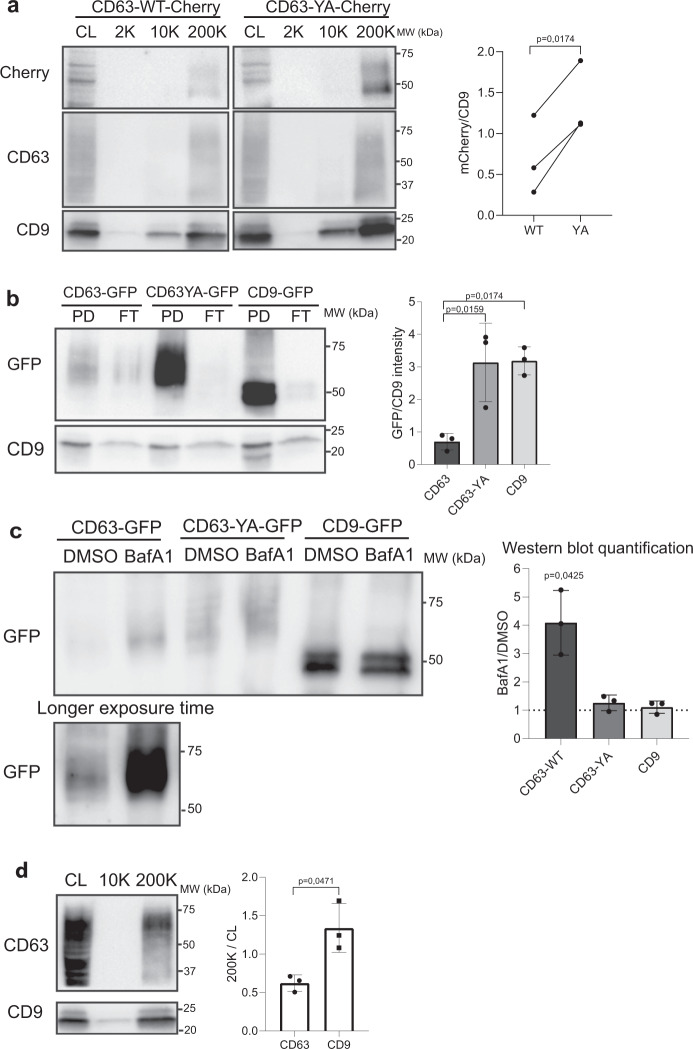
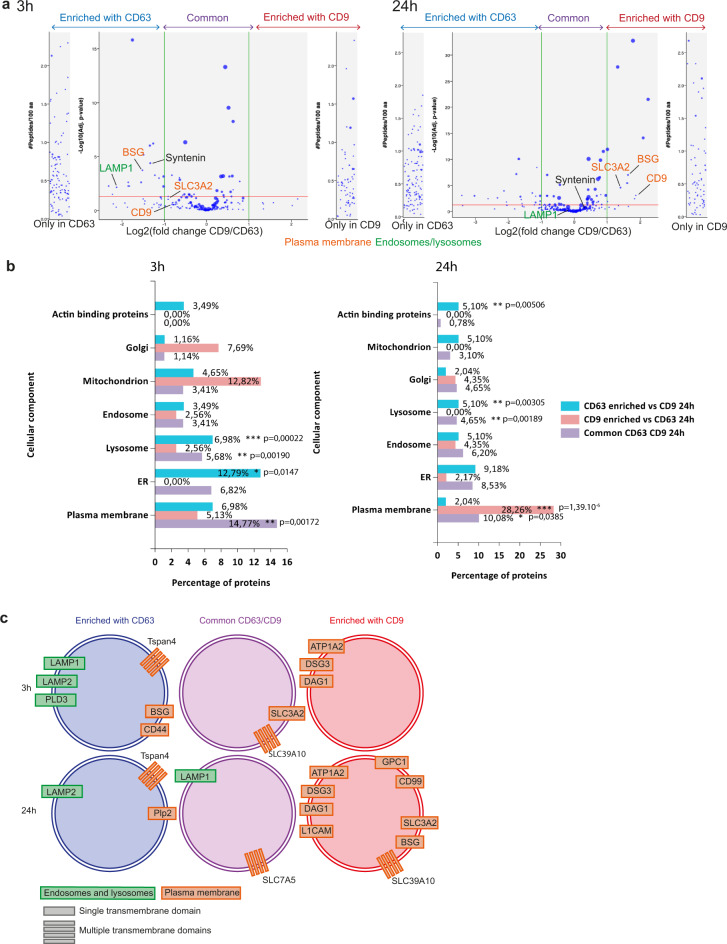
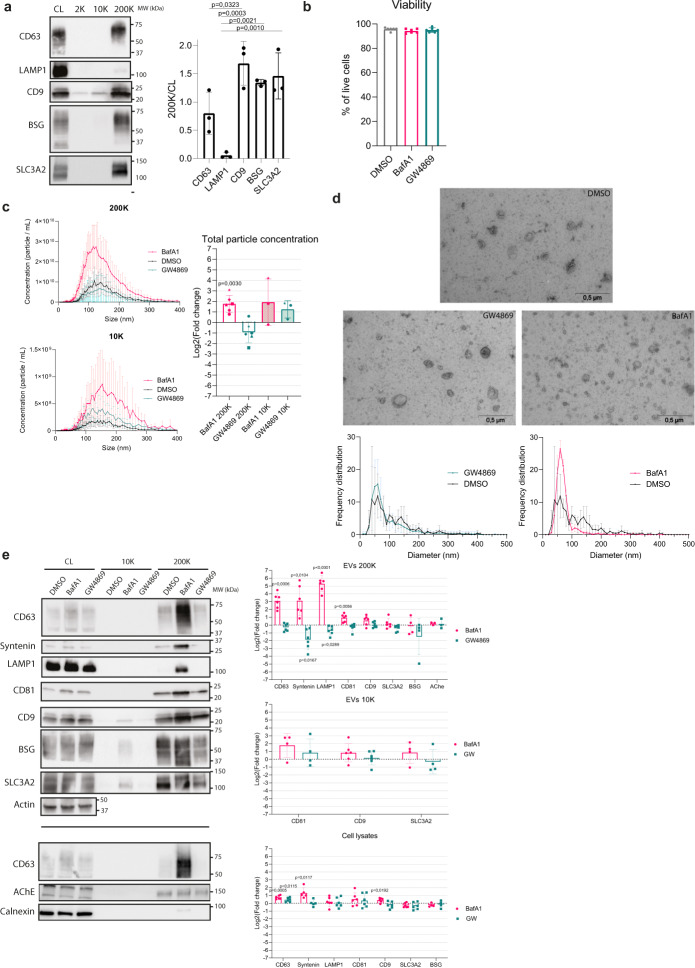
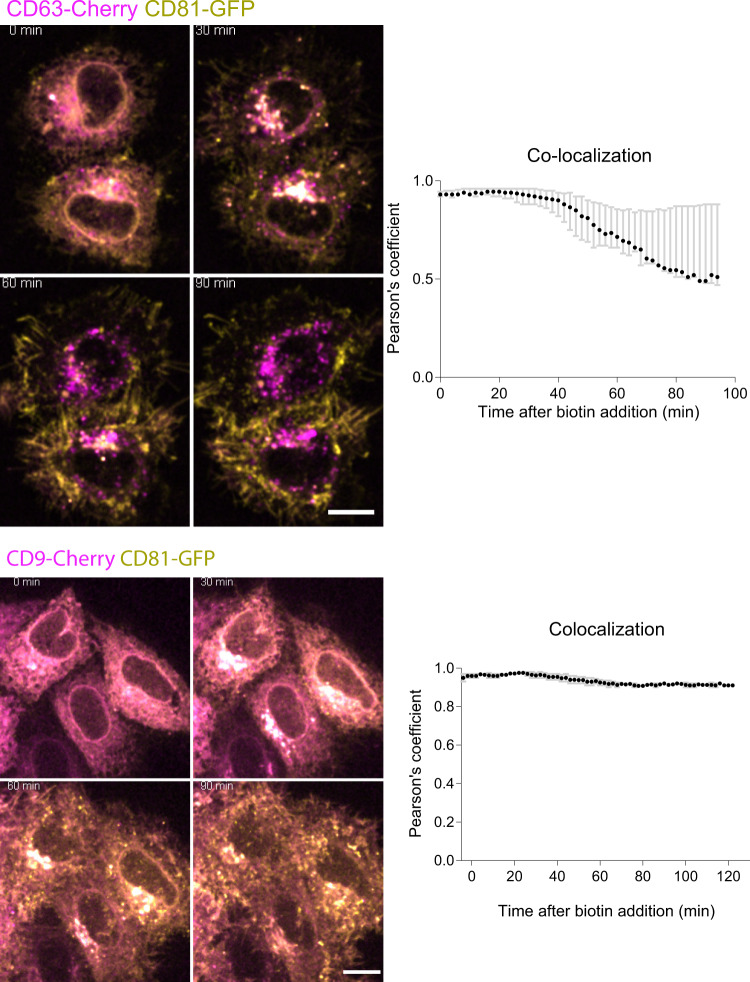
Despite their roles in intercellular communications, the different populations of extracellular vesicles (EVs) and their secretion mechanisms are not fully characterized: how and to what extent EVs form as intraluminal vesicles of endocytic compartments (exosomes), or at the plasma membrane (PM) (ectosomes) remains unclear. Here we follow intracellular trafficking of the EV markers CD9 and CD63 from the endoplasmic reticulum to their residency compartment, respectively PM and late endosomes. We observe transient co-localization at both places, before they finally segregate. CD9 and a mutant CD63 stabilized at the PM are more abundantly released in EVs than CD63. Thus, in HeLa cells, ectosomes are more prominent than exosomes. By comparative proteomic analysis and differential response to neutralization of endosomal pH, we identify a few surface proteins likely specific of either exosomes (LAMP1) or ectosomes (BSG, SLC3A2). Our work sets the path for molecular and functional discrimination of exosomes and small ectosomes in any cell type.


Conflict of interest statement

The authors declare no competing interests.

Figures

Fig. 1
Fig. 1. CD63 and CD9 are found on two different and one common EV populations.
a Western blot showing transmembrane proteins (CD9, CD63, and CD81), a cytosolic protein (syntenin-1) and two “negative” controls (AChE and calnexin) in cell lysates (CL) and the pellets obtained from HeLa 24 h conditioned medium after differential ultracentrifugation (2 K, 10 K, 200 K). The loaded material comes from 20 × 106 cells for the centrifugation pellets, and from 0.2 × 106 cells for the cell lysate. Representative of 3 independent experiments. b NTA and EM analysis of 200 K pellets obtained from HeLa 24 h conditioned medium. The quantifications represent the mean of concentration or frequency of EVs of different diameters, error bars show the standard deviation (SD). N = 3 independent experiments. Scale bar of the zooms: 0.1 μm. c Principle of immunoprecipitation of CD63 and CD9 EVs in HeLa concentrated conditioned medium and representative Western blot of the pull-down (PD) and flow-through (FT) of the immunoprecipitation, with quantification of the relative CD63 and CD9 bands intensity of three independent experiments (mean ± SD is represented). d Immuno-EM analysis of the 200 K pellet labeled with anti-CD9 (5 nm gold particles) and anti-CD63 (10 nm gold particles) antibodies. This experiment was performed once. Scale bar of the zooms: 0.1 μm. e Confocal imaging of immunofluorescence staining of CD63 and CD9 in HeLa cells. Pink arrows show CD9 localized in intracellular compartments. Representative picture of two independent experiments. Scale bar: 5 μm.
Fig. 2
Fig. 2. CD63 and CD9 transiently co-localize in multivesicular bodies and at the plasma membrane.
a Principle of the RUSH system used to follow CD63 and CD9 intracellular trafficking. SBP streptavidin binding peptide, strept streptavidin, ER endoplasmic reticulum. b Micrographs and quantifications of live imaging of HeLa cells co-transfected with the CD63-mCherry and CD9-eGFP RUSH plasmids. Biotin at 40 μM was added at T = 0. White arrows show peripheral compartments where CD63 and CD9 co-localize. Z-projection of 11 planes. Scale bar: 5 μm. Quantification upon time of three independent experiments showing the mean ± SD eGFP and mCherry fluorescence intensity in the Golgi and in large compartments, the mean ± SD number of eGFP- or mCherry-positive small compartments and the median and range of the Pearson’s co-localization coefficient between eGFP and mCherry where automatically quantified. N = 3 independent experiments. 5 fields per experiments where imaged, for a total of at least 10 individual cells to analyze per experiment. c Representative electron microscopy images of HeLa cells co-transfected with RUSH constructs of CD63-mCherry and CD9-eGFP, 1 h or 2 h after incubation with biotin, or at steady-state, labeled with anti-eGFP gold 10 nm (red arrows) and anti-mCherry gold 15 nm (blue arrows). Relative labeling index (RLI) in each compartment quantified from 7 different fields per replicate is represented as mean (n = 2 independent biological replicates). d Confocal microscopy pictures of HeLa cells (z-projection) co-transfected with CD63-mCherry- and CD9-eGFP-RUSH plasmids, and stained with anti-Rab7 after 1 h of incubation with biotin. Scale bar: 10 μm. Mander’s coefficients representing the % of CD9 + /CD63-, CD9-/CD63 + , and CD9 + /CD63 + intracellular compartments also positive for the Rab7 signal in each cell are shown. Results from two independent experiments are shown, each dot represents one cell (23 cells from replicate 1, and 24 cells from replicate 2) and the median is represented. Ordinary one-way ANOVA with a Tukey’s multiple comparisons test was performed to compare the different categories of intracellular compartments shown on the graph.
Fig. 3
Fig. 3. The mutant CD63-YA displays different trafficking from CD63-WT and similar trafficking as CD9.
a Scheme of the structure and C-terminal sequences of CD63-WT and the mutant CD63-YA. b Immunofluorescence of HeLa cells transfected with the RUSH CD63-eGFP or CD63-YA-eGFP plasmids at steady state. Scale bar 10 μm. This experiment was performed once. c Micrographs of HeLa cells co-transfected with CD63-YA-eGFP and CD63-WT-mCherry or CD9-eGFP and CD63-YA-mCherry, and median ± range of the Pearson’s co-localization coefficient over time between eGFP and mCherry. Biotin was added at T = 0. Z-projection of 11 planes. Scale bar 5 μm. CD63/CD63-YA: 3 independent experiments n = 51 cells, CD9/CD63-YA: 2 independent experiments n = 33 cells. 5 fields per experiment where imaged, for a total of at least 10 individual cells to analyze per experiment.
Fig. 4
Fig. 4. Dynamics of localization at the plasma membrane and of internalization of CD63 are different from those of CD63-YA and CD9.
a Principle and flow cytometry analysis of anti-GFP surface staining of HeLa cells transfected with the RUSH constructs CD63-WT-eGFP, CD63-YA-eGFP, or CD9-eGFP after different incubation times with biotin followed by fixation. The ratio of the surface staining (AF647) over the total GFP signal mean fluorescence intensities is represented at different time points, time 0 subtracted, mean ± SD for 3 independent experiments. b Principle and flow cytometry analysis of anti-GFP uptake after surface staining of HeLa cells transfected with the RUSH constructs CD63-WT-eGFP, CD63-YA-eGFP, or CD9-eGFP after 2 h of incubation with biotin. The mean percentage ± SD of internalized anti-GFP-AFP647 is represented for 3 independent experiments. Ordinary one-way ANOVA, Tukey’s multiple comparisons test. Gating strategy is illustrated in Supplementary Fig. 4.
Fig. 5
Fig. 5. CD63-WT is less efficiently released in EVs than CD9 and CD63-YA.
a Western blot of the cell lysate (CL) and of the different EV pellets obtained by differential ultracentrifugation of CCM from HeLa cells transfected with the RUSH plasmids CD63-WT-eGFP or CD63-YA-mCherry (24 h release with biotin). EVs from 20 × 106 cells and CL from 0.2 × 106 cells were loaded. The intensity of the band corresponding to the mCherry fusion proteins was quantified and normalized by the intensity of the CD9 band in 3 independent experiments, the mean ± SD is represented. Two-tailed paired t test. b Representative Western blot of the pull-down (PD) and flow-through (FT) of the immunoprecipitation of EVs from HeLa cells transfected with the RUSH plasmids CD63-WT-eGFP, CD63-YA-eGFP, or CD9-eGFP, recovered 24 h after biotin addition. 60 × 108 total particles quantified by NTA were used for each IP. Percent of GFP + cells quantified by flow cytometry were similar in the three conditions (Supplementary Fig. 5a). The GFP bands intensity in the PD normalized to endogenous CD9 in the corresponding PD are represented as mean ± SD for 3 independent experiments. Ordinary one-way ANOVA, Tukey’s multiple comparisons test. c Representative Western blot of EVs (200 K pellets) from HeLa cells transfected with the CD63-WT, CD63-YA, or CD9-eGFP RUSH plasmids treated with DMSO of BafA1 100 nM during 16 h. The same number of EVs between the DMSO and the BafA1 conditions were loaded on the gel (around 100 × 108 particles). The fold change between DMSO and BafA1 treatment for each construct is represented as mean ± SD for 3 independent experiments. Two-tailed one sample t test to compare each condition with a theoretical mean of 1. d Proportion of cellular endogenous CD9 and CD63 released in EVs, as semi-quantified on Western blots. The signal for CD9 and CD63 in 200 K pellets released by 20 × 106 HeLa cells was divided by the signal for the same molecule in the total lysate of 0.2 × 106 cells, run on the same blot. 1 representative Western blot and quantification (mean ± SD) of 3 independent experiments. Two-tailed paired t test.
Fig. 6
Fig. 6. Quantitative proteomic analysis of CD63-eGFP-RUSH and CD9-eGFP-RUSH EVs.
EVs were isolated by anti-GFP immuno-isolation from either non-transfected HeLa cells, or HeLa transfected with CD63-eGFP-RUSH or CD9-eGFP-RUSH, either 3 h or 24 h after biotin addition, and their composition was analyzed by mass-spectrometry. a Volcano plots representing quantified proteins with at least 2 peptides in 2 replicates in at least one condition. Shown are the fold changes of peptide abundancy between CD63- and CD9-eGFP expressing EV samples and the p-value of this quantification, for EVs recovered 3 h (left) or 24 h (right) after biotin addition. Position of the membrane-associated proteins selected for further analysis is indicated. b Results of the FunRich gene enrichment analysis among the proteins either enriched in the CD63- (blue), or CD9-eGFP (red) samples, or common between the CD63 and CD9-eGFP samples (purple) at 3 h or 24 h after biotin addition. For each subcellular compartment protein list, % of proteins of this category in the list of CD63-, CD9-, or common CD63/CD9 proteins is indicated, and the p-value of this percentage being different to its counterpart in the whole HeLa cell database is calculated. P-value (hypergeometric uncorrected). c Schematic representation of the transmembrane proteins identified in the CD63-, CD9-, or CD63/CD9-eGFP EVs at 3 h and 24 h.
Fig. 7
Fig. 7. Different effect of BafA1 and GW4869 on secretion of CD63, CD9, and the novel EV markers.
a Western blot showing CD9, CD63, and CD81, and the new markers LAMP1, BSG, and SLC3A2 in cell lysates (CL) and the pellets obtained from HeLa conditioned media after differential ultracentrifugation (2 K, 10 K, and 200 K). The loaded material comes from 20 × 106 cells for the centrifugation pellets, and from 0.2 × 106 cells for the cell lysate. One representative image. For each marker, mean ± SD of the quantification of the signal in 200 K pellets divided by the signal in the total lysate, run on the same blot, is shown for 3 independent experiments. Ordinary one-way ANOVA, Tukey’s multiple comparisons test. b Viability of HeLa cells at the end of the 16 h medium conditioning period in the presence of DMSO (control) or BafA1 (100 nM) or GW4869 (10 μM) drugs, measured by trypan blue in 6 independent experiments, mean ± SD is represented. No significant difference observed with an ordinary one-way ANOVA, Tukey’s multiple comparisons test. c Nanoparticle tracking analysis (NTA) of EVs obtained by differential ultracentrifugation from equal numbers of HeLa cells treated with DMSO (control), BafA1 or GW4869 during 16 h. The particles concentration according to their size and the fold change of the total particle concentration between treated and control conditions are represented as mean ± SD of 5 (200 K) or 3 (10 K) independent experiments. Two-tailed one sample t test to compare each condition with a theoretical mean of 0. d TEM analysis (1 representative image) and size measurement (in 3 independent experiments) of EVs in 200 K pellets of cells exposed to DMSO, BafA1 or GW4869. Mean ± SD of the frequency distribution of CD63 and CD9 in EVs of different diameters is represented. e Representative Western blot of cell lysates from 0.2 × 106 HeLa cells and EVs from 20 × 106 HeLa cells treated with DMSO, BafA1, or GW4869, corresponding to the samples of bd. The mean fold change ± SD between DMSO and BafA1 or GW4869 treatment of the bands intensity in the 200 K and 10 K pellets divided by the cell lysate is represented for 6 independent experiments. Two-tailed one sample t test to compare each condition with a theoretical mean of 0.
Fig. 8
Fig. 8. Trafficking of RUSH-CD81 compared to RUSH-CD63 and -CD9.
Micrographs of live imaging of HeLa cells co-transfected with either CD63-mCherry or CD9-mCherry and CD81-eGFP RUSH plasmids. Biotin was added at T = 0. The median ± range of the Pearson’s co-localization coefficient between eGFP and mCherry is represented over time after biotin addition. Scale bar: 10 μm. 2 independent experiments. 5 fields per experiment where imaged, for a total of at least 10 cells to analyze per experiment.

References

    1. Cocozza F, Grisard E, Martin-jaular L, Mathieu M, Théry C. SnapShot: extracellular vesicles. Cell. 2020;182:262–262.e1. doi: 10.1016/j.cell.2020.04.054. - DOI - PubMed
    1. Van Niel G, D’Angelo G, Raposo G. Shedding light on the cell biology of extracellular vesicles. Nat. Rev. Mol. Cell Biol. 2018;19:213–228. doi: 10.1038/nrm.2017.125. - DOI - PubMed
    1. Witwer KW, Théry C. Extracellular vesicles or exosomes? On primacy, precision, and popularity influencing a choice of nomenclature. J. Extracell. Vesicles. 2019;8:1648167. doi: 10.1080/20013078.2019.1648167. - DOI - PMC - PubMed
    1. Mathieu M, Martin-Jaular L, Lavieu G, Théry C. Specificities of secretion and uptake of exosomes and other extracellular vesicles for cell-to-cell communication. Nat. Cell Biol. 2019;21:9–17. doi: 10.1038/s41556-018-0250-9. - DOI - PubMed
    1. Escola JM, et al. Selective enrichment of tetraspan proteins on the internal vesicles of multivesicular endosomes and on exosomes secreted by human B-lymphocytes. J. Biol. Chem. 1998;273:20121–20127. doi: 10.1074/jbc.273.32.20121. - DOI - PubMed

Publication types