. 2021 Jul 19;12(1):4385.
doi: 10.1038/s41467-021-24584-w.

Development of a fixed module repertoire for the analysis and interpretation of blood transcriptome data

Affiliations

Development of a fixed module repertoire for the analysis and interpretation of blood transcriptome data

Matthew C Altman et al. Nat Commun. .

Abstract

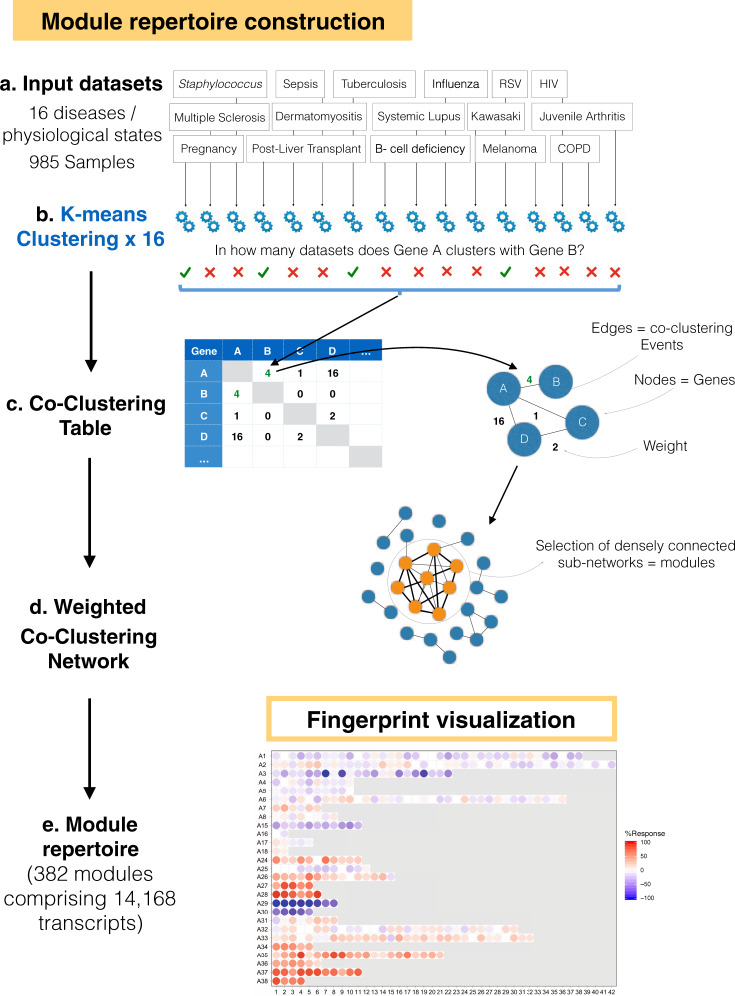
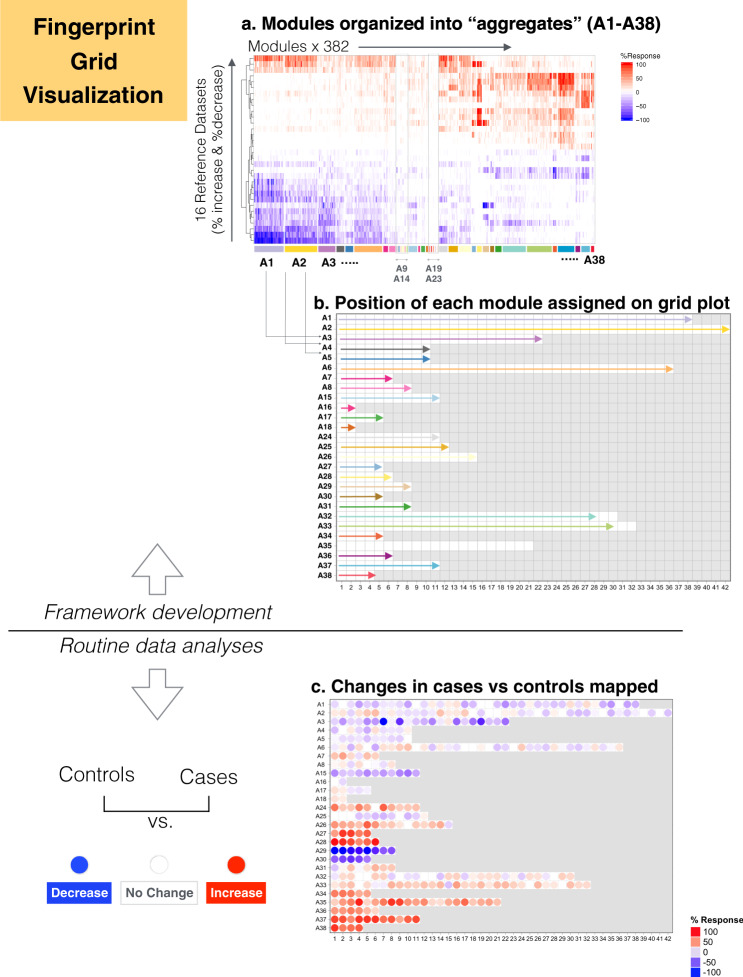
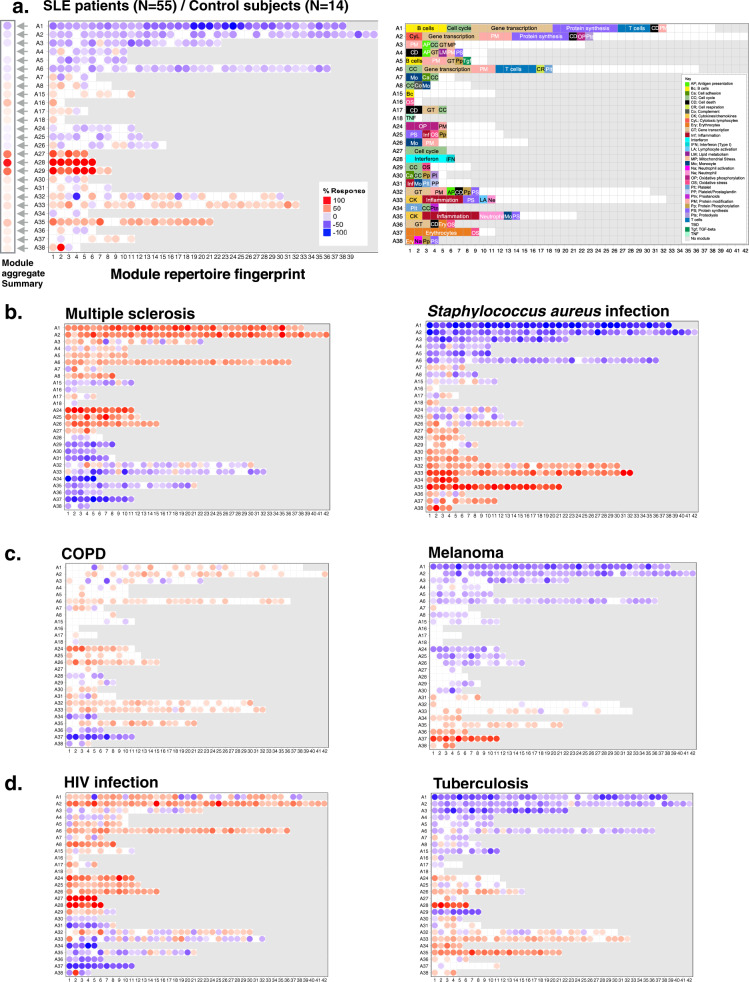
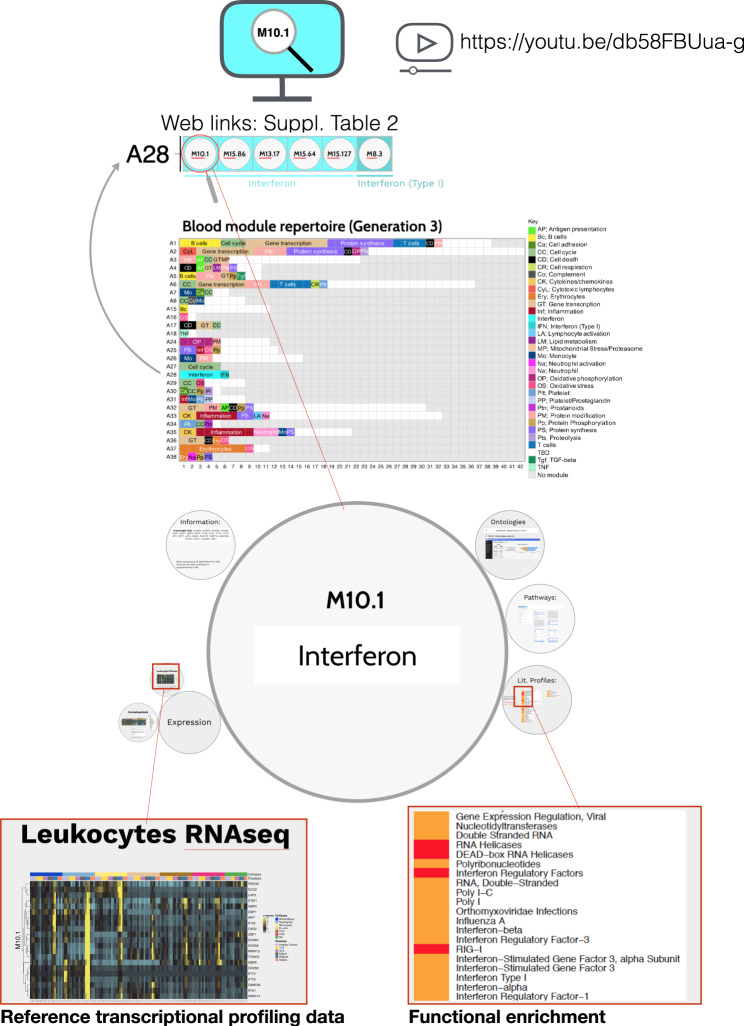
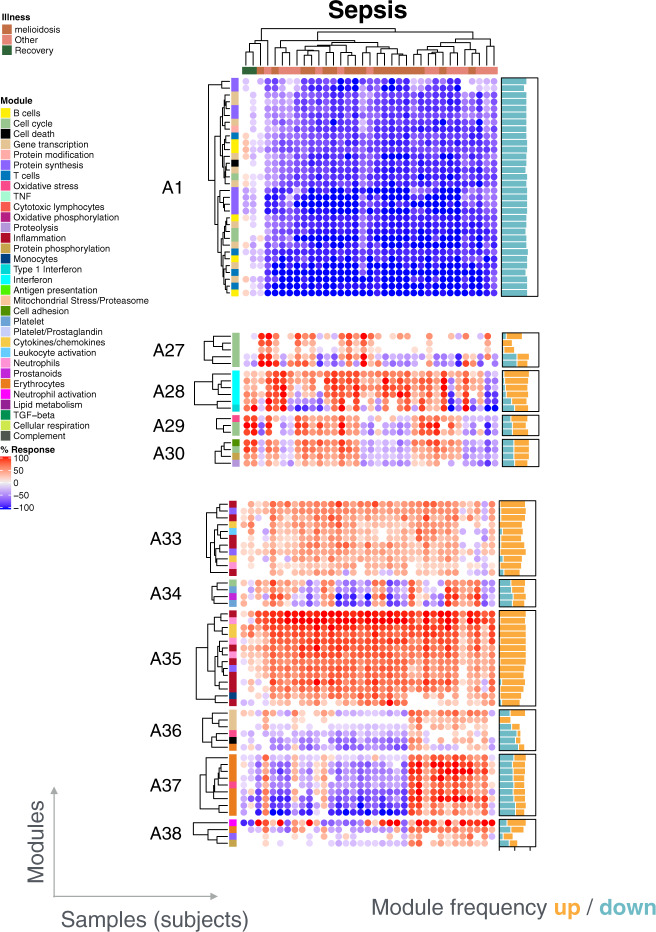
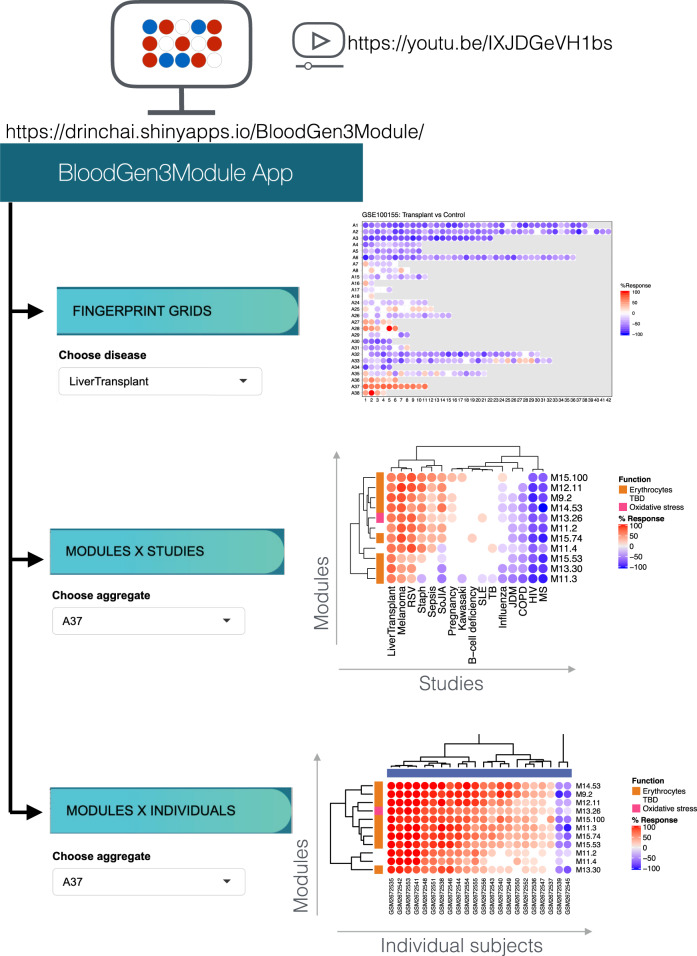
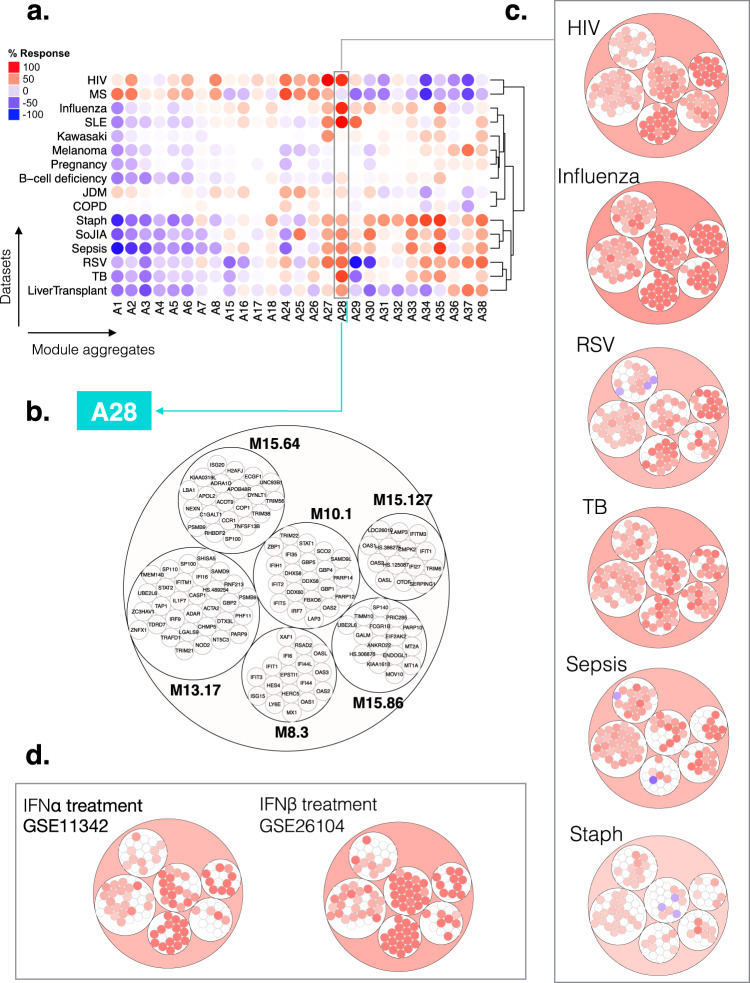
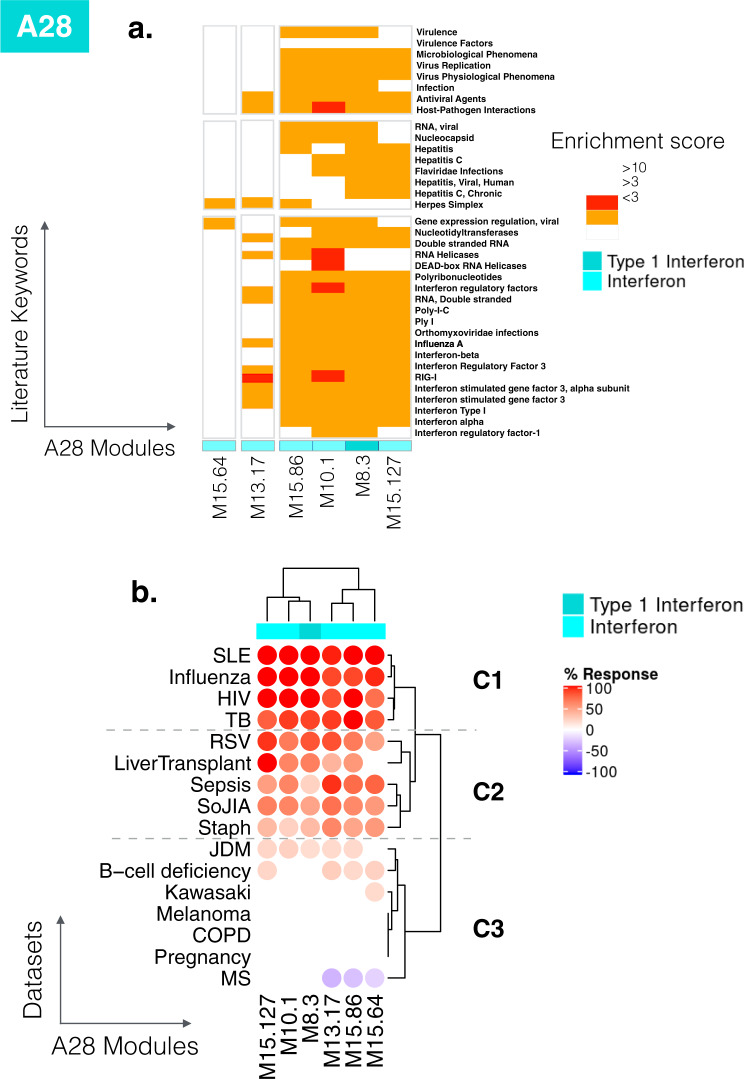
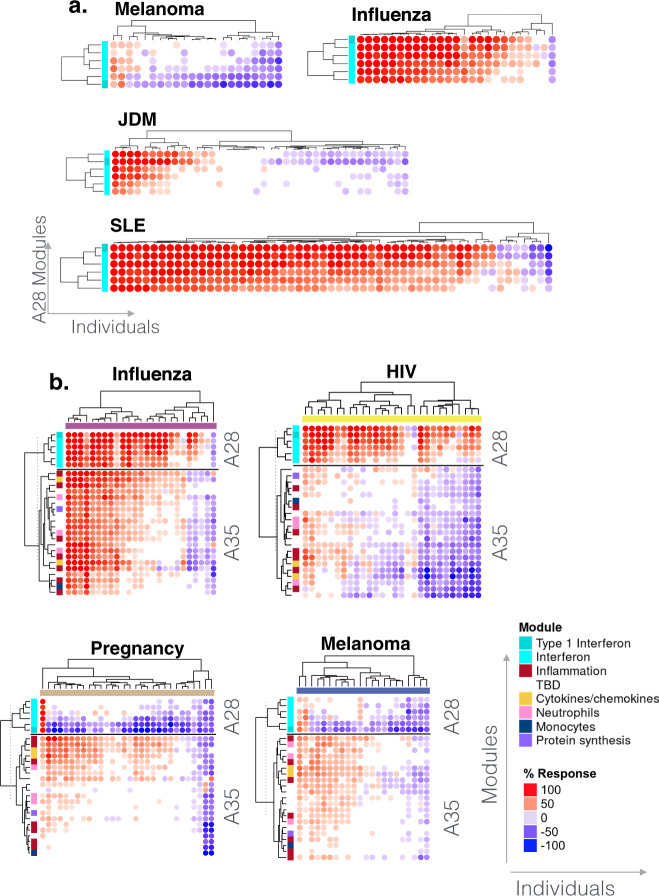
As the capacity for generating large-scale molecular profiling data continues to grow, the ability to extract meaningful biological knowledge from it remains a limitation. Here, we describe the development of a new fixed repertoire of transcriptional modules, BloodGen3, that is designed to serve as a stable reusable framework for the analysis and interpretation of blood transcriptome data. The construction of this repertoire is based on co-clustering patterns observed across sixteen immunological and physiological states encompassing 985 blood transcriptome profiles. Interpretation is supported by customized resources, including module-level analysis workflows, fingerprint grid plot visualizations, interactive web applications and an extensive annotation framework comprising functional profiling reports and reference transcriptional profiles. Taken together, this well-characterized and well-supported transcriptional module repertoire can be employed for the interpretation and benchmarking of blood transcriptome profiles within and across patient cohorts. Blood transcriptome fingerprints for the 16 reference cohorts can be accessed interactively via: https://drinchai.shinyapps.io/BloodGen3Module/ .


Conflict of interest statement

The authors declare no competing interests.

Figures

Fig. 1
Fig. 1. The module repertoire construction process.
a A collection of 16 blood transcriptome datasets spanning a wide range of immunological and physiological states was used as a starting point for the identification of gene co-expression patterns (RSV: Respiratory Syncytial Virus, HIV: Human Immunodeficiency Virus, COPD: Chronic Obstructive Pulmonary Disease). b Each dataset was independently clustered via k-means clustering. c Gene co-clustering events were recorded in a table, where the entries indicate in how many datasets, out of the 16, co-clustering was observed for a given gene pair. d The co-clustering table served as the input to build a weighted co-clustering graph (see also Supplementary Fig. 1), where the nodes represent genes and the edges represent co-clustering events. e The largest, most highly weighted sub-networks among a large network (constituting 15,132 nodes in this case) were identified mathematically and assigned a module ID. The genes constituting this module were removed from the selection pool and the process was repeated to select the next largest set of genes. Once all the gene sets for a given round of selection have been identified the criterion is relaxed for the next round, (e.g. M1 modules corresponding to the first round with the highest co-clustering weight [16 out of 16 datasets], M2 modules corresponding to the second round [co-clustering observed in 15 out of 16 datasets]). Overall, this process resulted in the selection of 382 modules comprising 14,168 transcripts.
Fig. 2
Fig. 2. The development of the BloodGen3 module fingerprint grids.
a Rows on this heatmap correspond each to changes in transcript abundance for a given dataset and for a given direction (i.e. increase or decrease in transcript abundance). These values, the percentages of constitutive probes either increased or decreased within a module, are computed for the 16 datasets used as input for module construction (Table 1). Increases in transcript abundance compared to a healthy baseline are depicted in red and decreases are depicted in blue. Therefore, in total 32 rows are displayed on this heatmap. Columns correspond to modules comprising the BloodGen3 repertoire (N = 382). The colors shown on the bottom track are associated with module aggregate ID and only serve to illustrate the strategy that was employed for organization of modules on the fingerprint grid plot. b The modules were arranged onto the grid as follows: the master set of 382 modules was partitioned into 38 clusters (or aggregates) based on similarities among their module activity profiles across the sixteen reference datasets (A1–A38). A subset of 27 aggregates comprising two or more modules in turn occupied a line on the grid. The length of each line was adapted to accommodate the number of modules assigned to each cluster. The format of the grid was fixed for all analyses carried out using the BloodGen3 module repertoire. c When performing downstream analyses of blood transcriptome datasets using the BloodGen3Module R package changes in transcript abundance at the module level are mapped onto this grid and represented by colored spots of varying intensity.
Fig. 3
Fig. 3. Fingerprint grid plots.
a Prototypical fingerprint grid plot. Changes in blood transcript abundance for patients with Systemic Lupus Erythematosus (SLE) compared to healthy controls are represented on a fingerprint grid plot for this illustrative case. The modules occupy a fixed position on the fingerprint grid plots (see Fig. 2). An increase in transcript abundance for a given module is represented by a red spot; a decrease in abundance is represented by a blue spot. Modules arranged on a given row belong to a module aggregate (here denoted as A1 to A38). Changes measured at the “aggregate level” are represented by spots to the left of the grid next to the denomination for the corresponding aggregate. The colors and intensities of the spots are based on the average across each given row of modules. A module annotation grid is provided where a color key indicates the functional associations attributed to some of the modules on the grid (top right). Positions on the annotation grid occupied by modules for which no consensus annotation was attributed are colored white. Positions on the grid for which no modules have been assigned are colored gray. bd Fingerprint grid plots for additional reference datasets (COPD: chronic obstructive pulmonary disease, HIV: human immunodeficiency virus).
Fig. 4
Fig. 4. Functional annotation of the transcriptional module repertoire.
An interactive application is available to explore the 382 modules comprising the blood transcriptome repertoire. A gene list, along with the ontology, pathway, literature-term enrichment, and transcriptional profiling data for reference transcriptome datasets (circulating leukocyte populations, hematopoiesis) is provided for each module. Zoom in and zoom out functionalities for close-up examination of the text and figures embedded in the presentation are available. Web links providing access to modules within a given aggregate are listed in Supplementary Table 2. For a demonstration video, please visit: https://youtu.be/db58FBUua-g.
Fig. 5
Fig. 5. Individual-level module heatmap.
Changes in transcript abundance were determined at the individual level across all modules constituting the repertoire. These changes are represented on a heatmap, where an increase in abundance of a given module is represented in red, and a decrease in abundance is represented in blue. The subjects are organized as columns and the modules as rows. The order on the heat map was determined by hierarchical clustering.
Fig. 6
Fig. 6. Web application to visualize multi-tiered module fingerprinting.
An application was developed to explore the changes in transcript abundance at the module level across the 16 reference datasets used to construct the repertoire. Three types of plot can be displayed and exported: (1) fingerprint grids; (2) module heatmaps displaying changes in abundance in modules comprising a given aggregate across the 16 reference datasets; and (3) module heatmaps displaying changes in abundance in modules comprising a given aggregate across individuals constituting a given dataset. To access the application, please visit: https://drinchai.shinyapps.io/BloodGen3Module/. For a demonstration video, please visit: https://youtu.be/IXJDGeVH1bs.
Fig. 7
Fig. 7. Module aggregate abundance patterns across the 16 disease or physiological states.
a Patterns of changes in transcript abundance at the aggregate and cohort levels. Each column on the heatmap corresponds to a “module aggregate”, numbered A1 to A38. Modules A9–A14 and A19–A24 were excluded as they each comprised only one module. Each row on the heatmap corresponds to one of the 16 datasets used to construct the module repertoire. A red spot on the heatmap indicates an increase in abundance of transcripts comprising a given module cluster for a given disease or physiologic state. A blue spot indicates a decrease in abundance of transcripts. No color indicates no change. Disease or physiological states were arranged based on the level of similarity in the patterns of aggregate activity, determined via hierarchical clustering. b Representation of the modules and genes constituting aggregate A28. The circle plot represents the six modules constituting aggregate 28, and the transcripts constituting each of the modules. Some genes on the Illumina BeadArrays can map to multiple probes, which explains the few instances where the same gene can be found in different modules. c Patterns of changes in transcript abundance at the module level and gene level for aggregate A28. The circle plots illustrate the changes at the gene level for this aggregate for 6/16 datasets. The position of the genes on each of these plots is the same as shown in panel B. Genes for which transcript abundance is changed are shown in red (increase) or in blue (decrease). d Patterns of changes in transcript abundance at the module and gene levels for aggregate A28 in subjects treated with IFN-α or IFN-β. The circle plots show changes in abundance of A28 transcripts in patients with hepatitis C infection treated with IFN-α [GSE11342] or patients with MS treated with IFN-β [GSE26104] (HIV: human immunodeficiency virus, RSV: respiratory syncytial virus, TB: Tuberculosis, Staph: Staphylococcus aureus infection, SLE: systemic lupus erythematosus, MS: multiple sclerosis, JDM: juvenile dermatomyositis, COPD: chronic obstructive pulmonary disease, SoJIA: systemic onset juvenile idiopathic arthritis, IFNα: interferon alpha, IFNβ: interferon beta).
Fig. 8
Fig. 8. Literature profiles and patterns of changes in abundance across reference datasets for the modules comprising aggregate A28.
a Functional annotation by literature profiling. A. Portion of a heatmap comprising 382 modules organized as columns, and literature terms organized as rows. The six modules shown are associated with the consensus annotation “Interferon” or “Type 1 Interferon”. The clusters of keywords associated with those modules are consistent with this annotation and provide added granularity to the module repertoire for functional profiling and interpretation. b Changes in abundance across 16 reference datasets. The heatmap represents the changes in abundance of transcripts constituting the six modules comprising aggregate A28 (columns). The modules are functionally associated with interferon responses. The 16 reference datasets are arranged as rows corresponding to different health states. The columns and rows are arranged by hierarchical clustering. The heatmaps can be accessed and exported for all 16 datasets and 38 module aggregates using the web application: https://drinchai.shinyapps.io/BloodGen3Module/ (under the “MODULES X STUDIES” tab).
Fig. 9
Fig. 9. Abundance patterns across individuals.
a Changes in abundance for A28 modules. The heatmaps display the changes in abundance for the same six modules (rows) across individuals (columns) in four reference cohorts. The rows and columns on the heatmap are arranged based on similarities in abundance patterns. b Changes in abundance for A28 and A35 modules. The heatmaps display the changes in abundance of six modules constituting aggregate A28 and 21 modules constituting aggregate A35 (rows) across individuals (columns) in four reference datasets. Functional annotations associated with different modules are indicated by a color code and corresponding legend. The heatmaps can be accessed and exported for all 16 datasets and 38 module aggregates using the web application: https://drinchai.shinyapps.io/BloodGen3Module/ (under the “MODULES X INDIVIDUALS” tab).

References

    1. Hulsen T, et al. From big data to precision medicine. Front. Med. 2019;6:34. doi: 10.3389/fmed.2019.00034. - DOI - PMC - PubMed
    1. Chaussabel D. Assessment of immune status using blood transcriptomics and potential implications for global health. Semin. Immunol. 2015;27:58–66. doi: 10.1016/j.smim.2015.03.002. - DOI - PubMed
    1. Pascual V, Chaussabel D, Banchereau J. A genomic approach to human autoimmune diseases. Annu. Rev. Immunol. 2010;28:535–571. doi: 10.1146/annurev-immunol-030409-101221. - DOI - PMC - PubMed
    1. Speake C, et al. Longitudinal monitoring of gene expression in ultra-low-volume blood samples self-collected at home. Clin. Exp. Immunol. 2017;188:226–233. doi: 10.1111/cei.12916. - DOI - PMC - PubMed
    1. Mahajan P, et al. Association of RNA biosignatures with bacterial infections in febrile infants aged 60 days or younger. JAMA. 2016;316:846–857. doi: 10.1001/jama.2016.9207. - DOI - PMC - PubMed

Publication types