. 2021 Jul 19;12(1):4379.
doi: 10.1038/s41467-021-24609-4.

Genetic and chemical inhibition of IRF5 suppresses pre-existing mouse lupus-like disease

Affiliations

Genetic and chemical inhibition of IRF5 suppresses pre-existing mouse lupus-like disease

Tatsuma Ban et al. Nat Commun. .

Abstract

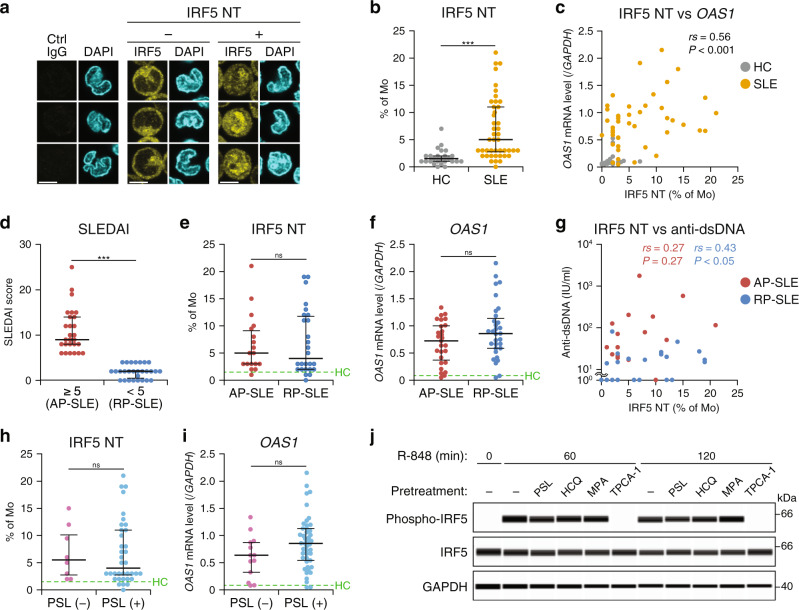
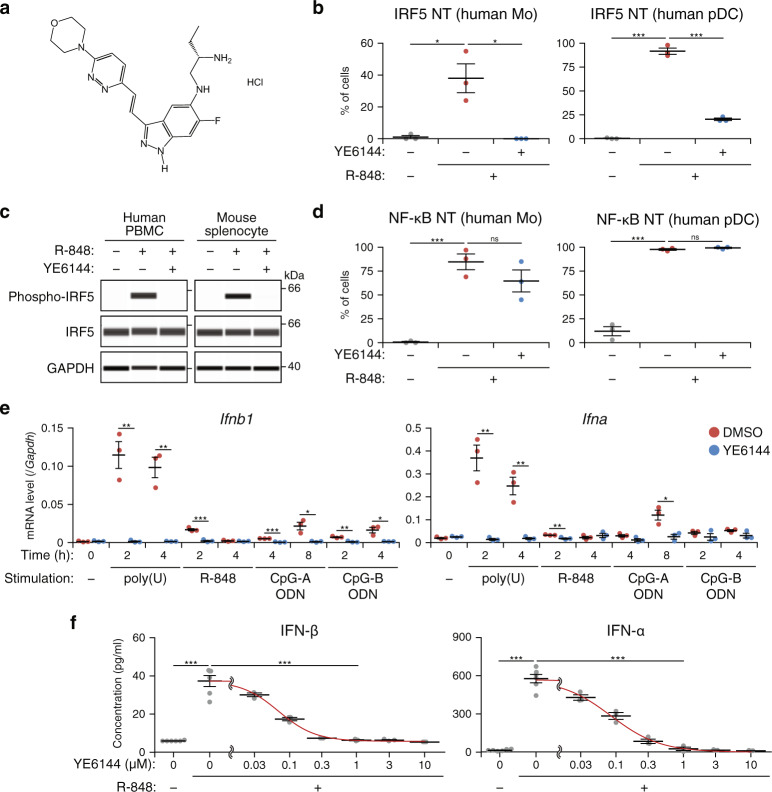
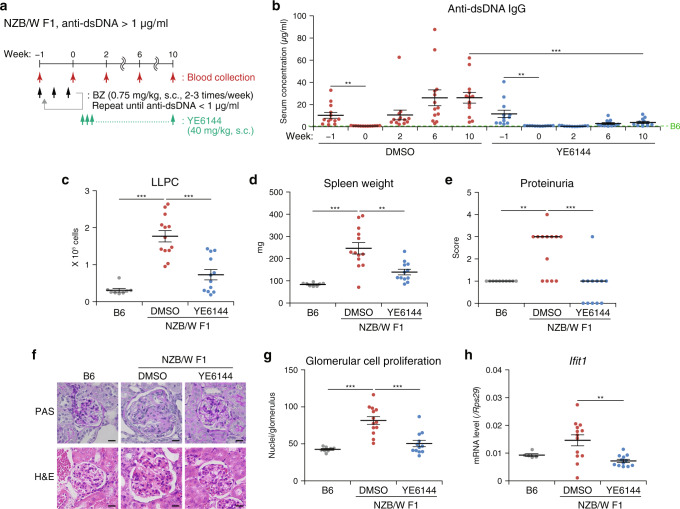
The transcription factor IRF5 has been implicated as a therapeutic target for the autoimmune disease systemic lupus erythematosus (SLE). However, IRF5 activation status during the disease course and the effects of IRF5 inhibition after disease onset are unclear. Here, we show that SLE patients in both the active and remission phase have aberrant activation of IRF5 and interferon-stimulated genes. Partial inhibition of IRF5 is superior to full inhibition of type I interferon signaling in suppressing disease in a mouse model of SLE, possibly due to the function of IRF5 in oxidative phosphorylation. We further demonstrate that inhibition of IRF5 via conditional Irf5 deletion and a newly developed small-molecule inhibitor of IRF5 after disease onset suppresses disease progression and is effective for maintenance of remission in mice. These results suggest that IRF5 inhibition might overcome the limitations of current SLE therapies, thus promoting drug discovery research on IRF5 inhibitors.


Conflict of interest statement

Y.M., S.S., H.H., M.I., and K.T. are employees of Eisai Co., Ltd. T. Tamura received joint research funds from Eisai Co., Ltd. All other authors declare no competing interests.

Figures

Fig. 1
Fig. 1. Activation status of IRF5 in human SLE.
a Evaluation of IRF5 activation by nuclear translocation (NT). Fluorescent images of monocytes (Mo), stained with control IgG (left) or an anti-IRF5 antibody (middle and right) and then with a fluorochrome-conjugated secondary antibody (yellow), were captured by confocal microscopy. Nuclei were stained with DAPI (cyan). Representative images of cells with or without IRF5 NT, obtained from two of the SLE patients and one of the healthy control (HC) donors, respectively, analyzed in b are shown. Scale bars represent 5 μm. b IRF5 hyperactivation in SLE-associated monocytes. The IRF5 NT was defined as the nuclear/cytosolic IRF5 ratio of >1.5× most frequent ratio from the same sample containing 75–100 cells (see “Methods”). The proportion of monocytes featuring IRF5 NT in HC donors and SLE patients. c Correlation between IRF5 NT and ISG expression. A scatterplot of IRF5 NT prevalence among monocytes and the OAS1 mRNA level in peripheral blood are shown. df Persistence of aberrant IRF5 activation and ISG expression in remission-phase (RP)-SLE. Active-phase (AP)- and RP-SLE were defined as the SLEDAI-2K ≥ 5 and <5, respectively (d). The percentage of monocytes with IRF5 NT (e) and the OAS1 mRNA level in peripheral blood (f) in AP- and RP-SLE were analyzed. g Correlation between IRF5 NT and the anti-dsDNA antibody level in RP-SLE. A scatterplot of IRF5 NT prevalence among monocytes and serum anti-dsDNA antibody concentration in AP- and RP-SLE are presented. h, i Persistence of aberrant IRF5 activation and ISG expression after the standard therapy. Percentages of monocytes featuring IRF5 NT (h) and OAS1 mRNA levels in peripheral blood (i) from SLE patients treated or not treated with PSL were analyzed. j Effects of standard-of-care drugs on IRF5 activation. PBMCs from a HC donor were pretreated with 1.5 μM PSL, 3 μM HCQ, 60 μM mycophenolic acid (MPA), or 1 μM TPCA-1 (positive control) for 30 min and then stimulated with 3 μM R-848 for 60 or 120 min. The cell lysates were analyzed by a capillary-based immunoassay with antibodies against phosphorylated IRF5 (phospho-IRF5), total IRF5, and GAPDH as a loading control. Representative data from two independent experiments are depicted. HC: n = 25, SLE: n = 44 (b, c), AP-SLE: n = 27 (d, f), or 18 (e, g), RP-SLE: n = 31 (d, f) or 26 (e, g), PSL (−): n = 8 (h) or 13 (i), PSL (+): n = 36 (h) or 45 (i). Horizontal bars (b, df, h, i) represent median with interquartile range. Dashed lines (e, f, h, i) indicate the median of HC data. ***P < 0.001, ns: not significant (two-sided Mann–Whitney U test). Two-sided Spearman’s rank correlation coefficients (rs) and P value were used to assess the correlation (c, g).
Fig. 2
Fig. 2. Superiority of IRF5 over IFNAR1 in suppressing SLE-like disease development.
a Autoantibody formation. Serum concentration of an anti-dsDNA antibody in WT (n = 12), Lyn−/− (n = 16), Lyn−/−Ifnar1+/− (n = 11), Lyn−/−Ifnar1−/− (n = 16), Lyn−/−Irf5+/− (n = 16), and Lyn−/−Irf5−/− (n = 14) female and male mice at 22–24 weeks of age was measured by ELISA. b, c Splenomegaly. Representative image (b) and weight data (c) of the spleens of WT (n = 17), Lyn−/− (n = 18), Lyn−/−Ifnar1+/− (n = 11), Lyn−/−Ifnar1−/− (n = 18), Lyn−/−Irf5+/− (n = 12), and Lyn−/−Irf5−/− (n = 6) mice at 22–24 weeks of age. Scale bar represents 10 mm (b). The circles and diamonds denote the female and male mice, respectively (c). df Kidney pathology and IgG deposition. d Representative images of periodic acid-Schiff (top) and hematoxylin–eosin (H&E; middle) staining, and IgG immunofluorescence (IF; bottom) of kidney glomeruli from WT (n = 9), Lyn−/− (n = 9), Lyn−/−Ifnar1+/− (n = 6), Lyn−/−Ifnar1−/− (n = 6), Lyn−/−Irf5+/− (n = 6), and Lyn−/−Irf5−/− (n = 6) mice at 33–34 weeks of age. Scale bars denote 20 μm. e Glomerular cell proliferation in d (represented by the number of nuclei per glomerulus) was analyzed. Each dot represents the mean nucleus counts of ten glomeruli per mouse. f Relative MFI of the IgG deposited in glomeruli in d was analyzed. Each dot represents the relative MFI of the five glomeruli per mouse. gk RNA-seq data from peripheral blood obtained from SLE patients and HC donors (public data) or from WT, Lyn−/−, Lyn−/−Ifnar1−/−, Lyn−/−Irf5+/−, and Lyn−/−Irf5−/− female mice at 22–23 weeks of age (n = 4 for each genotype) were subjected to GSEA. g Sets of genes that were significantly upregulated in both SLE patients (versus [vs] HC donors) and Lyn−/− mice (vs WT mice; false discovery rate < 0.05). h Gene sets in g were further analyzed to extract gene sets whose expression levels were significantly different between Lyn−/−Ifnar1−/− and Lyn−/−Irf5−/− mice (false discovery rate < 0.05). i The GSEA enrichment plot of OXPHOS genes (Lyn−/−Ifnar1−/− vs Lyn−/−Irf5−/−). NES normalized enrichment score. j A heatmap of the expression of OXPHOS genes in the indicated genotypes. The color represents the mean fold change (FC) as compared to WT. Genes with FC > 1.5 in Lyn−/− mice are shown. k A dot plot of the data from j (n = 36 for each genotype). Horizontal bars indicate mean ± SEM (a, c, e, f) or median with interquartile range (k). Data in af were pooled from at least two independent experiments. *P < 0.05, **P < 0.01, ***P < 0.001, ns: not significant (two-sided Student’s t test in a, c, e, f, and two-sided Mann–Whitney U test in k).
Fig. 3
Fig. 3. Therapeutic effect of Irf5 ablation on pre-existing mouse SLE-like disease.
a The scheme of the IRF5 cKO experiment; p.o. per os. b Concentration of serum anti-dsDNA IgG in WT (n = 17), Lyn−/−Irf5fl/fl (n = 17), and Lyn−/−Irf5fl/flCreER (n = 14) female and male mice at 1 week before tamoxifen (TAM) treatment (11–23 weeks of age). c, d Irf5 and ISG expression. Irf5 (c) and Oasl2 (d) mRNA levels in peripheral blood from mice in b at the indicated time points were analyzed by RT-qPCR. e Autoantibody formation. Serum anti-dsDNA IgG concentrations in mice in b at the indicated time points were measured by ELISA. f Spleen weight of WT (n = 17), Lyn−/−Irf5fl/fl (n = 15), and Lyn−/−Irf5fl/flCreER (n = 12) mice at 24–28 weeks after TAM treatment (40–51 weeks of age). The circles and diamonds denote the female and male mice, respectively. gi Kidney pathology and IgG deposition analyses as in Fig. 2d–f. WT (n = 10 in h and 14 in i), Lyn−/−Irf5fl/fl (n = 17), and Lyn−/−Irf5fl/flCreER (n = 13) mice at age 40–51 weeks were studied. Scale bars represent 20 μm. Horizontal bars (bf, h, i) indicate mean ± SEM. Dashed lines (be) denote the mean of WT mouse data. Data were compiled from seven independent experiments. *P < 0.05, **P < 0.01, ***P < 0.001 (two-sided Student’s t test in b, e, f; two-sided Welch’s t test in h, i; two-sided Student’s t test for a comparison between genotypes or the two-sided paired t test for a comparison within the same genotype in c, d).
Fig. 4
Fig. 4. Maintenance of remission by the Irf5 cKO in the Lyn-deficient mouse model of SLE.
a The LLPC number in bone marrow (BM; left) or in the spleen (right) from WT (n = 17), Lyn−/−Irf5fl/fl (n = 10), and Lyn−/−Irf5fl/flCreER (n = 12) mice at 24–28 weeks after TAM treatment as in Fig. 3a (40–46 weeks of age) was analyzed by flow cytometry. b The scheme of the Irf5 cKO combined with BZ-induced LLPC depletion; s.c. subcutaneously. c, d Irf5 and ISG expression. Irf5 (c) and Oasl2 (d) mRNA levels in peripheral blood from Lyn−/−Irf5fl/fl (n = 11) and Lyn−/−Irf5fl/flCreER (n = 7) female and male mice (29–32 weeks of age at week 0) treated as in b were analyzed by RT-qPCR. e The LLPC number in BM (left) and spleen (right) from WT (n = 8), Lyn−/−Irf5fl/fl (n = 10), and Lyn−/−Irf5fl/flCreER (n = 6) mice at 12 weeks after the first injection (41–44 weeks of age) as in b was analyzed by flow cytometry. f Spleen weight of mice in e. The circles and diamonds denote the female and male mice, respectively. g Autoantibody production. Serum anti-dsDNA IgG from mice in c was quantified by ELISA. Data were pooled from two independent experiments. Horizontal bars (a, cg) indicate mean ± SEM. Dashed lines (c, d, g) denote mean data from WT mice (n = 5). *P < 0.05, **P < 0.01, ***P < 0.001 (two-sided Student’s t test in a, e, f; two-sided paired t test in c, d, g).
Fig. 5
Fig. 5. Suppression of IRF5 and type I IFN by a prototypical IRF5 inhibitor YE6144.
a Chemical structure of YE6144. b IRF5 NT in monocytes (Mo; left) or pDCs (right) sorted from human HC PBMCs that were pretreated with the vehicle (DMSO) or 1 μM YE6144 for 30 min and then were stimulated with 3 μM R-848 for 30 min. c IRF5 phosphorylation. Human HC PBMCs and mouse WT splenocytes were pretreated with either 1 and 3 μM YE6144, respectively, or DMSO for 30 min and then stimulated with 3 μM R-848 for 60 min. Cell lysates were analyzed by the capillary-based immunoassay with antibodies against phospho-IRF5, total IRF5, and GAPDH as a loading control. d NF-κB p65 NT in cells in b. e, f Type I IFNs. e Mouse WT splenocytes were pretreated with either DMSO or YE6144 for 30 min and next were stimulated with 2 μg/ml poly(U), 3 μM R-848, 1 μM CpG-A ODN, or 0.15 μM CpG-B ODN for the indicated period. Total RNA was isolated, and the expression of Ifnb1 and Ifna (detection of 12 subtypes) was analyzed by RT-qPCR. f Human HC PBMCs were pretreated with either DMSO (0) or YE6144 at the indicated doses for 30 min and then were stimulated with 3 μM R-848 for 24 h. IFN-β and IFN-α (detection of four subtypes) in culture supernatants was measured by ELISA. The concentration (0.03–10 μM) of YE6144 was plotted on a logarithmic scale. The red line represents a four-parameter log-logistic dose–response curve. Data in b, d were compiled from three independent experiments (n = 3 in total). Data in c, e, f are representative of two independent experiments (n = 3 in e and n = 3 [YE6144] or 6 [DMSO] in f for each experiment). Horizontal bars (b, df) denote mean ± SEM. *P < 0.05, **P < 0.01, ***P < 0.001 (two-sided Student’s t test).
Fig. 6
Fig. 6. Maintenance of remission by YE6144 in the NZB/W F1 mouse model of SLE.
a The scheme of YE6144 treatment combined with BZ administration b Autoantibody production. Serum anti-dsDNA IgG levels in NZB/W F1 female mice (31–34 weeks of age at week 0) treated with either DMSO (n = 13) or YE6144 (n = 12) after BZ injection were analyzed by ELISA. The dashed line denotes the mean data from untreated WT C57BL/6 (B6) mice (n = 3). c The LLPC number in the spleen from WT B6 mice (n = 8) and NZB/W F1 mice in b at 10 weeks after the initial YE6144 injection (age 41–44 weeks) was analyzed by flow cytometry. d Spleen weight of mice in c. e The proteinuria score of WT B6 mice (n = 10) and NZB/W F1 mice in c. f, g Kidney pathology of mice in c analyzed as in Fig. 2d, e. Representative images are shown and scale bars correspond to 20 μm (f). h ISG expression. The Ifit1 mRNA level in peripheral blood from WT B6 mice (n = 5) and NZB/W F1 mice in c was analyzed by RT-qPCR. Data were compiled from three independent experiments. Horizontal bars represent mean ± SEM (bd, g, h) or median (e). **P < 0.01, ***P < 0.001 (two-sided paired t test in b [the same treatment samples]; two-sided Student’s t test in b [different treatment samples], c, d, g, h; and two-sided Mann–Whitney U test in e).

References

    1. Liu Z, Davidson A. Taming lupus-a new understanding of pathogenesis is leading to clinical advances. Nat. Med. 2012;18:871–882. doi: 10.1038/nm.2752. - DOI - PMC - PubMed
    1. Tsokos GC, Lo MS, Costa Reis P, Sullivan KE. New insights into the immunopathogenesis of systemic lupus erythematosus. Nat. Rev. Rheumatol. 2016;12:716–730. doi: 10.1038/nrrheum.2016.186. - DOI - PubMed
    1. Wahren-Herlenius M, Dorner T. Immunopathogenic mechanisms of systemic autoimmune disease. Lancet. 2013;382:819–831. doi: 10.1016/S0140-6736(13)60954-X. - DOI - PubMed
    1. Fanouriakis A, Bertsias G. Changing paradigms in the treatment of systemic lupus erythematosus. Lupus Sci. Med. 2019;6:e000310. doi: 10.1136/lupus-2018-000310. - DOI - PMC - PubMed
    1. Durcan L, O’Dwyer T, Petri M. Management strategies and future directions for systemic lupus erythematosus in adults. Lancet. 2019;393:2332–2343. doi: 10.1016/S0140-6736(19)30237-5. - DOI - PubMed

Publication types

MeSH terms