. 2021 Jul 19;12(1):4386.
doi: 10.1038/s41467-021-24506-w.

Insulin protects acinar cells during pancreatitis by preserving glycolytic ATP supply to calcium pumps

Affiliations

Insulin protects acinar cells during pancreatitis by preserving glycolytic ATP supply to calcium pumps

Jason I E Bruce et al. Nat Commun. .

Abstract

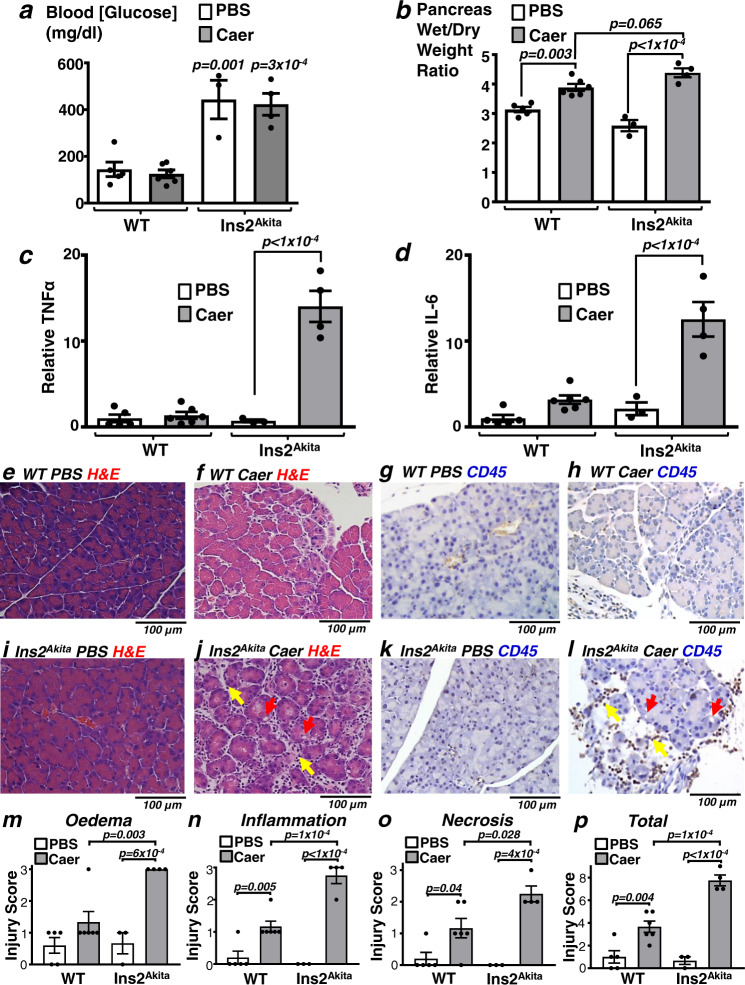
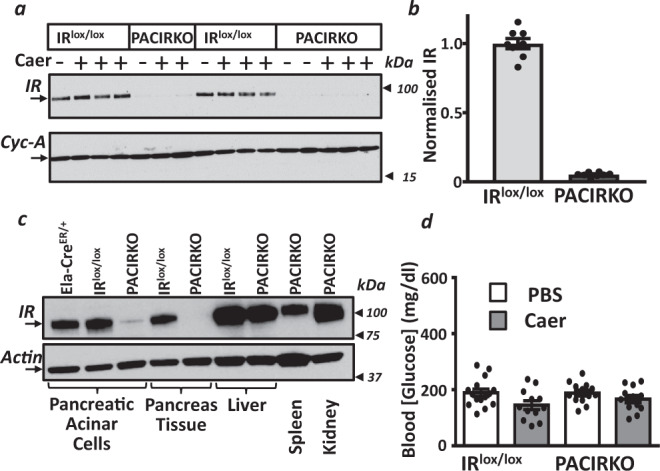
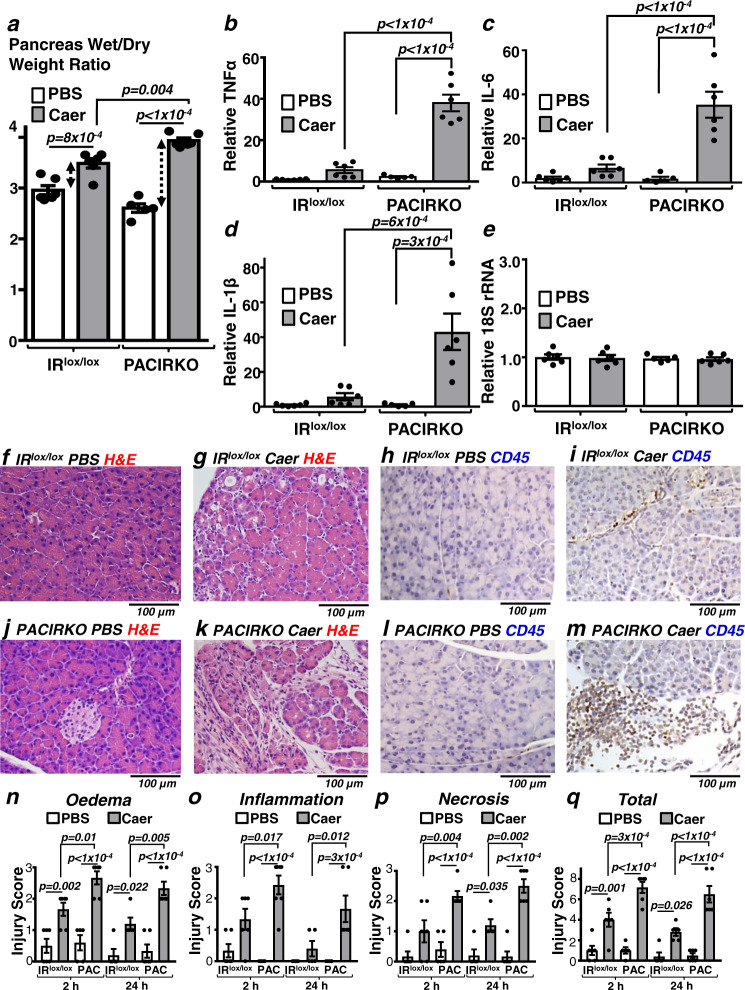
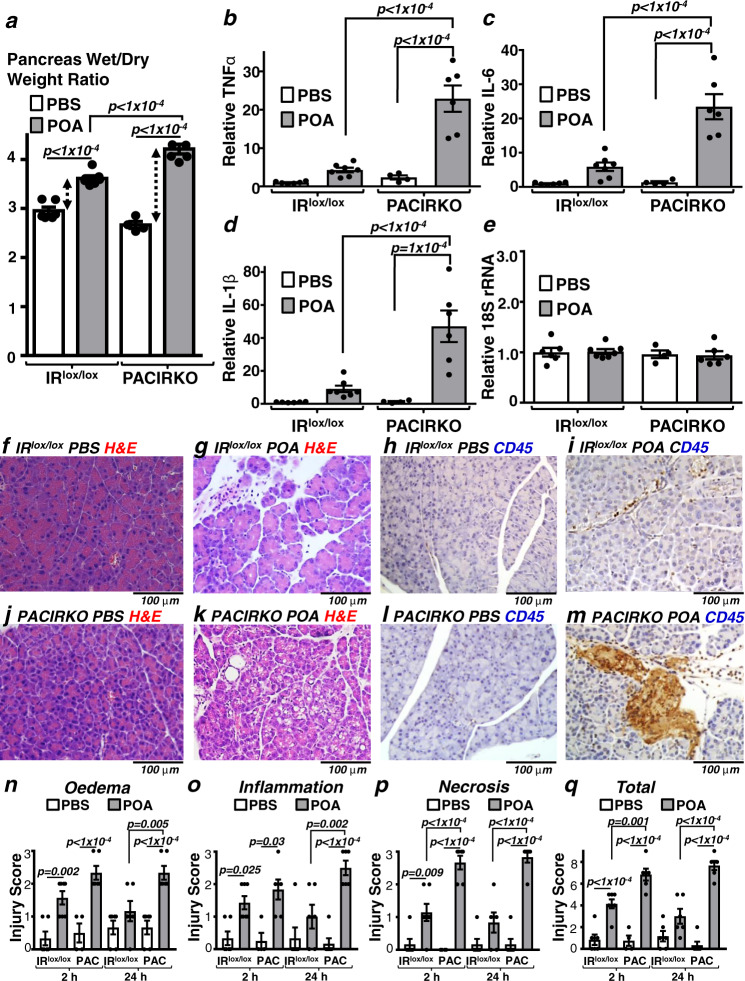
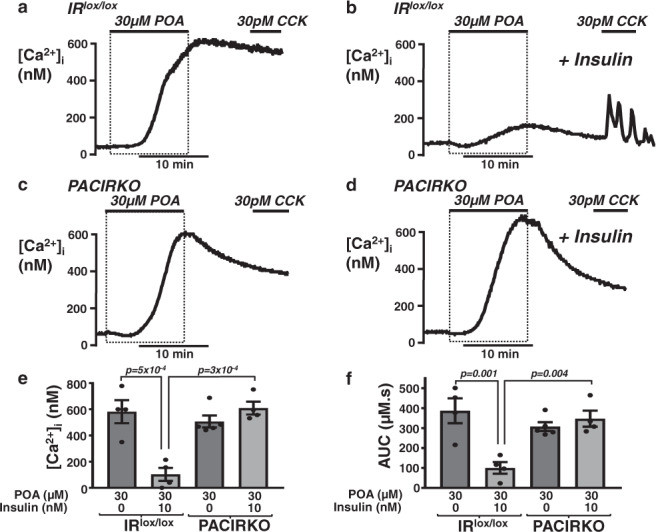
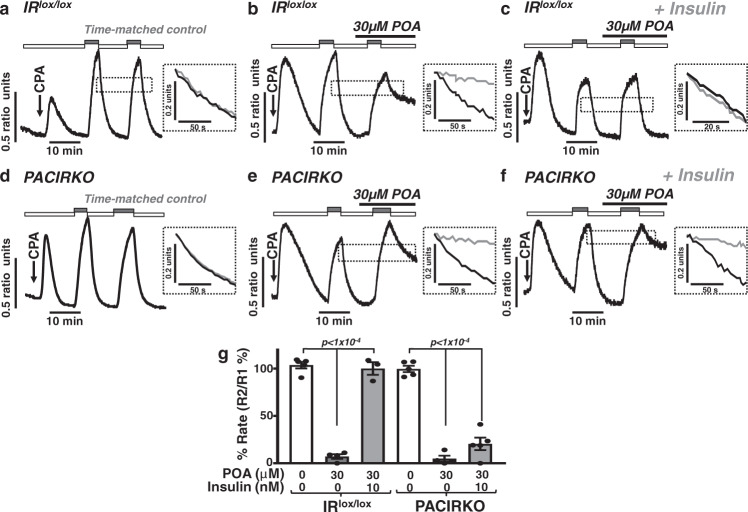
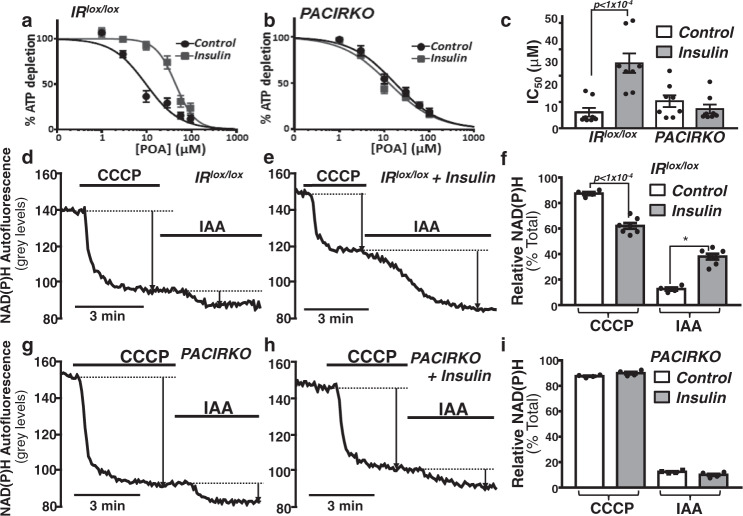
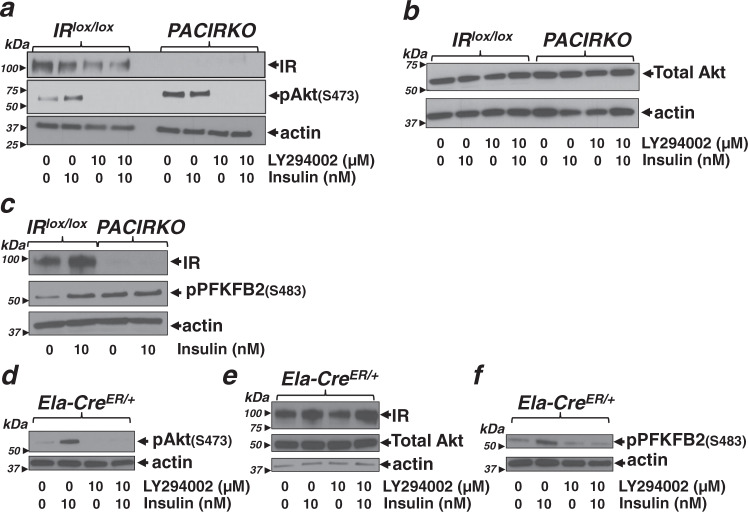
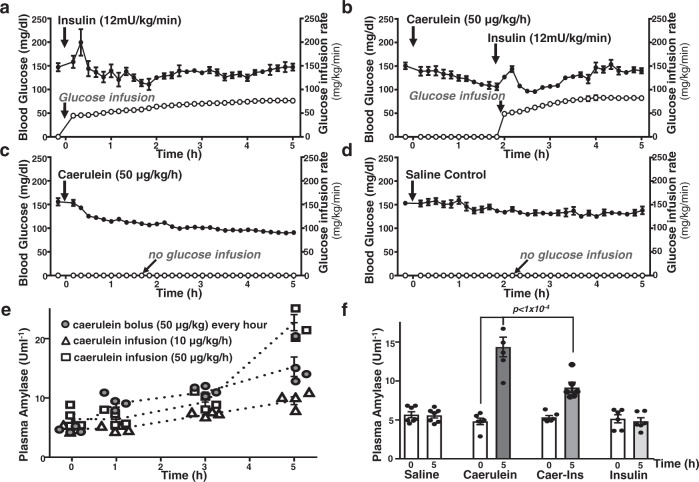
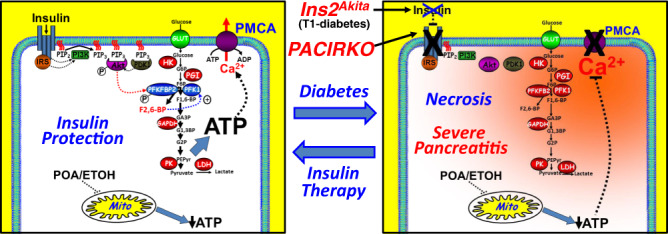
Acute pancreatitis (AP) is serious inflammatory disease of the pancreas. Accumulating evidence links diabetes with severity of AP, suggesting that endogenous insulin may be protective. We investigated this putative protective effect of insulin during cellular and in vivo models of AP in diabetic mice (Ins2Akita) and Pancreatic Acinar cell-specific Conditional Insulin Receptor Knock Out mice (PACIRKO). Caerulein and palmitoleic acid (POA)/ethanol-induced pancreatitis was more severe in both Ins2Akita and PACIRKO vs control mice, suggesting that endogenous insulin directly protects acinar cells in vivo. In isolated pancreatic acinar cells, insulin induced Akt-mediated phosphorylation of 6-phosphofructo-2-kinase/fructose-2,6-biphosphatase 2 (PFKFB2) which upregulated glycolysis thereby preventing POA-induced ATP depletion, inhibition of the ATP-dependent plasma membrane Ca2+ ATPase (PMCA) and cytotoxic Ca2+ overload. These data provide the first mechanistic link between diabetes and severity of AP and suggest that phosphorylation of PFKFB2 may represent a potential therapeutic strategy for treatment of AP.


Conflict of interest statement

The authors declare no competing interests.

Figures

Fig. 1
Fig. 1. Caerulein-induced pancreatitis is more severe in type-1 diabetic Ins2Akita mice vs wild type (WT) control mice.
Pancreatitis was induced in WT and type-1 diabetic Ins2Akita mice by caerulein (Caer; 50 µg/Kg × 8 hourly IP injections over 2 days) or phosphate-buffered saline (PBS) as a control and blood/tissue was harvested 24 h after the last injection. Blood glucose (a) and multiple readouts of pancreatitis were assessed (bp). These include; pancreatic tissue oedema (wet/dry weight ratio, b), cytokine expression (qPCR of tissue mRNA; TNFα, c; IL-6, d), histological signs of injury (haematoxylin and eosin (H&E), e, f, i and j), immunohistochemistry of the inflammatory marker, CD45 (brown) (g, h, k and l). Yellow and red arrows in j and l indicate vacuole formation and inflammatory cell infiltration, respectively. mp Histology injury scores (where 3 is the most severe) for oedema (m), inflammatory cell infiltration (n), necrosis (o), and total score (p; sum of other scores). Group sizes were: WT PBS, n = 5; WT Caer, n = 6; Ins2Akita PBS, n = 3; Ins2Akita Caer, n = 4. Significance (exact p values as indicated) was determined by one-way ANOVA with Sidak’s multiple comparisons. Data are presented as mean value ± SEM.
Fig. 2
Fig. 2. PACIRKO mice that lack pancreatic acinar cell insulin receptors are normoglycaemic.
a Insulin receptor (IR) expression (western blot using anti-IRβ antibody) in pancreas tissue from double floxed insulin receptor (IRlox/lox) mice vs Pancreatic Acinar Conditional Insulin Receptor Knock Out (PACIRKO) mice following administration of tamoxifen for 4 days (oral gavage or tamoxifen feed) with (+) or without (−) caerulein (Caer; 50 µg/Kg × 8 hourly IP injections over 2 days) to induce acute pancreatitis, or PBS. Western blotting with anti-cyclophilin-A was used as a loading control. IR expression was semi-quantified by normalizing band intensities to the corresponding cyclophilin-A band and further normalisation to the mean of IRlox/lox (b). c IR expression was also compared between lysates from pancreatic acinar cells and tissue from Ela-CreER/+ mice, IRlox/lox and PACIRKO and also liver, spleen and kidney tissue. Actin was used as a loading control (lower panel, c). For each western blot of IR in a, c, the corresponding loading control (cyclophilin-A in a and actin in b) were from the same gel (membrane cut and incubated with corresponding antibody) and are representative of three separate experiments. d Blood glucose in IRlox/lox vs PACIRKO mice, with caerulein (grey bars) or PBS white bars). Group sizes were: IRlox/lox PBS, n = 15; IRlox/lox Caer, n = 12; PACIRKO PBS, n = 13; PACIRKO Caer, n = 12. Data are presented as mean value ± SEM.
Fig. 3
Fig. 3. Caerulein-induced pancreatitis is more severe in PACIRKO vs IRlox/lox mice.
Pancreatitis was induced in control double floxed insulin receptor (IRlox/lox) mice vs Pancreatic Acinar Conditional Insulin Receptor Knock Out (PACIRKO) mice that lack insulin receptors (IRs) by caerulein (Caer; 50 µg/Kg × 8 hourly IP injections over 2 days) or phosphate-buffered saline (PBS) as a control and blood/tissue was harvested 2 and 24 h after the last injection. Multiple readouts of pancreatitis include; pancreatic tissue oedema (wet/dry weight ratio, a), cytokine expression (qPCR of tissue mRNA; TNFα, b; IL-6, c, IL-1β, d; and the housekeeping 18 S rRNA, e), histological signs of injury (haematoxylin and eosin (H&E), f, g, j and k), immunohistochemistry of the inflammatory marker, CD45 (brown) (h, i, l and m). nq Histology injury scores (where 3 is the most severe) for oedema (n), inflammatory cell infiltration (o), necrosis (p), and total score (q; sum of other scores). Group sizes were: 2 h harvest, IRlox/lox PBS, n = 6; IRlox/lox Caer, n = 6; PACIRKO PBS, n = 5; PACIRKO Caer, n = 6; 24 h harvest, IRlox/lox PBS, n = 5; IRlox/lox Caer, n = 5; PACIRKO PBS, n = 6; PACIRKO Caer, n = 6. Significance (exact p values as indicated) was determined by one-way ANOVA with Sidak’s multiple comparisons. Data are presented as mean value ± SEM.
Fig. 4
Fig. 4. POA/ethanol-induced pancreatitis was more severe in PACIRKO vs IRlox/lox mice.
Pancreatitis was induced in IRlox/lox and PACIRKO mice by 2 hourly IP injections of 100 µg/Kg POA in ethanol (0.8 g/Kg) or corresponding PBS control and blood/tissue was harvested 2 and 24 h after the last injection. Multiple readouts of pancreatitis include; pancreatic tissue oedema (wet/dry weight ratio, a), cytokine expression (qPCR of tissue mRNA; TNFα, b; IL-6, c, IL-1β, d; and the housekeeping 18S rRNA, e), histological signs of injury (haematoxylin and eosin (H&E), f, g, j and k), immunohistochemistry of the inflammatory marker, CD45 (brown) (h, i, l and m). nq Histology injury scores (where 3 is the most severe) for oedema (n), inflammatory cell infiltration (o), necrosis (p), and total score (q; sum of other scores). Group sizes were: 2 h harvest, IRlox/lox PBS, n = 6; IRlox/lox POA, n = 7; PACIRKO PBS, n = 4; PACIRKO Caer, n = 6; 24 h harvest, IRlox/lox PBS, n = 6; IRlox/lox Caer, n = 6; PACIRKO PBS, n = 6; PACIRKO Caer, n = 6 Significance (exact p values as indicated) was determined by one-way ANOVA with Sidak’s multiple comparisons. Data are presented as mean value ± SEM.
Fig. 5
Fig. 5. Insulin-mediated protection against palmitoleic-induced Ca2+ overload is abolished in pancreatic acinar cells from PACIRKO mice.
Representative traces showing POA-induced [Ca2+]i responses (ad) in untreated fura-2-loaded pancreatic acinar cells (a, c) and following pre-treatment with 10 nM insulin for 15 min (b, d) from IRlox/lox (a, b) and PACIRKO (c, d). Cells were also subsequently treated with 30 pM CCK to test for recoverability and thus cell viability post-POA treatment. Mean (±SEM) maximum increase in resting [Ca2+]i above baseline (e) and mean (±SEM) area under the curve (AUC; f) over the treatment and recovery period in the absence (dark grey bars) or following treatment with 10 nM insulin (light grey bars). Significance (specific p values as indicated) was determined by one-way ANOVA with Sidak’s multiple comparisons. Data were derived from individual values from multiple cells (6-36 cells per experiment) in the field of view for each experiment. These values were averaged giving the experimental mean, that were in turn averaged across multiple experiments (four separate experiments for each experimental condition, except PACIRKO with POA, n = 5) giving the true mean ± SEM as indicated in (e, f).
Fig. 6
Fig. 6. Insulin-mediated protection against palmitoleic acid-induced inhibition of the PMCA is abolished in pancreatic acinar cells from PACIRKO mice.
Representative traces showing time-matched control in situ [Ca2+]i clearance experiments (a, d) and the effect of POA (b, e) on [Ca2+]i clearance in untreated cells (b, e) and cells pre-treated with 10 nM insulin (c, f) in pancreatic acinar cells from IRlox/lox (ac) and PACIRKO mice (df). Cells were treated with 30 μM CPA (arrow) in the absence of external Ca2+ (1 mM EGTA; white bar) or 20 mM Ca2+ (grey bar) to induce store-operated Ca2+ influx phases. POA was added prior to the re-addition of 20 mM external Ca2+.during the second influx-clearance phase (black bar). Inset dashed box (af) shows superimposed expanded time-courses of first (black trace) and second clearance phase (grey trace). Traces are representative of 5 (IRlox/lox time-matched control, a), 4 (IRlox/lox POA, b), 3 (IRlox/lox POA with insulin, c), 5 (PACIRKO time-matched control, d). 4 (PACIRKO POA, e) and 5 (PACIRKO POA with insulin, f) separate experiments. Linear clearance rate (in the presence of POA) was normalized to the initial clearance rate in each cell (% relative clearance rate). g Mean % relative clearance (±SEM) of corresponding time-matched control (white bar), POA treatment (30 μM; dark grey bar), and POA with insulin (light grey bar). Significance (specifc p values as indicated) was determined by one-way ANOVA with Sidak’s multiple comparisons. Data were derived from individual values from multiple cells (3-19 cells per experiment) in the field of view for each experiment. These values were averaged giving the experimental mean, that were in turn averaged across multiple experiments giving the true mean ± SEM as indicated in (g).
Fig. 7
Fig. 7. Insulin-mediated protection of POA-induced ATP depletion and switch from mitochondrial metabolism to glycolysis was abolished in PACIRKO mice.
POA concentration-response curves for ATP depletion in the absence and presence of insulin (10 nM) in pancreatic acinar cells isolated from IRlox/lox (a) and PACIRKO mice (b) and corresponding mean IC50 values (±SEM) (c). Mean data are from eight separate experiments. Significance (exact p values as indictated) was determined by repeated measures one-way ANOVA with Sidak’s multiple comparisons. NADH autofluorescence was used to assess the relative mitochondrial vs glycolytic metabolism in pancreatic acinar cells isolated from IRlox/lox (d, e) and PACRIKO mice (g, h). Sequential background-subtracted images were acquired every 5 s (500 ms exposure), and changes in NADH autofluorescence were quantified as raw fluorescence grey levels. To determine the relative mitochondrial and glycolytic contributions to NADH autofluorescence, the cells were treated with 4 μM CCCP and then 2 mM iodoacetate (IAA), respectively, and responses were normalised to the total (f, IRlox/lox; i, PACIRKO). Mean data (±SEM) from four separate experiments for each experimental condition, except IRlox/lox with insulin (n = 7). Significance (specifc p values as indicated) was determined by either repeated measures (c) or ordinary one-way ANOVA (f, i) with Sidak’s multiple comparisons.
Fig. 8
Fig. 8. Insulin increases Akt phosphorylation and the downstream Akt-mediated phosphorylation of the key glycolytic enzyme, PFKFB2, which is abolished in acinar cells from PACIRKO mice.
Pancreatic acinar cells from IRlox/lox (ac), PACIRKO (ac) or Elast-Cre (df) were treated with or without 10 nM insulin and/or the PI3K inhibitor, LY294002 (10 μM) for 10 min followed by cell lysis. Proteins were separated by SDS-PAGE and western blotted using antibodies for the insulin receptor (IR, a, c and e), phospho-Akt (Ser473) (a, d), total Akt (b, e) and phospho-PFKFB2 (Ser483) (c and f), which recognizes the specific Akt consensus phosphorylation site. For each representative experiment shown (af) separate gels were run and each membrane cut and incubated with each corresponding antibody either in parallel or in series, including IR, Akt, pAkt(S473), pFKFB2 and the loading control actin. These were all sufficiently separated so that they could be resolved on the same gel. Each experiment shown (af) is representative of at least three independent experiments.
Fig. 9
Fig. 9. Caerulein infusion-induced increase in plasma amylase is reduced by insulin infusion with tight glycaemic control using the hyperinsulinaemic euglycaemic clamp.
C57BL/6 mice were catheterized via the carotid artery and jugular vein under recover anaesthesia to allow the continuous infusion of caerulein (to induce acute pancreatic injury), insulin (12 mU/kg/min) and glucose (variable rate) to maintain euglycaemia. Caerulein-induced acute pancreatic injury was experimentally induced by continuous infusion of caerulein (50 μg/kg/h) over 5 h and plasma amylase was assessed as an early and immediate readout of pancreatic injury during the course of the experiment (e) and at the end (f). Mice were separated into 4 groups of 6 mice receiving insulin alone (a), caerulein and insulin (b, insulin added 2 h into the caerulein infusion), caerulein alone (c) or saline control (d). For clarity, data are presented as mean ± SEM assessed every 10 min during the entire 5 h. The same data are presented as dot plots showing the full data distribution with lines connecting the mean in Fig. S10. The effect of different caerulein administration regimes were compared on plasma amylase at 0, 1 h, 3 h and 5 h (mean plasma amylase ± SEM from groups of 4 mice, e) including; bolus caerulein injection (via IV line) every hour (open square), low dose continuous caerulein infusion (10 μg/kg/h) and high dose continuous caerulein infusion (50 μg/kg/h). This higher dose continuous caerulein infusion (50 μg/kg/h) induced the maximum increase in plasma amylase at 5 h and was therefore used in combination with the hyperinsulinaemic euglycaemic clamp (b). Mean plasma amylase (±SEM) from 4 groups of 6 mice measured at 0 and 5 h in saline control, caerulein alone, caerulein with insulin infusion and insulin infusion alone (f). Significance (exact p values as indicated) was determined by one-way ANOVA with Sidak’s multiple comparisons.
Fig. 10
Fig. 10. Cartoon depicting the putative molecular mechanism for insulin protection of pancreatic acinar cells during acute pancreatitis.
Pancreatitis inducing agents, such as fatty acid/ethanol metabolite palmitoleic acid (POA) impair metabolism, most notably mitochondrial function, leading to ATP depletion and inhibition of Ca2+ clearance pathways, such as the plasma membrane Ca2+ ATPase (PMCA), leading to cytotoxic Ca2+ overload. The net effect of ATP depletion and cytotoxic Ca2+ overload is rapid necrotic cell death, a major hallmark of acute pancreatitis. Insulin binding to the insulin receptor leads to the downstream activation of the PI3K/Akt signalling pathway and the direct Akt-mediated phosphorylation and activation of the key glycolytic enzyme, phosphofructokinase fructose bisphosphatase-2 (PFKFB2). This leads to the production of the key glycolytic metabolite fructose 2,6-bisphosphate, which is an allosteric activator of the rate limiting phosphofructokinase-1 (PFK1), which in turn drives glycolytic flux and thus glycolytic ATP production and supply to the PMCA. This appears to be sufficient to maintain acinar cell ATP and prevent inhibition of the PMCA, even in the face of impaired mitochondrial function, thereby protecting against necrotic cell death and the self-perpetuating tissue injury and spiralling inflammatory response characteristic of acute pancreatitis. During diabetes (Ins2Akita mice) and in PACIRKO mice, this endogenous insulin protection is abolished, leading to more severe acute pancreatitis. Moreover, exogenous insulin administration, using the hyperinsulinaemic euglycaemic clamp to infuse high dose insulin while maintaining close glucose control, ameliorates or protects against further pancreatic injury suggesting a potential therapy for severe acute pancreatitis.

Comment in

References

    1. Petersen OH, et al. Fatty acids, alcohol and fatty acid ethyl esters: toxic Ca2+ signal generation and pancreatitis. Cell Calcium. 2009;45:634–642. doi: 10.1016/j.ceca.2009.02.005. - DOI - PubMed
    1. Peery AF, et al. Burden of gastrointestinal disease in the United States: 2012 update. Gastroenterology. 2012;143:1179–1187 e3. doi: 10.1053/j.gastro.2012.08.002. - DOI - PMC - PubMed
    1. Banks PA, et al. Classification of acute pancreatitis–2012: revision of the Atlanta classification and definitions by international consensus. Gut. 2013;62:102–111. doi: 10.1136/gutjnl-2012-302779. - DOI - PubMed
    1. Bradley EL., 3rd A clinically based classification system for acute pancreatitis. Summary of the International Symposium on Acute Pancreatitis, Atlanta, Ga, September 11 through 13, 1992. Arch. Surg. 1993;128:586–590. doi: 10.1001/archsurg.1993.01420170122019. - DOI - PubMed
    1. Mankad P, James A, Siriwardena AK, Elliott AC, Bruce JI. Insulin protects pancreatic acinar cells from cytosolic calcium overload and inhibition of the plasma membrane calcium pump. J. Biol. Chem. 2012;287:1823–1836. doi: 10.1074/jbc.M111.326272. - DOI - PMC - PubMed

Publication types

MeSH terms