. 2021 Jul 19;11(1):14702.
doi: 10.1038/s41598-021-93874-6.

Factors associated with baseline mortality in Norwegian Atlantic salmon farming

Affiliations

Factors associated with baseline mortality in Norwegian Atlantic salmon farming

Victor H S Oliveira et al. Sci Rep. .

Abstract

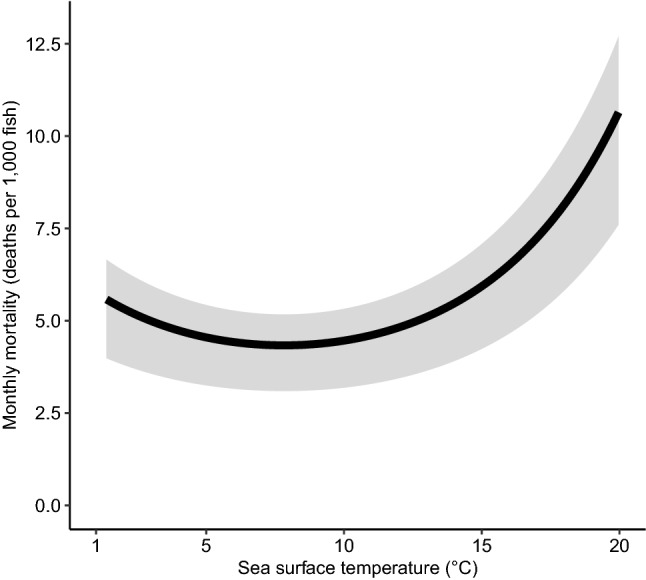
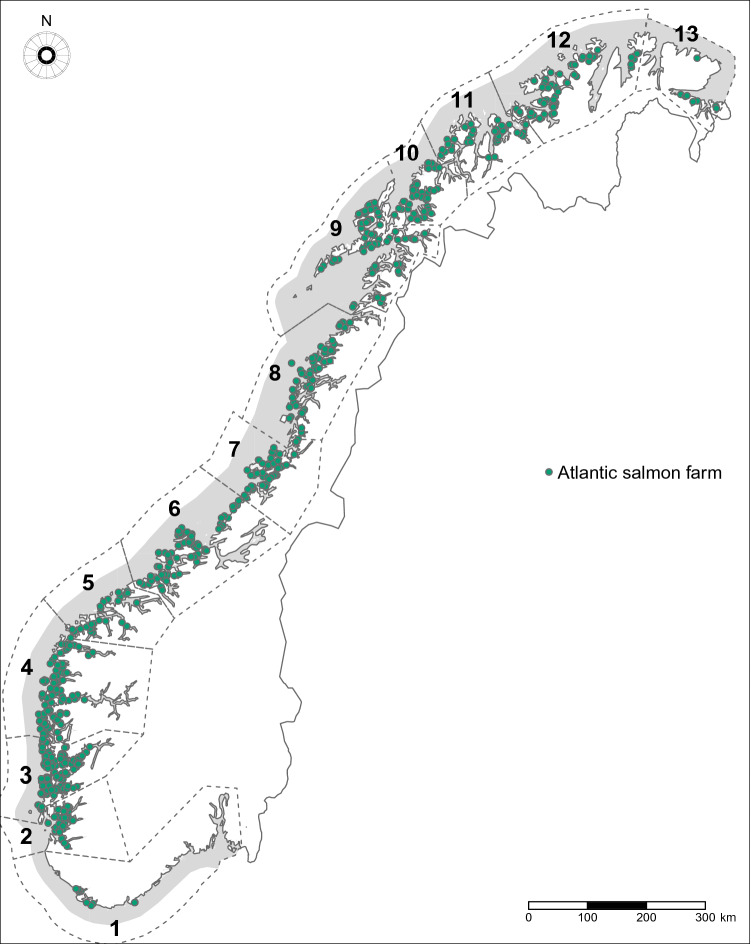
In 2019, it was estimated that more than 50 million captive Atlantic salmon in Norway died in the final stage of their production in marine cages. This mortality represents a significant economic loss for producers and a need to improve welfare for farmed salmon. Single adverse events, such as algal blooms or infectious disease outbreaks, can explain mass mortality in salmon cages. However, little is known about the production, health, or environmental factors that contribute to their baseline mortality during the sea phase. Here we conducted a retrospective study including 1627 Atlantic salmon cohorts put to sea in 2014-2019. We found that sea lice treatments were associated with Atlantic salmon mortality. In particular, the trend towards non-medicinal sea lice treatments, including thermal delousing, increases Atlantic salmon mortality in the same month the treatment is applied. There were differences in mortality among production zones. Stocking month and weight were other important factors, with the lowest mortality in smaller salmon stocked in August-October. Sea surface temperature and salinity also influenced Atlantic salmon mortality. Knowledge of what affects baseline mortality in Norwegian aquaculture can be used as part of syndromic surveillance and to inform salmon producers on farming practices that can reduce mortality.


Conflict of interest statement

The authors declare no competing interests.

Figures

Figure 1
Figure 1
Summaries of monthly mortality distribution between 2014 and 2019 in Norwegian Atlantic salmon farms. The smoothed line is the kernel density estimate, quantiles are represented by colors, the median by the straight line and the mean by the dashed line. This figure was generated using the Tidyverse package in R.
Figure 2
Figure 2
Scatter plots with fitted local polynomial regression (LOESS) curves of mortality versus continuous explanatory variables. *The local biomass density (LBD) of a farm in a certain month is a summarized record of Atlantic salmon biomass (i.e. number of fish multiplied by mean weight) calculated using data from neighboring farms located up to 40 km seaway distance. For full details on LBD calculations, we refer to Jansen et al.. This figure was generated using the Tidyverse and gridExtra packages in R.
Figure 3
Figure 3
Mortality rate ratio plot with the determinants of baseline mortality in farmed Atlantic salmon. Results of other determinants added as polynomial terms in our mortality model are shown in Figs. 4 and 5. This figure was generated using the Tidyverse package in R.
Figure 4
Figure 4
Atlantic salmon mortality predictions from the final model based on sea surface temperature. The lines and shaded areas in the plots show the mean and interquartile range of predicted values, respectively. This figure was generated using the Tidyverse package in R.
Figure 5
Figure 5
Atlantic salmon mortality predictions from the final model based on fish weight and number of sea lice treatments per month. The lines and shaded areas in the plots show the mean and interquartile range of predicted values, respectively. The different colors represent two types of sea lice treatments for comparisons. One is bath treatments using H2O2 or medicinal compounds, such as azamethiphos and pyrethroids. The other is non-medicinal treatments with removal of sea lice by flushing or brushing, warm water or freshwater baths. This figure was generated using the Tidyverse package in R.
Figure 6
Figure 6
Geographical location of Atlantic salmon farms and production zones in Norway. The map shows all commercial farms for the purpose of food production registered between January 2014 and December 2019. The regions delimited by dashed lines represent the production zones 1–13. This map was generated in R, using the R packages sf (version 0.9-7; https://cran.r-project.org/web/packages/sf/sf.pdf) and tmap (version 3.3-1; https://cran.r-project.org/web/packages/tmap/tmap.pdf).
Figure 7
Figure 7
Directed acyclic graph (DAG) showing the putative determinants of baseline mortality in farmed Atlantic salmon. Dashed boxes represent unobserved factors.

Similar articles

Cited by

References

    1. SERNAPESCA (Servicio Nacional de Pesca y Acuicultura). Informe Sanitario de Salmonicultura. http://www.sernapesca.cl/sites/default/files/informe_sanitario_salmonicu... (2018).
    1. Bang Jensen B, Qviller L, Toft N. Spatio-temporal variations in mortality during the seawater production phase of Atlantic salmon (Salmo salar) in Norway. J. Fish Dis. 2020;43:445–457. doi: 10.1111/jfd.13142. - DOI - PubMed
    1. Moriarty M, et al. Modelling temperature and fish biomass data to predict annual Scottish farmed salmon, Salmo salar L., losses: Development of an early warning tool. Prev. Vet. Med. 2020;178:104985. doi: 10.1016/j.prevetmed.2020.104985. - DOI - PubMed
    1. Sommerset, I. et al.The Health Situation in Norwegian Aquaculture 2019. https://www.vetinst.no/rapporter-og-publikasjoner/rapporter/2020/fiskehe... (2020).
    1. Grefsrud, E. S. et al.Risikorapport norsk fiskeoppdrett 2021—risikovurdering. https://www.hi.no/hi/nettrapporter/rapport-fra-havforskningen-2021-8 (2021).

Publication types