

An integrated machine learning framework for a discriminative analysis of schizophrenia using multi-biological data
- PMID: 34282208
- PMCID: PMC8290033
- DOI: 10.1038/s41598-021-94007-9
An integrated machine learning framework for a discriminative analysis of schizophrenia using multi-biological data
Abstract
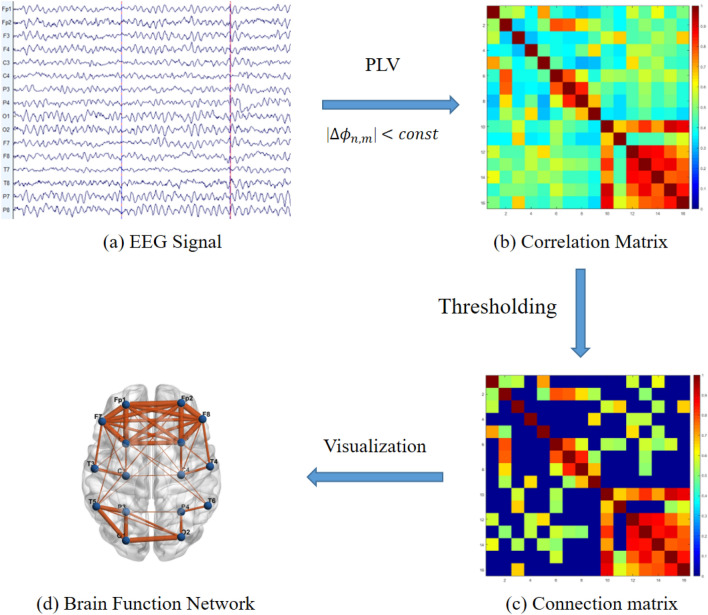
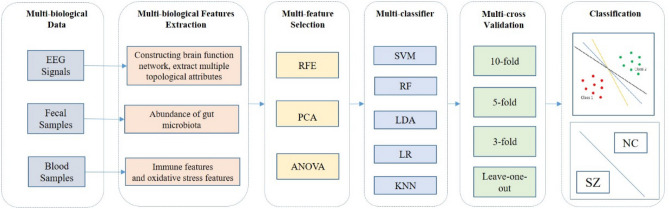
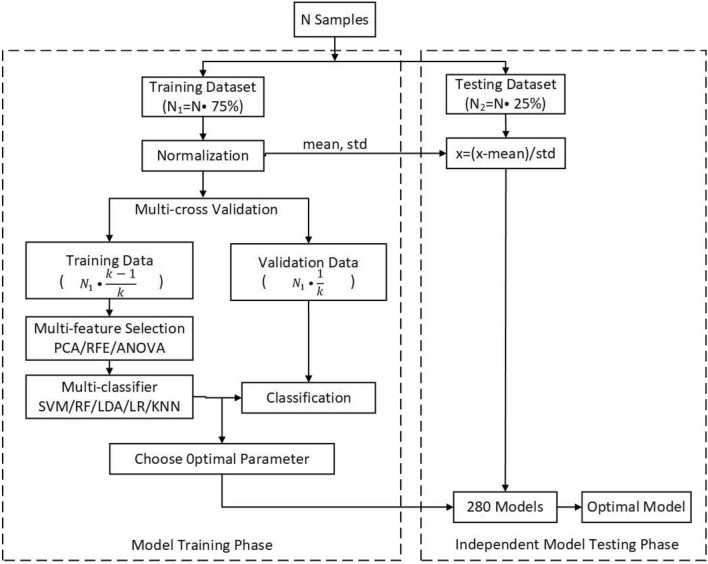
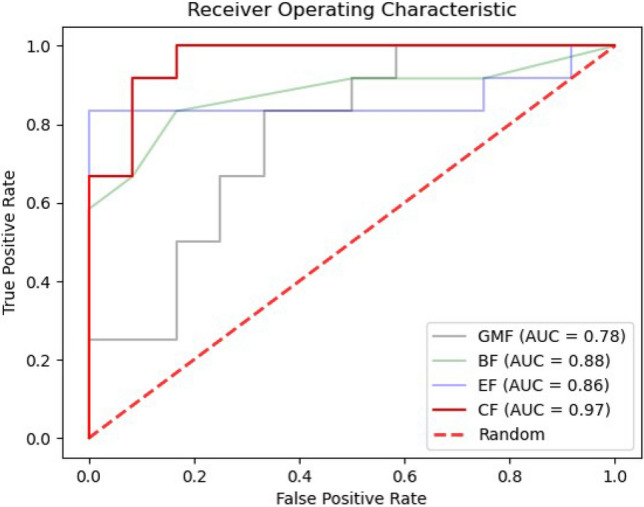
Finding effective and objective biomarkers to inform the diagnosis of schizophrenia is of great importance yet remains challenging. Relatively little work has been conducted on multi-biological data for the diagnosis of schizophrenia. In this cross-sectional study, we extracted multiple features from three types of biological data, including gut microbiota data, blood data, and electroencephalogram data. Then, an integrated framework of machine learning consisting of five classifiers, three feature selection algorithms, and four cross validation methods was used to discriminate patients with schizophrenia from healthy controls. Our results show that the support vector machine classifier without feature selection using the input features of multi-biological data achieved the best performance, with an accuracy of 91.7% and an AUC of 96.5% (p < 0.05). These results indicate that multi-biological data showed better discriminative capacity for patients with schizophrenia than single biological data. The top 5% discriminative features selected from the optimal model include the gut microbiota features (Lactobacillus, Haemophilus, and Prevotella), the blood features (superoxide dismutase level, monocyte-lymphocyte ratio, and neutrophil count), and the electroencephalogram features (nodal local efficiency, nodal efficiency, and nodal shortest path length in the temporal and frontal-parietal brain areas). The proposed integrated framework may be helpful for understanding the pathophysiology of schizophrenia and developing biomarkers for schizophrenia using multi-biological data.
© 2021. The Author(s).
Conflict of interest statement
The authors declare no competing interests.
Figures
Similar articles
-
Biological age prediction in schizophrenia using brain MRI, gut microbiome and blood data.Brain Res Bull. 2025 Jun 15;226:111363. doi: 10.1016/j.brainresbull.2025.111363. Epub 2025 Apr 27. Brain Res Bull. 2025. PMID: 40300657
-
Discriminative analysis of resting-state functional connectivity patterns of schizophrenia using low dimensional embedding of fMRI.Neuroimage. 2010 Feb 15;49(4):3110-21. doi: 10.1016/j.neuroimage.2009.11.011. Epub 2009 Nov 18. Neuroimage. 2010. PMID: 19931396
-
Evaluation of machine learning algorithms and structural features for optimal MRI-based diagnostic prediction in psychosis.PLoS One. 2017 Apr 20;12(4):e0175683. doi: 10.1371/journal.pone.0175683. eCollection 2017. PLoS One. 2017. PMID: 28426817 Free PMC article.
-
Role of different omics data in the diagnosis of schizophrenia disorder: A machine learning study.Schizophr Res. 2024 Sep;271:38-46. doi: 10.1016/j.schres.2024.07.026. Epub 2024 Jul 14. Schizophr Res. 2024. PMID: 39003990 Review.
-
Sparse representation based biomarker selection for schizophrenia with integrated analysis of fMRI and SNPs.Neuroimage. 2014 Nov 15;102 Pt 1:220-8. doi: 10.1016/j.neuroimage.2014.01.021. Epub 2014 Feb 12. Neuroimage. 2014. PMID: 24530838 Free PMC article. Review.
Cited by
-
Evaluation of Risk of Bias in Neuroimaging-Based Artificial Intelligence Models for Psychiatric Diagnosis: A Systematic Review.JAMA Netw Open. 2023 Mar 1;6(3):e231671. doi: 10.1001/jamanetworkopen.2023.1671. JAMA Netw Open. 2023. PMID: 36877519 Free PMC article.
-
Discriminative Analysis of Schizophrenia Patients Using Topological Properties of Structural and Functional Brain Networks: A Multimodal Magnetic Resonance Imaging Study.Front Neurosci. 2022 Jan 11;15:785595. doi: 10.3389/fnins.2021.785595. eCollection 2021. Front Neurosci. 2022. PMID: 35087373 Free PMC article.
-
Assisting schizophrenia diagnosis using clinical electroencephalography and interpretable graph neural networks: a real-world and cross-site study.Neuropsychopharmacology. 2023 Dec;48(13):1920-1930. doi: 10.1038/s41386-023-01658-5. Epub 2023 Jul 25. Neuropsychopharmacology. 2023. PMID: 37491671 Free PMC article.
-
Sampling inequalities affect generalization of neuroimaging-based diagnostic classifiers in psychiatry.BMC Med. 2023 Jul 3;21(1):241. doi: 10.1186/s12916-023-02941-4. BMC Med. 2023. PMID: 37400814 Free PMC article.
-
A novel blood-based epigenetic biosignature in first-episode schizophrenia patients through automated machine learning.Transl Psychiatry. 2024 Jun 17;14(1):257. doi: 10.1038/s41398-024-02946-4. Transl Psychiatry. 2024. PMID: 38886359 Free PMC article.
References
Publication types
MeSH terms
Substances
LinkOut - more resources
Full Text Sources
Medical
