. 2021 Jul 19;11(1):14714.
doi: 10.1038/s41598-021-94163-y.

Single-cell transcriptomic profile of human pulmonary artery endothelial cells in health and pulmonary arterial hypertension

Affiliations

Single-cell transcriptomic profile of human pulmonary artery endothelial cells in health and pulmonary arterial hypertension

Kewal Asosingh et al. Sci Rep. .

Erratum in

Abstract

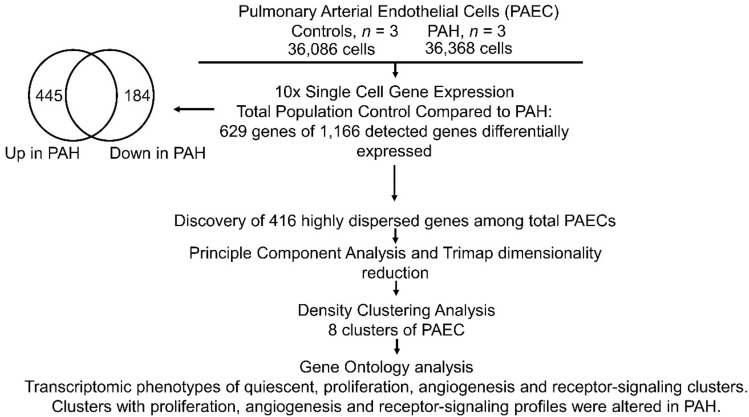
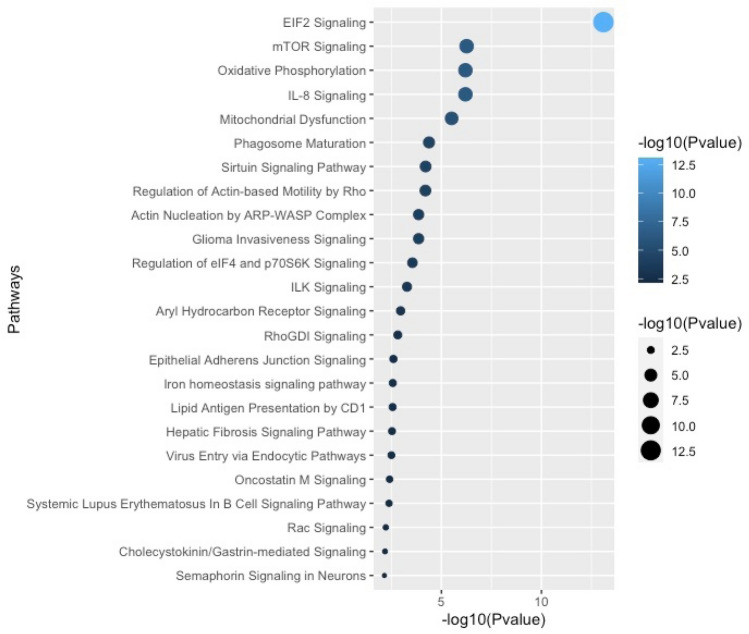
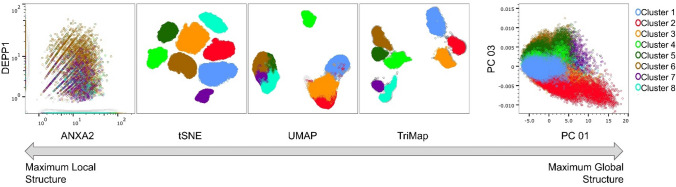
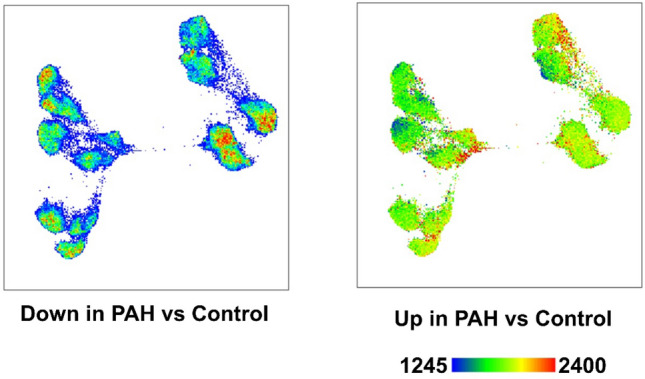
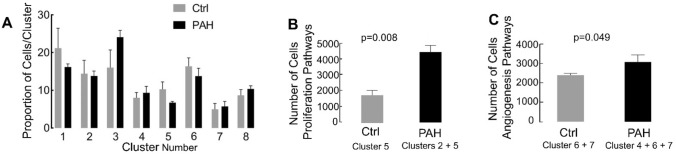
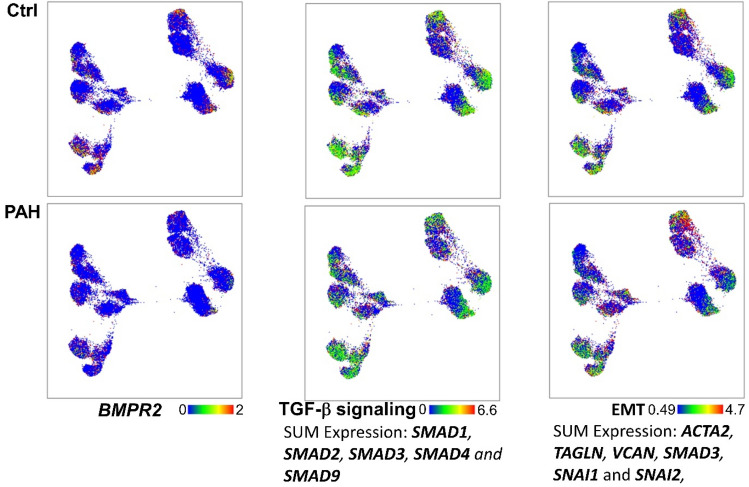
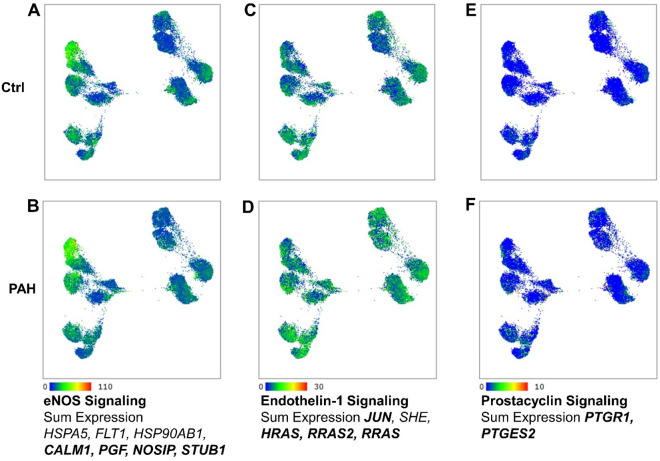
Pulmonary arterial hypertension (PAH) is an insidious disease characterized by severe remodeling of the pulmonary vasculature caused in part by pathologic changes of endothelial cell functions. Although heterogeneity of endothelial cells across various vascular beds is well known, the diversity among endothelial cells in the healthy pulmonary vascular bed and the pathologic diversity among pulmonary arterial endothelial cells (PAEC) in PAH is unknown and previously unexplored. Here single-cell RNA sequencing technology was used to decipher the cellular heterogeneity among PAEC in the human pulmonary arteries isolated from explanted lungs from three patients with PAH undergoing lung transplantation and three healthy donor lungs not utilized for transplantation. Datasets of 36,368 PAH individual endothelial cells and 36,086 healthy cells were analyzed using the SeqGeq bioinformatics program. Total population differential gene expression analyses identified 629 differentially expressed genes between PAH and controls. Gene Ontology and Canonical Ingenuity analysis revealed pathways that are known to be involved in pathogenesis, as well as unique new pathways. At the individual cell level, dimensionality reduction followed by density based clustering revealed the presence of eight unique PAEC clusters that were typified by proliferative, angiogenic or quiescent phenotypes. While control and PAH harbored many similar subgroups of endothelial cells, PAH had greater proportions of angiogenic and proliferative subsets. These findings identify that only specific subgroups of PAH PAEC have gene expression different than healthy PAEC, and suggest these subpopulations lead to the pathologic functions leading to remodeling.


Conflict of interest statement

The authors declare no competing interests.

Figures

Figure 1
Figure 1
Overall work flow differential gene expression and clustering analysis. 10 × Single-Cell Omics was performed on PAEC derived from 3 control and 3 PAH lungs. The total number of cells in each sample was 36 K. Global gene expression analysis between the total populations of control and PAH cells revealed that 629 genes from 1,116 detected genes were differentially expressed. Among these, 445 genes were upregulated and 184 were downregulated in PAH. 416 highly dispersed genes were found in the total control and PAH population. Principle Component Analysis followed by Trimap dimentionality reduction was performed to depict the high-dimentional data in a two-dimentional space. Density Clustering Analysis identified 8 clusters of cells among control and PAH PAEC. Differential gene expression analysis of clusters in each sample, followed by gene ontology analysis of the differentially expressed genes showed that there were 4 transcriptomic profiles among the 8 clusters of PAECs. Three PAH clusters had an altered profile compared to the corresponding control cluster.
Figure 2
Figure 2
Ingenuity pathway analysis of genes differentially expressed between the total population of control and PAH PAECs. Differential expression analyses revealed 629 genes. These were used for canonical pathway ingenuity analyses.
Figure 3
Figure 3
Dimensionality reduction using all genes in all cells. Dimensionality reduction summarizes the heterogeneous populations in a high dimensional space in a two-dimensional embedding. The DEPP1/ANXA2 plot depict the expression of the two genes in the different clusters in a two-dimensional embedding. The tSNE, UMAP, TriMAP and PC plots depict the expression of all genes in higher dimensional space in a two-dimensional embedding. Thus, from left to right the data depicts maximum local structure (for example the needles on a pine tree) to maximum global structure (for example the clusters of pine trees in a pine forest). Eight clusters were identified by visual inspection of the TriMap space.
Figure 4
Figure 4
Distribution of the 629 differentially expressed genes across clusters. TriMap space showing genes down (left figure) and up (right figure) regulated in PAH. The differentially expressed genes did not localize in a single cluster, but were spread across all clusters.
Figure 5
Figure 5
Segregation of control and PAH PAEC clustering. TriMap clustering was performed on the total PAEC population. Control and PAH cells were then segregated based on their unique sample IDs. Differential gene expression analysis was performed between each cluster and the remaining cells, not part of that specific cluster, within control and PAH PAEC populations. Gene Ontology Term Enrichment Analysis was then performed on these differentially expressed gen-sets. Each cluster was named based on key identified pathways (A,B). Clusters 2, 4, 8 were different between control and PAH. Genes differentially expressed in PAH clusters compared to the corresponding control cluster are shown (Up regulated genes in bold) Q quiescent; P proliferation; A angiogenesis, and R receptor-signaling(C).
Figure 6
Figure 6
Increased angioproliferative cells in PAH. The mean frequency of each cluster, calculated based on the cluster frequency in the individual samples, was similar between control and PAH (A). The total number of cells in the clusters enriched in proliferation pathways (cluster 2 in control, and clusters 2 and 3 in PAH), was significantly increased in PAH (B). The total number of cells in clusters enriched in angiogenic pathways (clusters 6 and 7 in control, and clusters 5, 6, and 7 in PAH), was significantly higher in PAH (C).
Figure 7
Figure 7
BMPR2, TGF-β signaling genes and Endothelial-to-Mesenchymal Transition markers. BMPR2 and sum expression of genes in TGF-β pathway and Endothelial-to-Mesenchymal Transition (EMT) is shown. Genes in bold were down-regulated in the total PAH PAEC population.
Figure 8
Figure 8
Genes in therapeutic pathways. Genes involved in eNOS (A,B), endothelin-1 (C,D) and prostacyclin (E,F) signaling pathways. Sum expression in each pathway is shown. Genes in bold were upregulated in the total PAH PAEC population.

References

    1. Rabinovitch M. Molecular pathogenesis of pulmonary arterial hypertension. J. Clin. Invest. 2008;118:2372–2379. doi: 10.1172/JCI33452. - DOI - PMC - PubMed
    1. Xu W, et al. Increased arginase II and decreased NO synthesis in endothelial cells of patients with pulmonary arterial hypertension. FASEB J. 2004;18:1746–1748. doi: 10.1096/fj.04-2317fje. - DOI - PubMed
    1. Fijalkowska I, et al. Hypoxia inducible-factor1alpha regulates the metabolic shift of pulmonary hypertensive endothelial cells. Am. J. Pathol. 2010;176:1130–1138. doi: 10.2353/ajpath.2010.090832. - DOI - PMC - PubMed
    1. Xu W, et al. Alterations of cellular bioenergetics in pulmonary artery endothelial cells. Proc. Natl. Acad. Sci. USA. 2007;104:1342–1347. doi: 10.1073/pnas.0605080104. - DOI - PMC - PubMed
    1. Xu W, Erzurum SC. Endothelial cell energy metabolism, proliferation, and apoptosis in pulmonary hypertension. Compr. Physiol. 2011;1:357–372. doi: 10.1002/cphy.c090005. - DOI - PMC - PubMed

Publication types