. 2021 Jul 19;11(1):14644.
doi: 10.1038/s41598-021-94183-8.

Blood glutamate scavengers increase pro-apoptotic signaling and reduce metastatic melanoma growth in-vivo

Affiliations

Blood glutamate scavengers increase pro-apoptotic signaling and reduce metastatic melanoma growth in-vivo

Yona Goldshmit et al. Sci Rep. .

Abstract

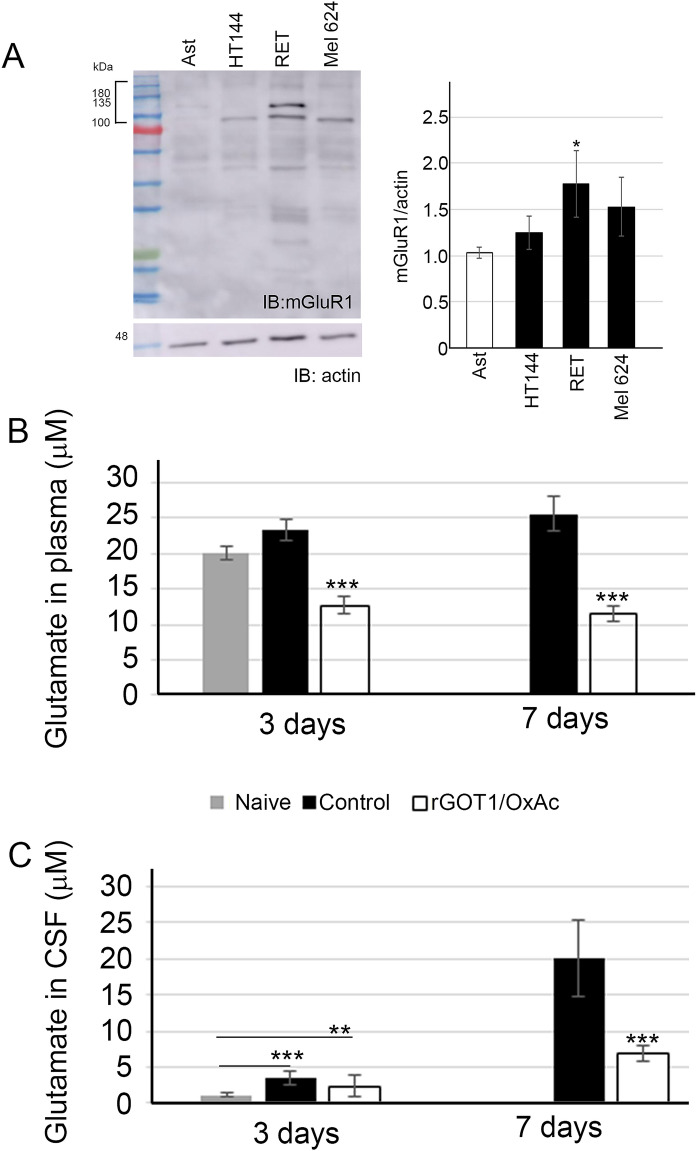
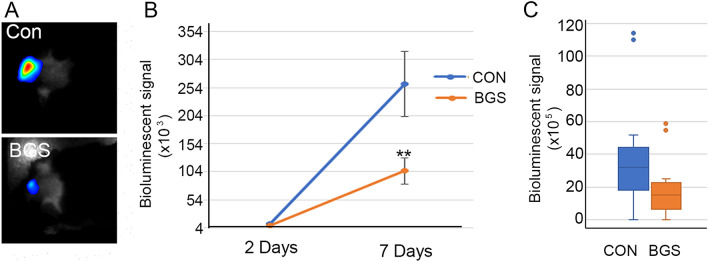
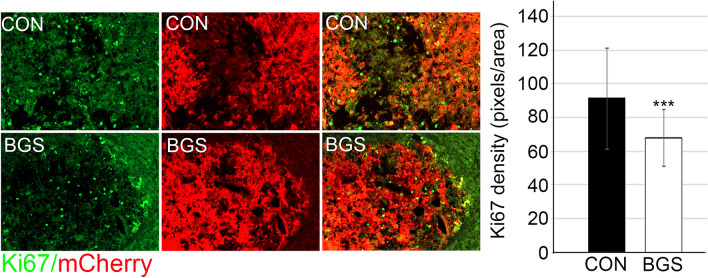
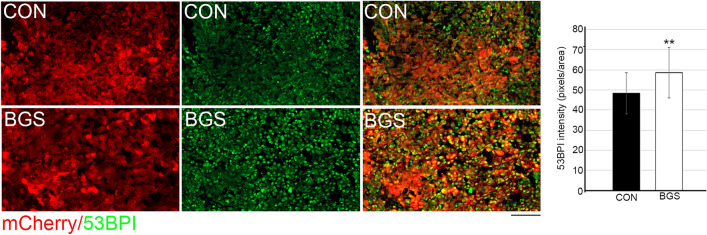
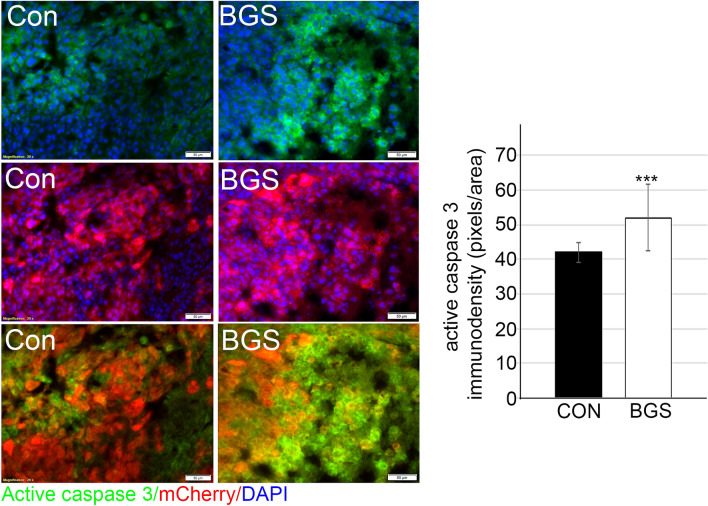
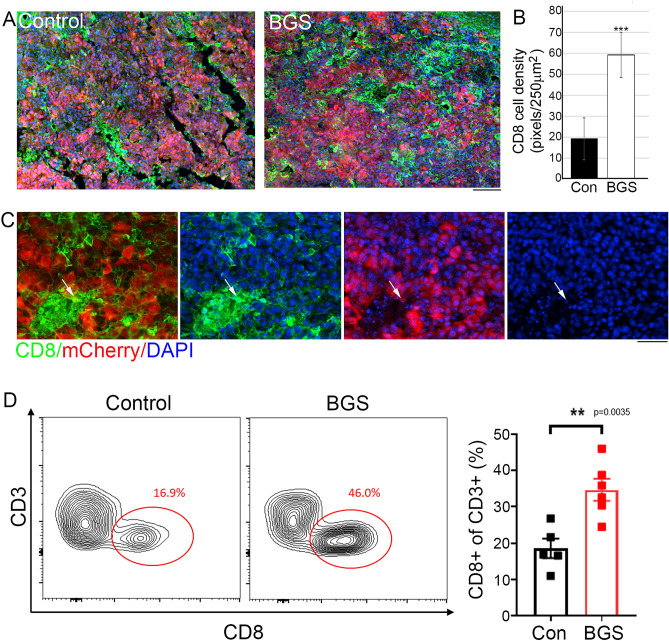
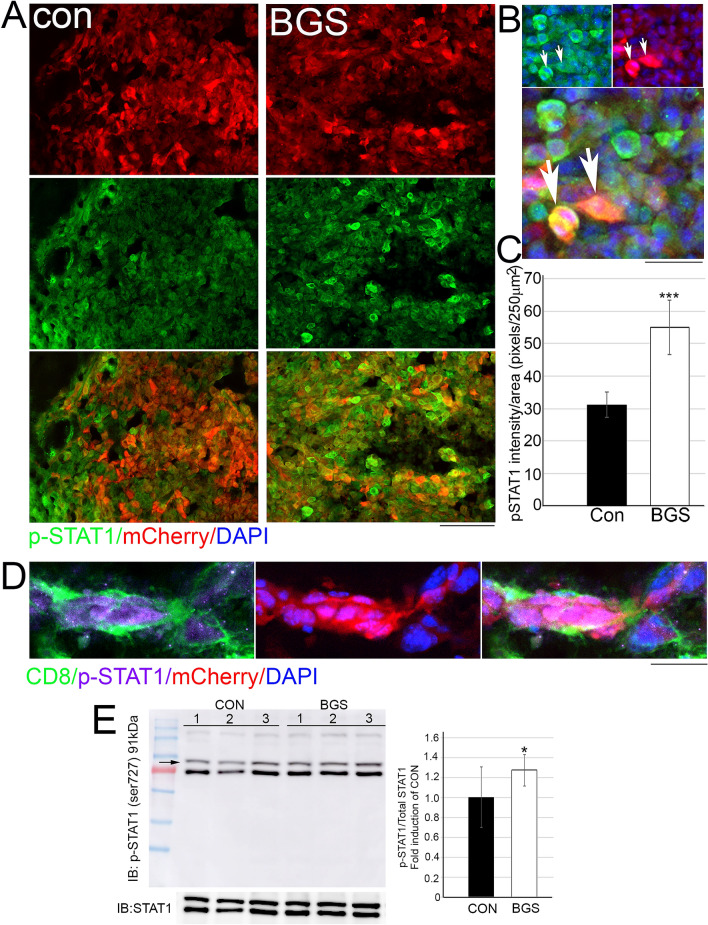
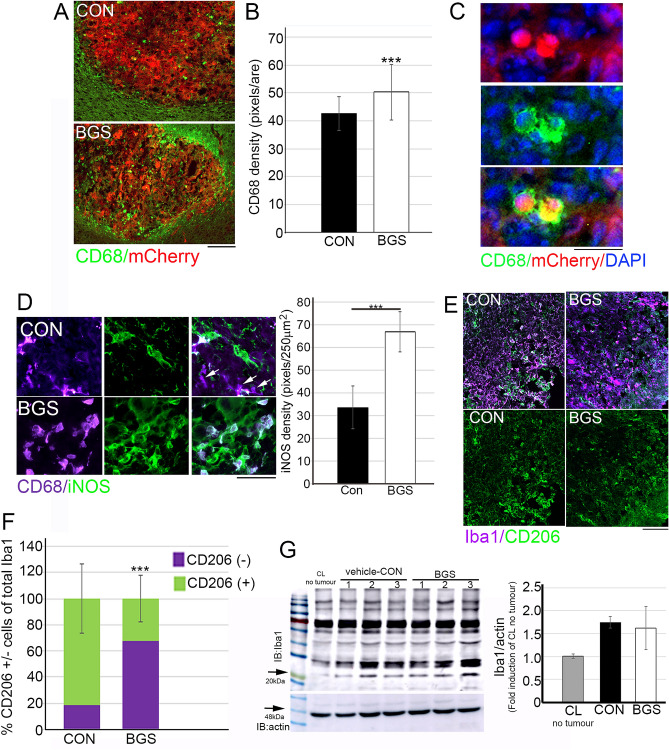
Inhibition of extracellular glutamate (Glu) release decreases proliferation and invasion, induces apoptosis, and inhibits melanoma metastatic abilities. Previous studies have shown that Blood-glutamate scavenging (BGS), a novel treatment approach, has been found to be beneficial in attenuating glioblastoma progression by reducing brain Glu levels. Therefore, in this study we evaluated the ability of BGS treatment to inhibit brain metastatic melanoma progression in-vivo. RET melanoma cells were implanted in C56BL/6J mice to induce brain melanoma tumors followed by treatment with BGS or vehicle administered for fourteen days. Bioluminescent imaging was conducted to evaluate tumor growth, and plasma/CSF Glu levels were monitored throughout. Immunofluorescence staining of Ki67 and 53BP1 was used to analyze tumor cell proliferation and DNA double-strand breaks. In addition, we analyzed CD8, CD68, CD206, p-STAT1 and iNOS expression to evaluate alterations in tumor micro-environment and anti-tumor immune response due to treatment. Our results show that BGS treatment reduces CSF Glu concentration and consequently melanoma growth in-vivo by decreasing tumor cell proliferation and increasing pro-apoptotic signaling in C56BL/6J mice. Furthermore, BGS treatment supported CD8+ cell recruitment and CD68+ macrophage invasion. These findings suggest that BGS can be of potential therapeutic relevance in the treatment of metastatic melanoma.


Conflict of interest statement

The authors declare no competing interests.

Figures

Figure 1
Figure 1
Reduced glutamate levels in the blood and CSF followed by BGS treatment. (A) Western blot analysis of mGluR1 expression in different melanoma cell lines. The human astrocyte line was used as a control for a cell line that expresses high levels of mGluR1; the HT144 human melanoma cell line; the RET mouse melanoma cell line; and Mel 624 is patients’ derivative cells from the surgical branch of the NIH. Total cell lysates were immunoblotted with mGluR1 and anti-actin antibody in order to determine the fold induction of mGuR1 levels in melanoma cell lines compared to astrocytes (used as a control). Results are presented as mean ± SD (n = 3 experiments; *p < 0.05). (B) Levels of glutamate in the blood of control vs. BGS treated mice i.c. injected with 2 μl of RET melanoma cells (5 × 103/2 μl). Blood samples at day 3 and 7 after tumor cell implantation (n = 5 animals/time-point; n = 5 naive mice). (C) Glutamate levels in the CSF of control vs. BGS treated mice i.c. injected with RET melanoma cells. CSF samples at day 3 and 7 after the tumor cell implantation (n = 5 animals/time-point). Results are presented as mean ± SD (n = 5 animals/group; n = 5 naive mice; **p < 0.01, ***p < 0.001).
Figure 2
Figure 2
Reduction in tumor size in BGS treated mice. Animals were injected with Luc2-mCherry-labeled RET melanoma cells (5 × 103/2 μl) and examined by bioluminescence imaging at day 2, 7 and 14 after the i.c. cell implantation. (A) A representative image of 7 days. (B) BGS treated animals show a significant decrease in tumor size at day 7 post implantation compared to the vehicle-control mice. (C) BGS treated animals show a trend (not significant) of a decrease in tumor size at day 14 post implantation compared to the vehicle-control mice. Results are expressed as mean ± SD with two-tailed unpaired Student t tests for day 2 and 7, and as median ± interquartile range with a Mann–Whitney U test for day 14 (n = 10 mice/group). Images on the left demonstrate a representative image of tumor size in BGS treated mice (lower panel) vs. untreated mice (upper panel) for day 7.
Figure 3
Figure 3
BGS treatment inhibited RET cell proliferation. Representative images of the control and BGS treatments for Ki67 proliferating marker expression (green) in the tumor (mCherry). Ki67 density is significantly reduced in the BGS-treated group compared to the control group. Results are presented as mean ± SD (n = 7 animals/group; ***p < 0.001). Scale bar 200 µm.
Figure 4
Figure 4
BGS treatment increased RET melanoma cell DNA damage. Representative images of the control and BGS treatments for 53BP1 DNA damage and tumor suppressor marker expression (green) in the tumor (mCherry). 53BP1 density is significantly increased in the BGS-treated group compared to the control group. Results are presented as mean ± SD (n = 7 animals/group; **p < 0.01). Scale bar 200 µm.
Figure 5
Figure 5
BGS treatment increases RET cell apoptosis. Representative images of the control and BGS treatments for active caspase-3 apoptotic marker expression (green) in the tumor (mCherry). Active caspase-3 density is significantly increased in the BGS-treated group compared to the control group. Results are presented as mean ± SD (n = 7 animals/group; ***p < 0.001). Scale bar 50 µm.
Figure 6
Figure 6
BGS treatment increased CD8 + cells invasion into the tumor. (A) Representative images of the control and BGS treatments for CD8+ cells (green) in the tumor (mCherry). Scale bar 200 µm. (B) CD8+ cell density is significantly increased in the BGS-treated group compared to the control group. Results are presented as mean ± SD (n = 7 animals/group; ***p < 0.001). (C) Arrows indicate an example of a CD8+ cell phagocyte mCherry positive RET melanoma cell, scale bar 50 µm. (D) Flow cytometry analysis of CD3+CD8+cell frequency in the tumours. Results are presented as mean ± SD (n = 5 brain tumors/each group; **p < 0.0035) from two independent experiments.
Figure 7
Figure 7
BGS treatment increased p-STAT1 levels in the RET melanoma cells surrounded by CD8+ cells. Seven days after RET cell injection (A) Representative images of the control and BGS treatments for p-STAT1 signaling in the tumor cells (mCherry), scale bar 200 µm. (B) High power magnification of co-localization of p-STAT1 (green) and mCherry RET melanoma cell (red), scale bar 25 µm. (C) p-STAT1 density is significantly increased in the BGS-treated group compared to the control group. Results are presented as mean ± SD (n = 7 animals/group; ***p < 0.001). (D) An example of a CD8+ cell (green) surrounding a mCherry positive RET melanoma cell (red) demonstrated up-regulated p-STAT1 (purple), scale bar 25 µm. (E) Tumour lysates from (n = 5 animals/group) were immunoblotted with p-STAT1 (s727) and total anti-STAT1 antibody in order to determine the fold induction of p-STAT1 levels in BGS treated compared to vehicle-control. Results are presented as mean ± SD (*p < 0.05).
Figure 8
Figure 8
BGS treatment increased CD68+ macrophage intratumor invasion and iNOS recreation. (A) Representative images of the control and BGS treatments for CD68+ macrophage invasion into the tumor (mCherry), scale bar 200 µm. (B) CD68+ cell density is significantly increased in the BGS-treated group compared to the control group. Results are presented as mean ± STDEV (n = 7 animals/group; ***p < 0.001). (C) An example of CD68+ cell phagocyte mCherry positive RET melanoma cells, scale bar 25 µm. (D) Double immunostaining of CD68+ with iNOS demonstrated that in the BGS treatment group most CD68+ cells were co-labeled with iNOS as opposed to the control group where significantly less iNOS expression was detected on the CD68+ cells and overall. Results are presented as mean ± SD (n = 7 animals/group; ***p < 0.001). Scale bar 50 µm. (E) Double immunostaining of CD206 and IBA-1 demonstrated that in the BGS treated group significantly lower number of CD206+IBA1+ cells as opposed to the control group where significantly higher number CD206 expression was detected on the Iba1 expressing cells. (F) Results are presented as mean ± SD (n = 5 animals/group; ***p < 0.001). Scale bar 100 µm. (G) Tumour lysates from (n = 5 animals/group) were immunoblotted with Iba1 and actin Abs in order to demonstrated that Iba1 levels were no different between BGS treated compared to vehicle-control. Results are presented as mean ± SD.

Similar articles

Cited by

References

    1. Takano T, et al. Glutamate release promotes growth of malignant gliomas. Nat. Med. 2001;7:1010–1015. doi: 10.1038/nm0901-1010. - DOI - PubMed
    1. Sontheimer H. Malignant gliomas: Perverting glutamate and ion homeostasis for selective advantage. Trends Neurosci. 2003;26:543–549. doi: 10.1016/j.tins.2003.08.007. - DOI - PubMed
    1. Robert SM, Sontheimer H. Glutamate transporters in the biology of malignant gliomas. Cell Mol. Life Sci. 2014;71:1839–1854. doi: 10.1007/s00018-013-1521-z. - DOI - PMC - PubMed
    1. de Groot J, Sontheimer H. Glutamate and the biology of gliomas. Glia. 2011;59:1181–1189. doi: 10.1002/glia.21113. - DOI - PMC - PubMed
    1. Ruban A, Berkutzki T, Cooper I, Mohar B, Teichberg VI. Blood glutamate scavengers prolong the survival of rats and mice with brain-implanted gliomas. Investig. New Drugs. 2012;30:2226–2235. doi: 10.1007/s10637-012-9799-5. - DOI - PMC - PubMed

Publication types

MeSH terms