. 2021 Jul 19;11(1):14733.
doi: 10.1038/s41598-021-94282-6.

Extracellular detection of neuronal coupling

Affiliations

Extracellular detection of neuronal coupling

Elmer Guzman et al. Sci Rep. .

Abstract

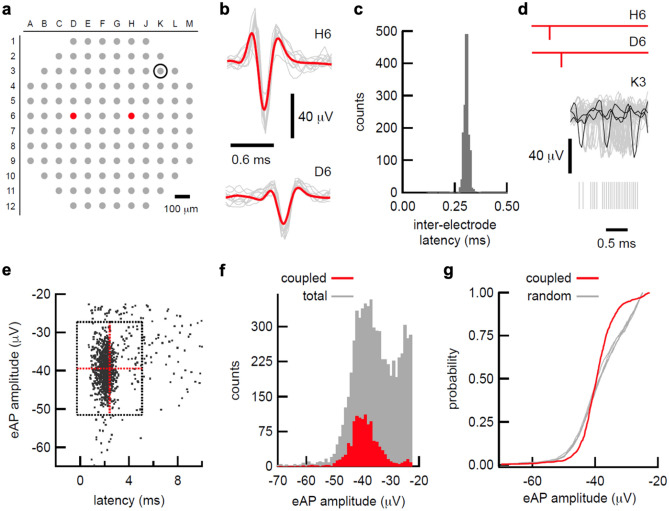
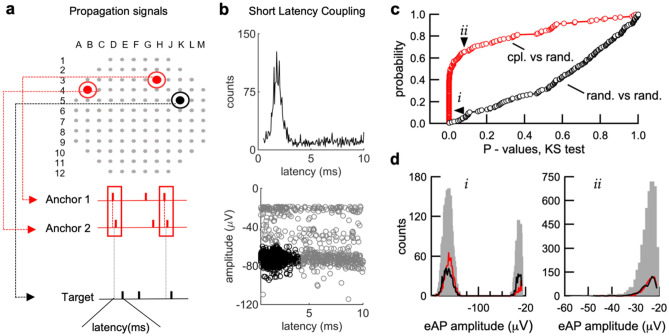
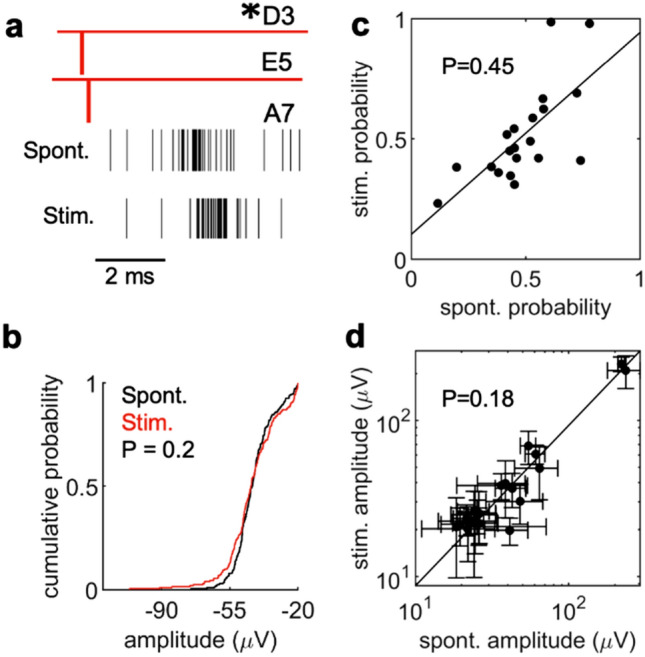
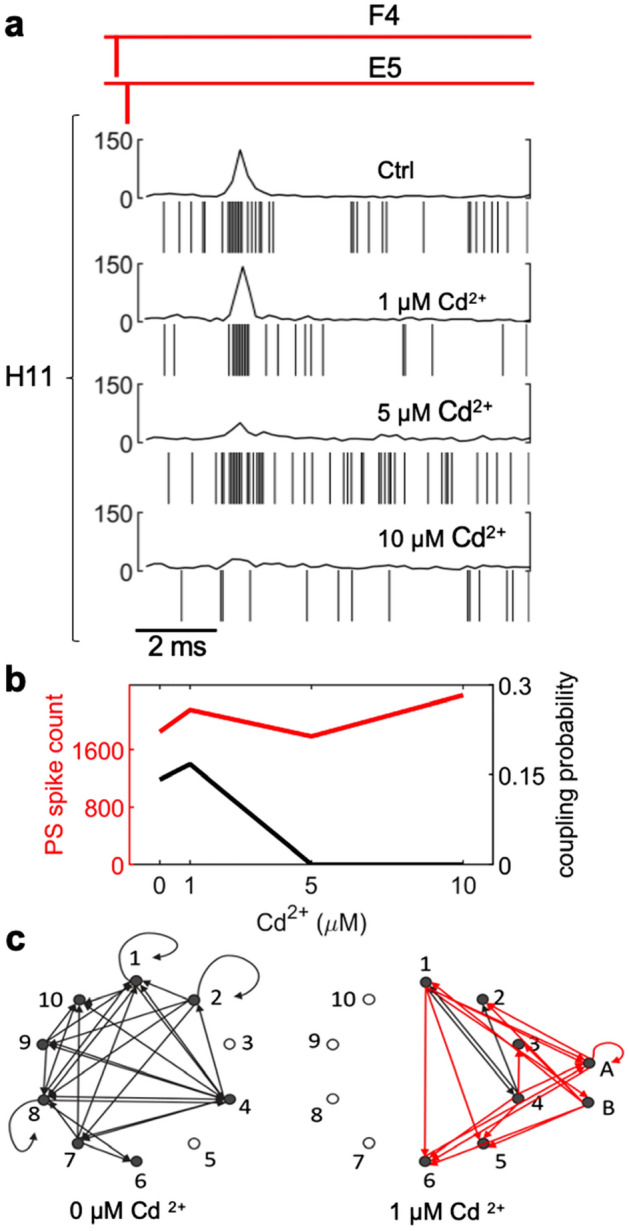
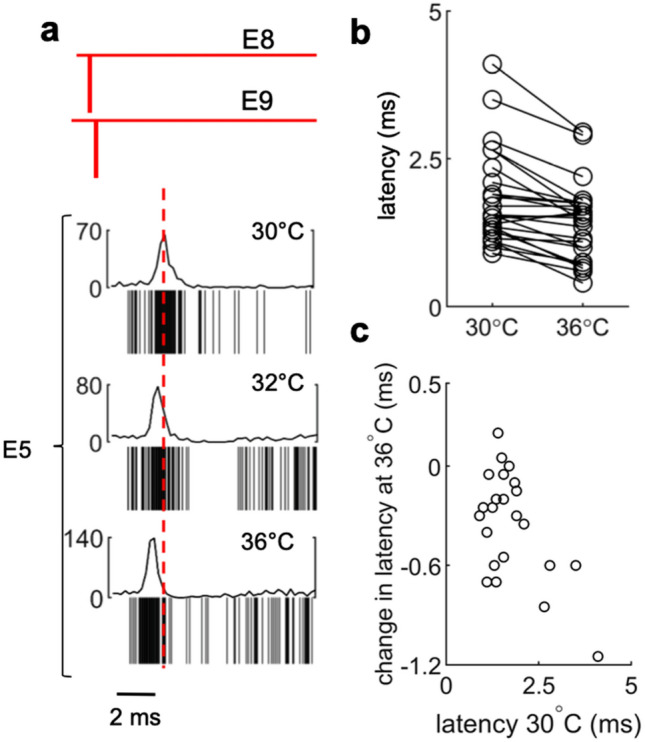
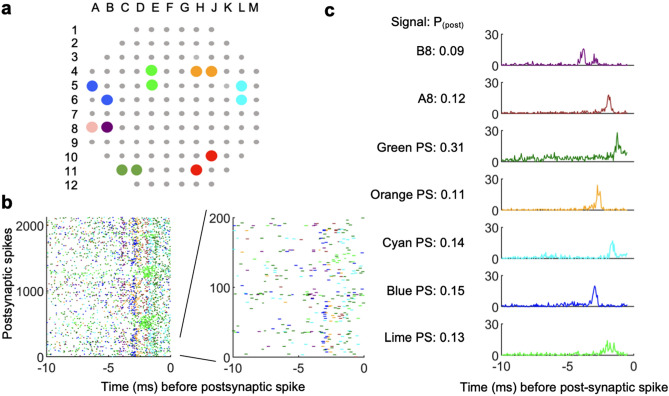
We developed a method to non-invasively detect synaptic relationships among neurons from in vitro networks. Our method uses microelectrode arrays on which neurons are cultured and from which propagation of extracellular action potentials (eAPs) in single axons are recorded at multiple electrodes. Detecting eAP propagation bypasses ambiguity introduced by spike sorting. Our methods identify short latency spiking relationships between neurons with properties expected of synaptically coupled neurons, namely they were recapitulated by direct stimulation and were sensitive to changing the number of active synaptic sites. Our methods enabled us to assemble a functional subset of neuronal connectivity in our cultures.


Conflict of interest statement

The authors declare no competing interests.

Figures

Figure 1
Figure 1
Propagation signals are a clock used to identify coupled eAP’s. (a) Map of electrode array used in these experiments. Two electrodes that detect single axon eAP propagation are shown in red. Electrode K3 is the location of the spike cloud that follows the propagation signal. (b) The eAP waveforms at H6 and D6 are shown. Individual eAPs are in grey; the average of 100 eAP waveforms is superimposed in red. (c) The distribution of inter-electrode eAP latency between H6 and D6. The high number of co-occurrences (n = 1360) and low coefficient of variation (0.078) are consistent with action potential propagation. (d) aligning the eAP co-occurrences at H6 and D6 (schematized in red) reveals a cloud of eAPs at K3. Twenty eAP waveforms from K3 are superimposed in grey, with 3 waveforms highlighted in black. The timing of 50 eAPs from K3 following the H6/D6 co-occurrence are shown as grey hash marks beneath eAP the waveforms. (e) the plot of eAP amplitude at versus time after H6/D6 co-occurrence shows a large cluster. All eAPs that occurred between 0.5 and 10 ms after the H6/D6 co-occurrence are displayed. Red lines indicate the mean latency and eAP amplitude, respectively. Horizontal and vertical grey lines indicate two standard deviations of the mean for each dimension. (f) the amplitude distribution of the spikes in K3 that occurred within 0.5 to 10 ms following the H6/D6 co-occurrence (red bars) are superimposed on the all-points spike amplitude distribution histograms from electrode K3. (g) cumulative distribution of the coupled spikes in K3 (red line) superimposed on the cumulative distributions from 5 randomly selected groups of amplitudes from the all-points distribution from K3, showing that the amplitudes of the coupled eAPs were not randomly selected from the full amplitude distribution.
Figure 2
Figure 2
Algorithm for the routine detection of synaptic coupling. (a) following propagation signal detection, two electrodes with the most co-occurrences from each propagation signal were picked as anchor points to compute the spike times. (b) A CCG is generated and stored using propagation signal spike times as a reference and all other individual electrodes as targets. To inspect the specificity of the postsynaptic response, a scatter plot of spike amplitude versus spike latency in the target electrode is produced. A few criteria can be used for deciding the existence of a short latency connection including: 1) The position of the peak of the CCGs, 2) the standard deviation of the latency and amplitude, 3) the proportion of spikes that fall into the peak region, and 4) the ratio of the number of spikes in the peak region to the number of spikes in the reference signal. The specific values for the criteria can alternatively be user defined. (c,d) (right) The two-sample KS test (two-sided) P value distribution of coupled-versus-coupled comparisons (red circles) and random-versus-random comparisons (black circles). The amplitude distributions of some electrodes are expected to be unimodal if eAPs from only single neurons are detected by those electrodes. In these cases, coupled spikes would be expected to have the same amplitude distribution as randomly selected spikes, as is the case for comparisons that do not differ.
Figure 3
Figure 3
Stimulation of presynaptic neurons recapitulates spontaneous activity. (a) 50 spontaneous co-occurring spikes in D3 and E5 were used as reference points to identify coupled spikes in A7 (spikes depicted as raster’s below). Spiking activity in A7 after stimulation of electrode D3 using a 3µA biphasic current injection, 200 µsec total duration, 500 times. A blanking period (1.5 ms) during which no voltage data is collected is applied to all electrodes due to artifacts introduced by stimulation. For the stimulation experiments we therefore measured latency from the start of the stimulation period. (b) The spike amplitude distribution of spikes detected at A7 (n = 200 randomly sampled spikes) after spontaneous propagation signals at D3/E5 (n = 572) is not significantly different than the spike distribution of spikes detected at A7 (n = 200 randomly sampled spikes, P = 0.2, two-sample KS test, two-sided, 1 MEA with 2 recording sessions for (a,b)) after stimulation at electrode D3. (c) Correlation of coupling probabilities for spontaneous activity versus stimulated activity. Each data point in (c) and (b) represents coupled neurons. Couplings were identified by identifying spontaneous propagation signal activity as references in a CCG and a coupling probability was assigned to the postsynaptic unit. Following identification of coupling relationships, electrodes associated with presynaptic propagation signals were then stimulated in order to obtain coupling probabilities with the same postsynaptic unit (n = 20 couplings, P = 0.45 paired t-test). (d) For the same coupling events in (c), the correlation between spike amplitudes of the postsynaptic response in the spontaneous condition was compared to the spike amplitudes of the stimulated condition. Error bars represent the standard deviation of spike amplitude distributions (n = 20 couplings, P = 0.18 paired t-test, 3 MEAs and 6 total recording sessions were used for (c,d)).
Figure 4
Figure 4
Cadmium alters coupling probabilities. (a) Propagation signal eAP’s detected at F4 and E5 with coupled spikes in H11 in the absence of cadmium and after addition of 1 µM, 5 µM, and 10 µM cadmium. Coordinated spiking activity in H11 after propagation signal spikes in F4 and E5 decreased dramatically and resulted in the absence of coordinated activity at 10 µM. (b) In this example, the total number of spikes from the propagating neuron detected in electrode F4 to E5 under control conditions was 1848 spikes and the coupling probability of the postsynaptic unit at H11 was 0.14. Addition of 1 µM Cd2+ resulted in 2154 spikes in the propagating neuron and a coupling probability of 0.16 with H11. At 5 µM and 10 µM Cd2+, the spikes CCG at electrode H11 did not meet our criteria for coupling and were considered fully de-coupled; with 1784 and 2357 spikes in the propagating neuron, respectively. (c) Network graphs were constructed to visualize the couplings between only propagation signal spiking activity. 8 of 10 propagation signals (nodes) formed a total of 29 couplings (black edges) in control conditions. Addition of 1 µM Cd2+ resulted in loss of 26 edges present in control and the appearance of 17 couplings (red edges). No couplings were detected at 5 µM or 10 µM Cd2+ (1 MEA was used for 4 recording sessions for ac).
Figure 5
Figure 5
Temperature increase reduces coupling latency. (a) Spikes from a propagating neuron detected at E8 and E9 coupled to a postsynaptic unit in E5. At 30 °C the average latency between propagation signal spikes and the CCG peak in E5 was 2.75 ± 0.47 ms. Temperature in the same culture was increased to 32 °C and 36 °C sequentially, the average latency of the CCG peaks were 2.15 ± 1.09 ms and 1.80 ± 0.91 ms, respectively (1 MEA was used over 3 recording sessions for (a). (b) The distribution of average latency of presynaptic propagation signals coupled to postsynaptic units at 30 °C is significantly different than the average latency of the same couplings at 36 °C (1.76 ± 0.8 ms at 30 °C, 1.41 ± 0.7 ms at 36 °C; n = 23; P < 0.0001, paired t-test, two-sided). (c) Average latency of couplings at 30 °C versus the change in average latency of the same couplings at 36 °C. (7 MEAs were used with 2 recording sessions per MEA, 14 total sessions, for (b) and (c)).
Figure 6
Figure 6
The influence of presynaptic inputs on a single postsynaptic propagation signal. (a) Location of the post-synaptic neuron in red and upstream signals in other colors. Dots in different colors represent different upstream signals. Each two dots in the same color represent two anchor points for one propagation signal. Pink and purple represent two single electrode units. (b) The patterns of pre-synaptic spikes. Each row shows the pre-synaptic firing pattern within 10 ms prior to corresponding spike on the red neuron. The first 200 instances are zoomed in on the right. The colors are consistent with (a). (c) CCGs for all upstream signals. Postsynaptic spikes (red propagation signal, n = 2124 spikes) were used as reference time points to perform CCG on other propagation signals and single electrodes A8 and B8. Because the postsynaptic spikes were used as the reference time points, the coupling probability was calculated by taking the ratio of presynaptic spikes in the CCG peak over the total number of postsynaptic spikes (1 MEA and a single recording session was used for (ac)).

Similar articles

Cited by

References

    1. Quiroga RQ. Spike sorting. Curr. Biol. 2012;22:R45–R46. doi: 10.1016/j.cub.2011.11.005. - DOI - PubMed
    1. Hill DN, Mehta SB, Kleinfeld D. Quality metrics to accompany spike sorting of extracellular signals. J. Neurosci. 2011;31:8699–8705. doi: 10.1523/JNEUROSCI.0971-11.2011. - DOI - PMC - PubMed
    1. Yger P, et al. A spike sorting toolbox for up to thousands of electrodes validated with ground truth recordings in vitro and in vivo. Elife. 2018;7:e34518. doi: 10.7554/eLife.34518. - DOI - PMC - PubMed
    1. Tovar KR, et al. Action potential propagation recorded from single axonal arbors using multielectrode arrays. J. Neurophysiol. 2018;120:306–320. doi: 10.1152/jn.00659.2017. - DOI - PubMed
    1. Radivojevic M, et al. Tracking individual action potentials throughout mammalian axonal arbors. Elife. 2017;6:e30198. doi: 10.7554/eLife.30198. - DOI - PMC - PubMed

Publication types