. 2021 Dec;5(12):1426-1436.
doi: 10.1038/s41551-021-00766-1. Epub 2021 Jul 19.

Solid stress impairs lymphocyte infiltration into lymph-node metastases

Affiliations

Solid stress impairs lymphocyte infiltration into lymph-node metastases

Dennis Jones et al. Nat Biomed Eng. 2021 Dec.

Abstract

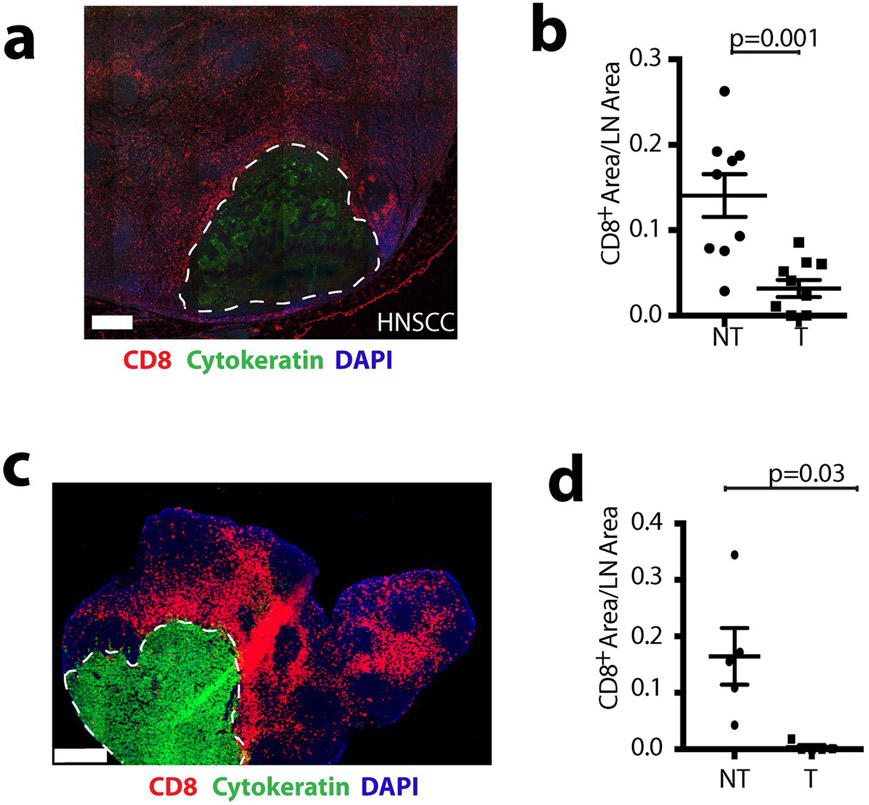
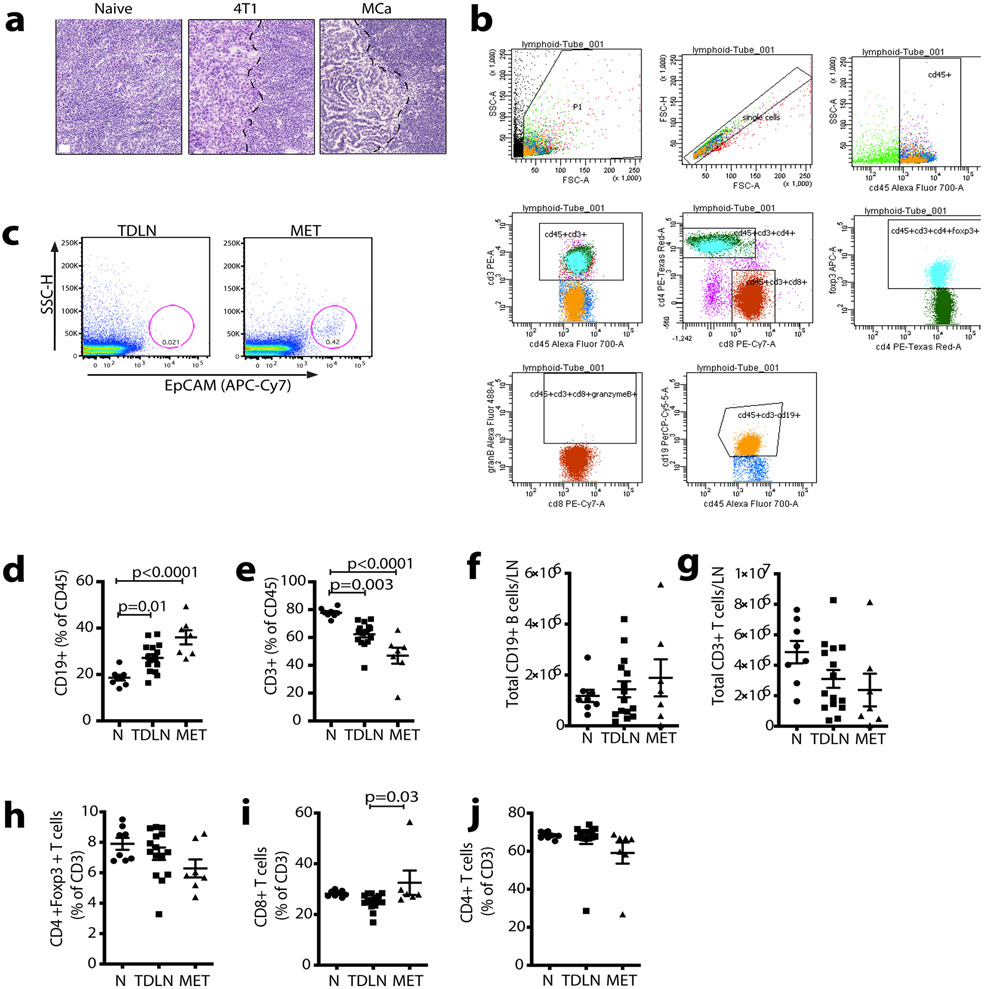
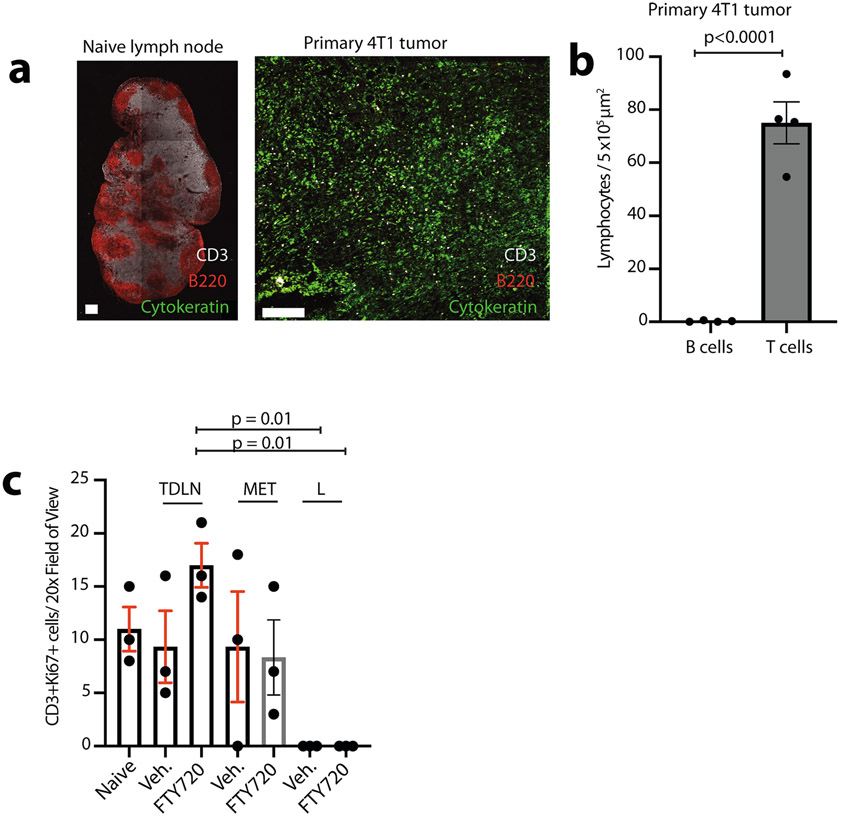
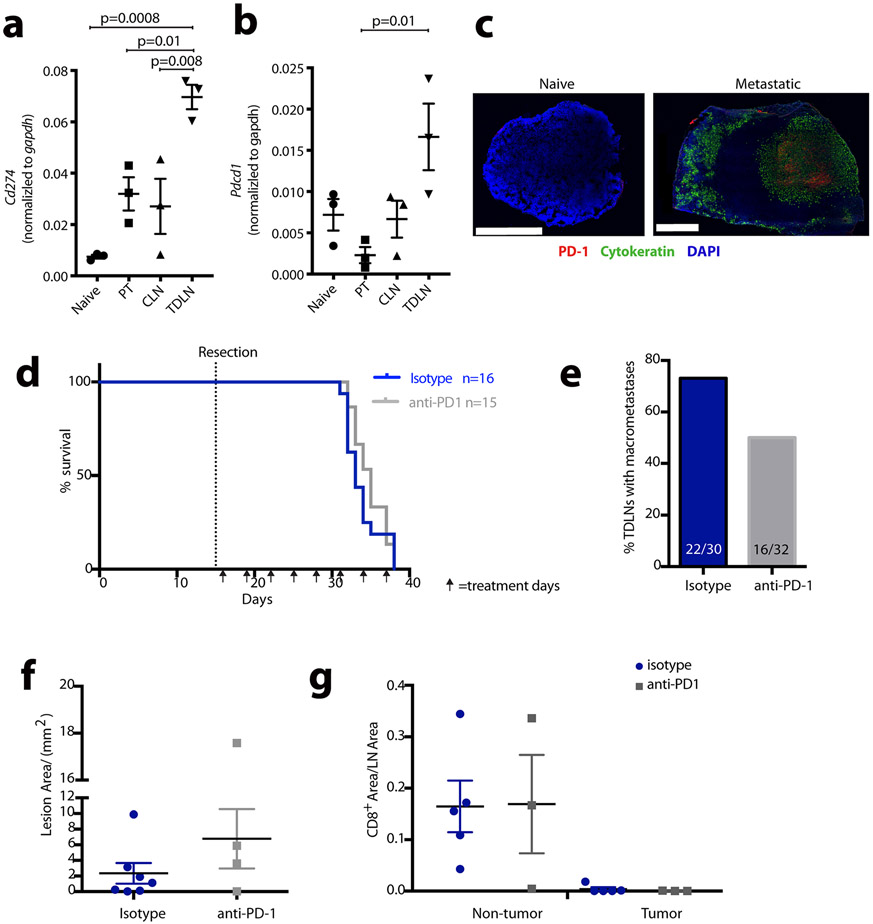
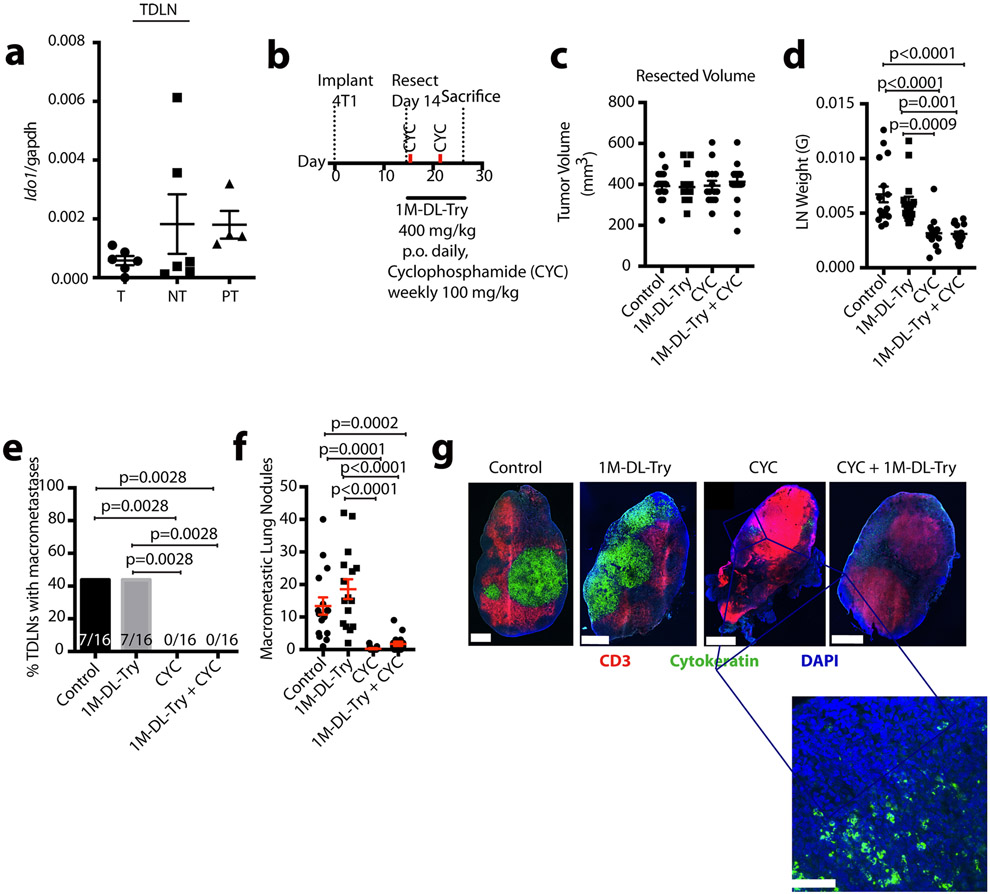
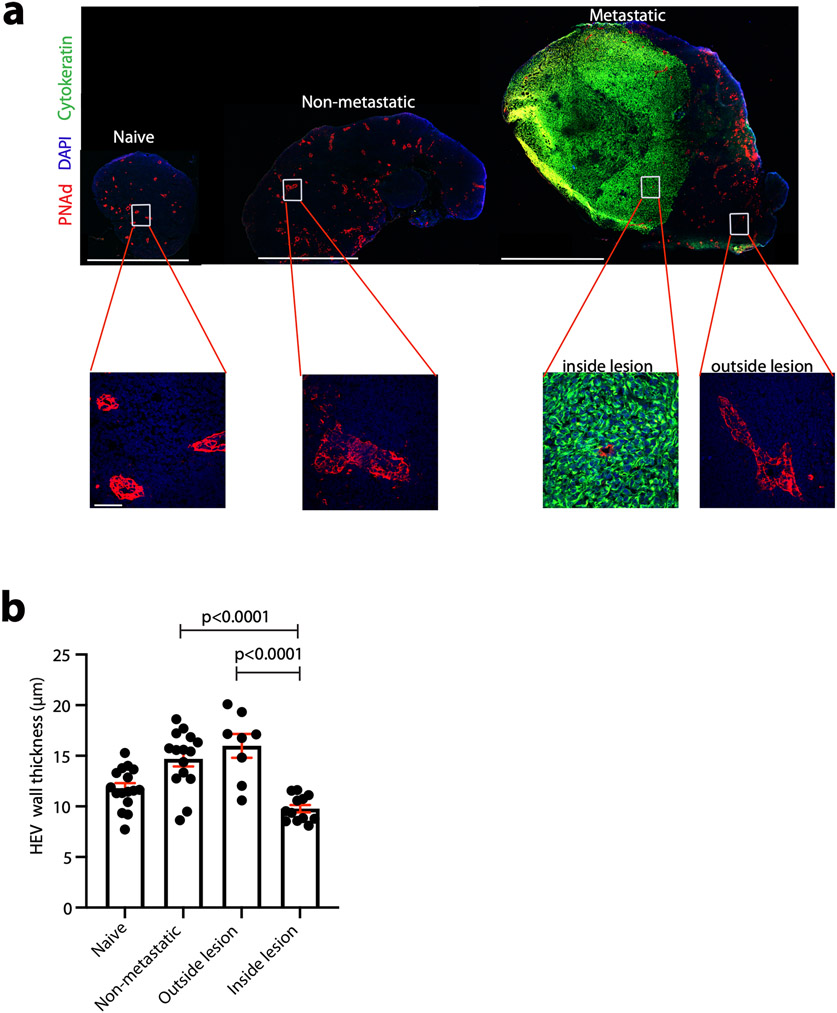
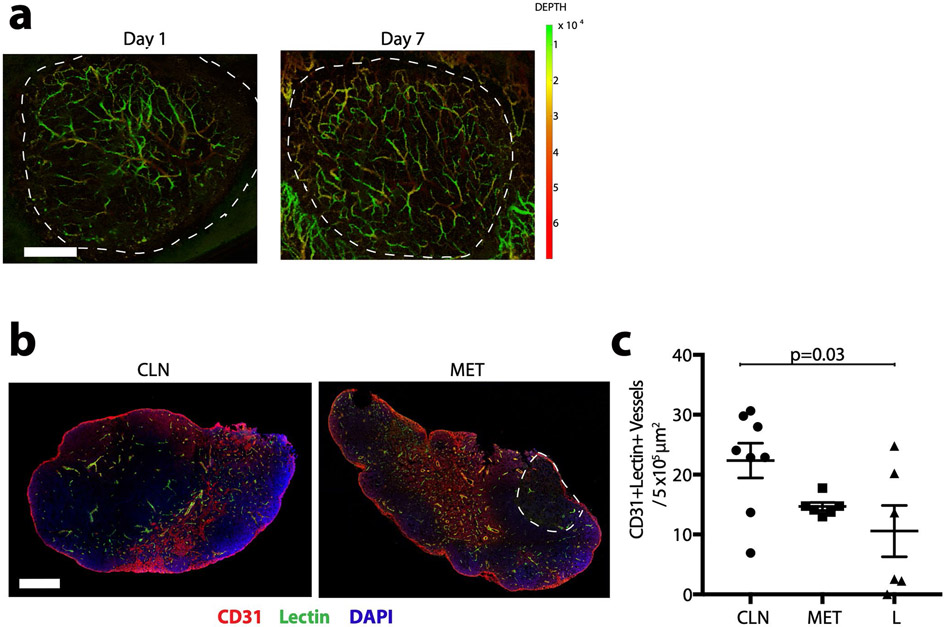
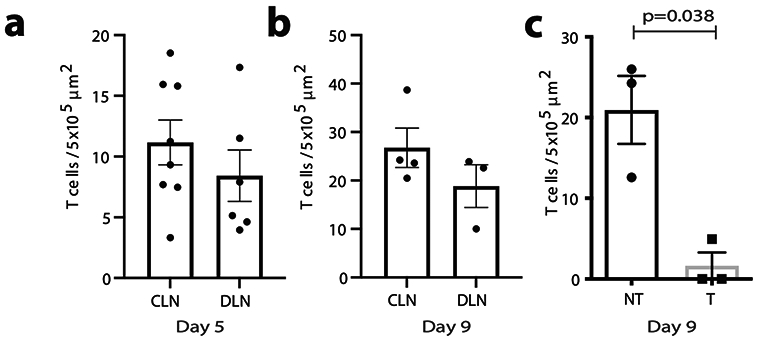
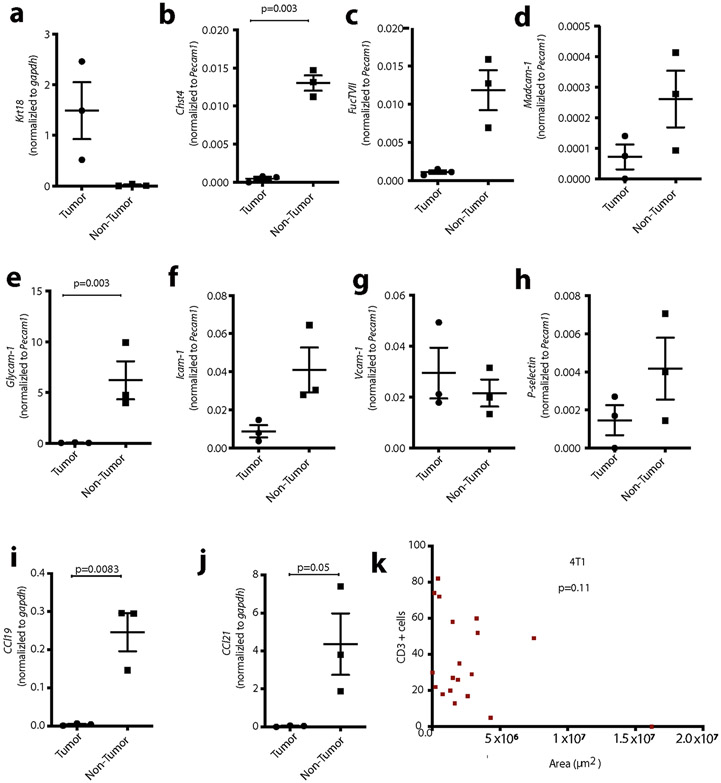
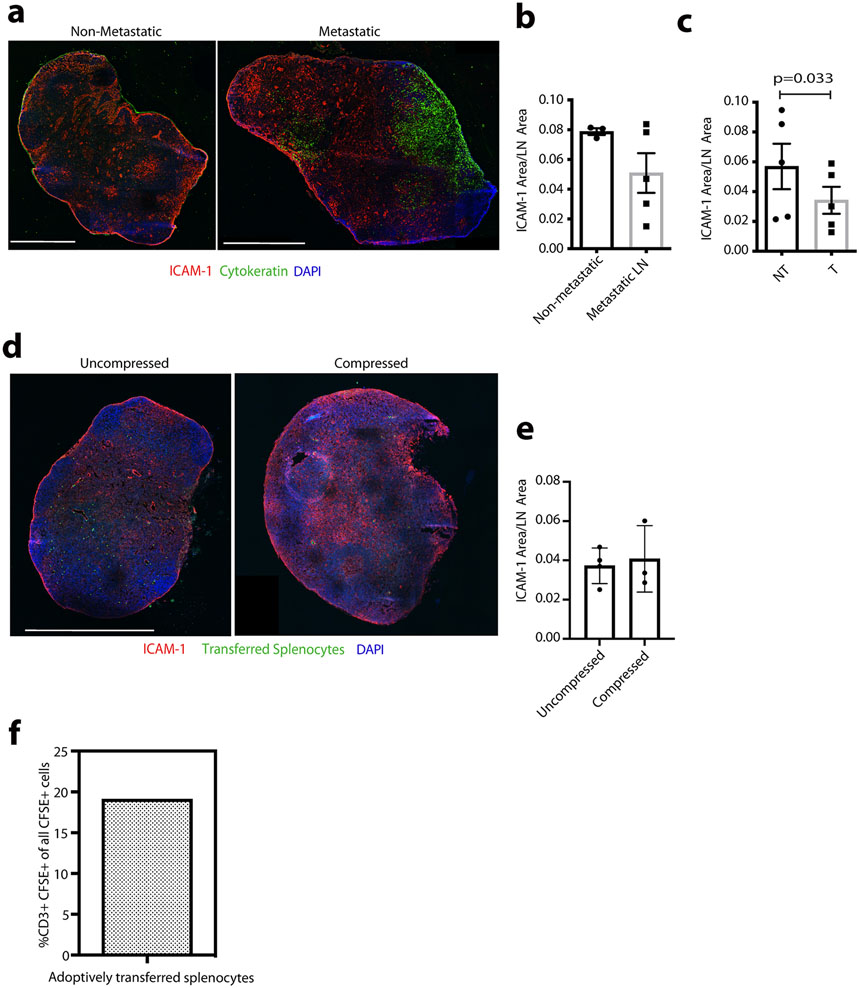
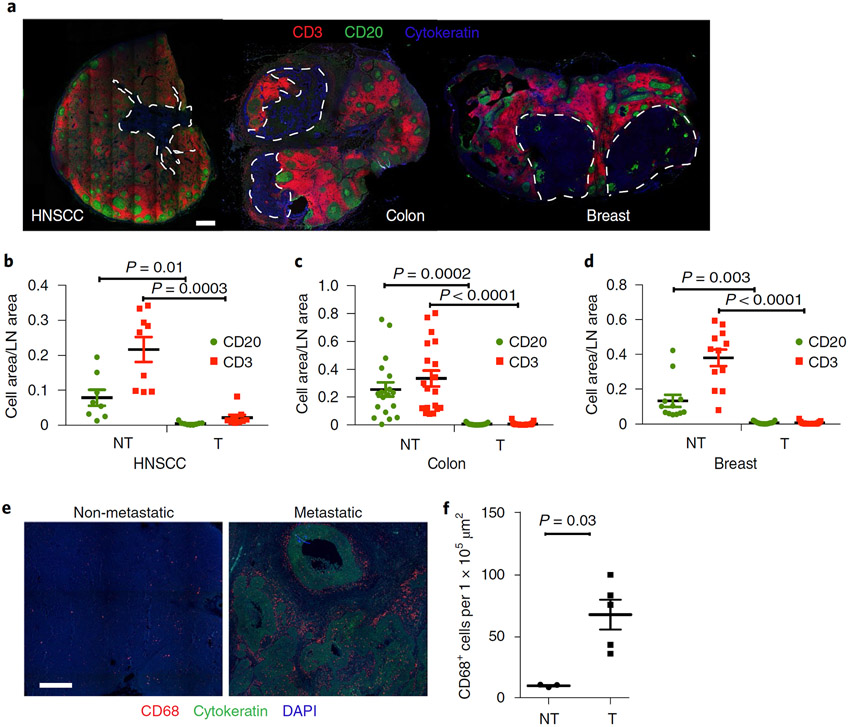
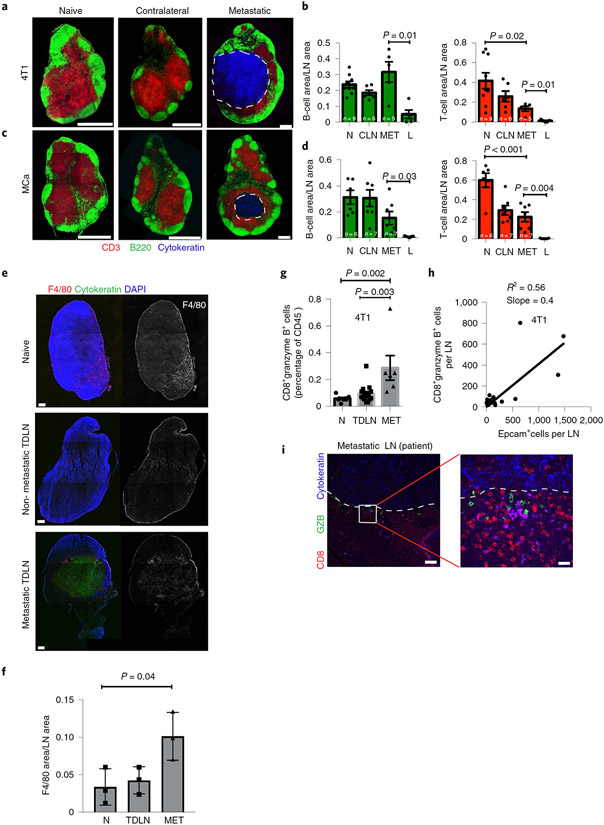
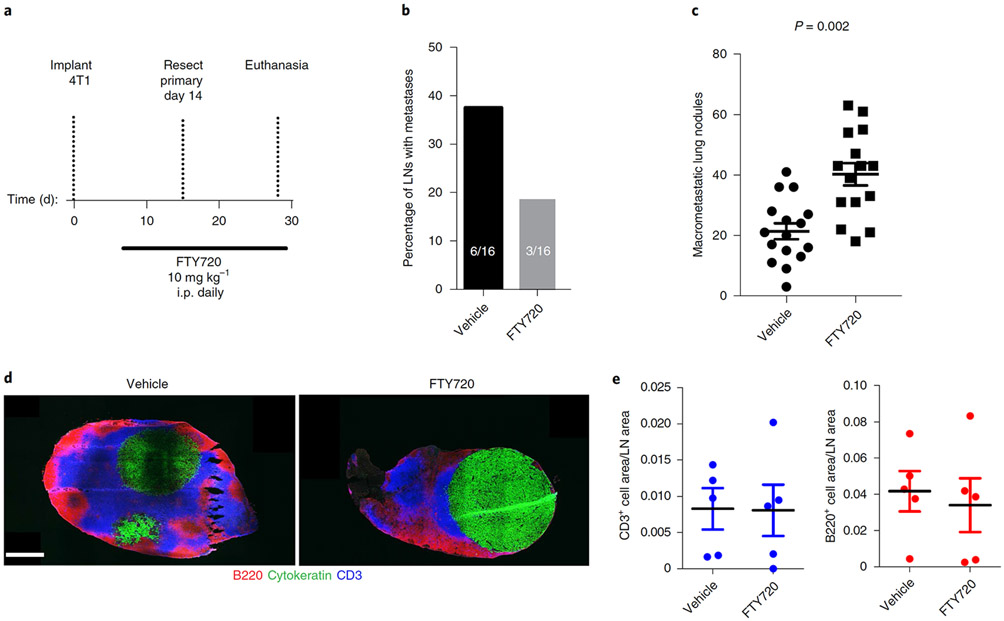
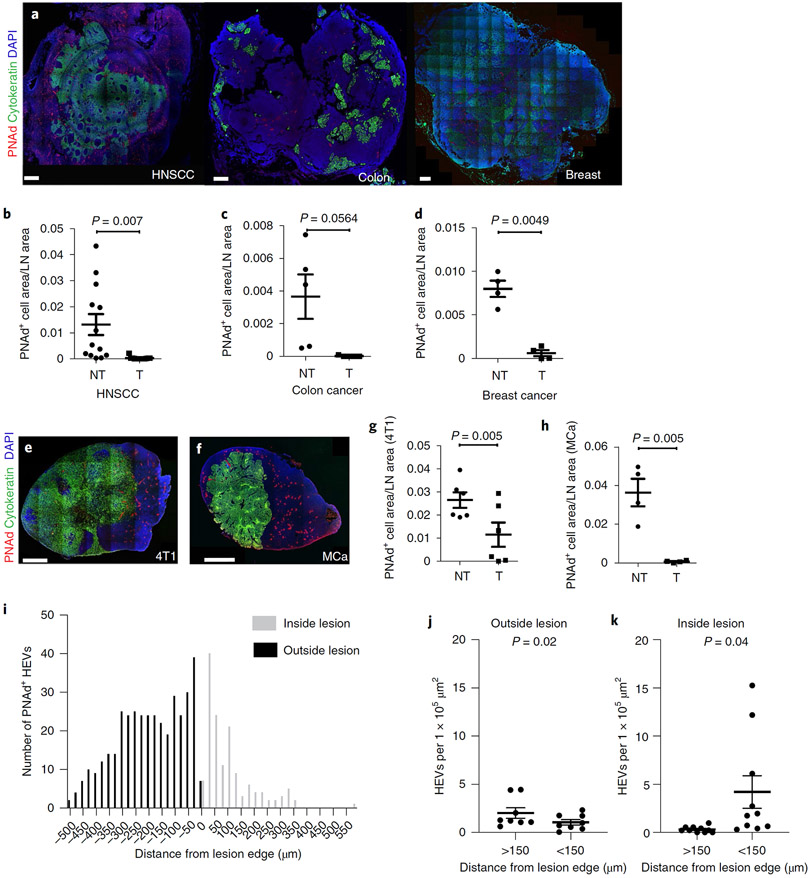
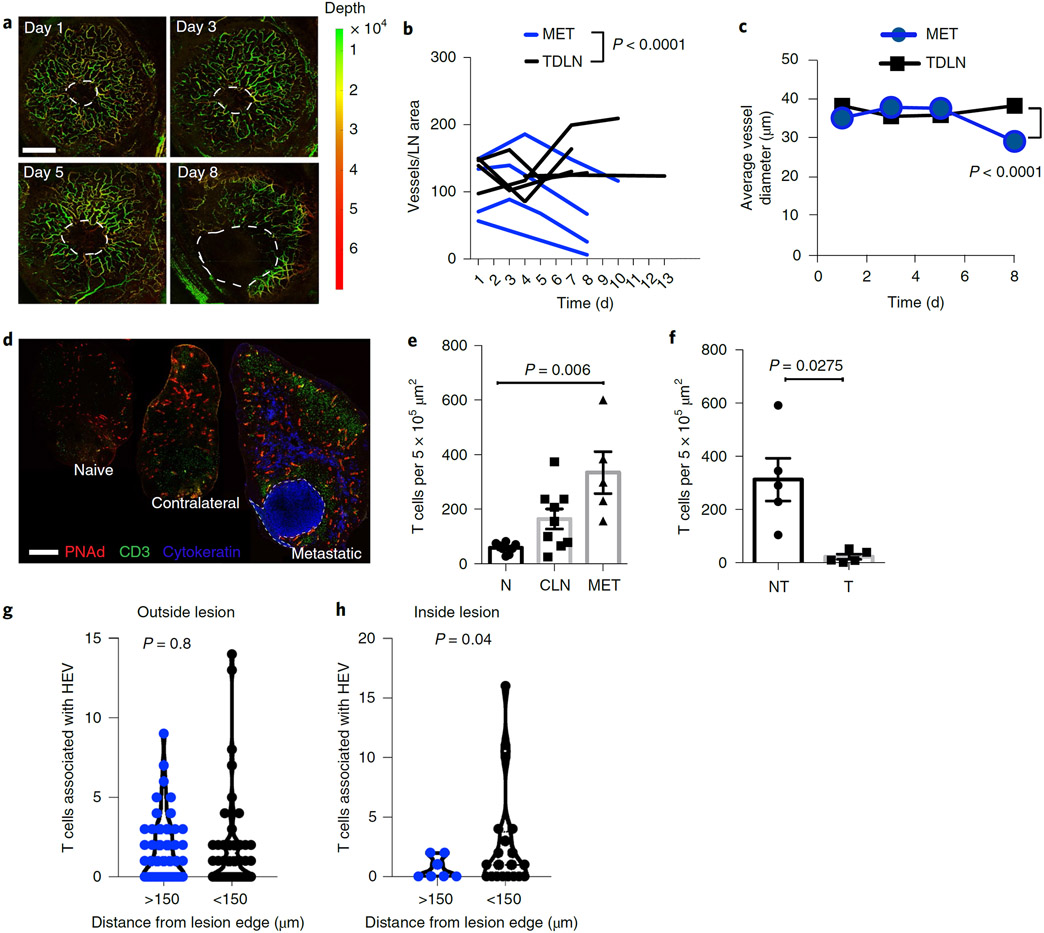
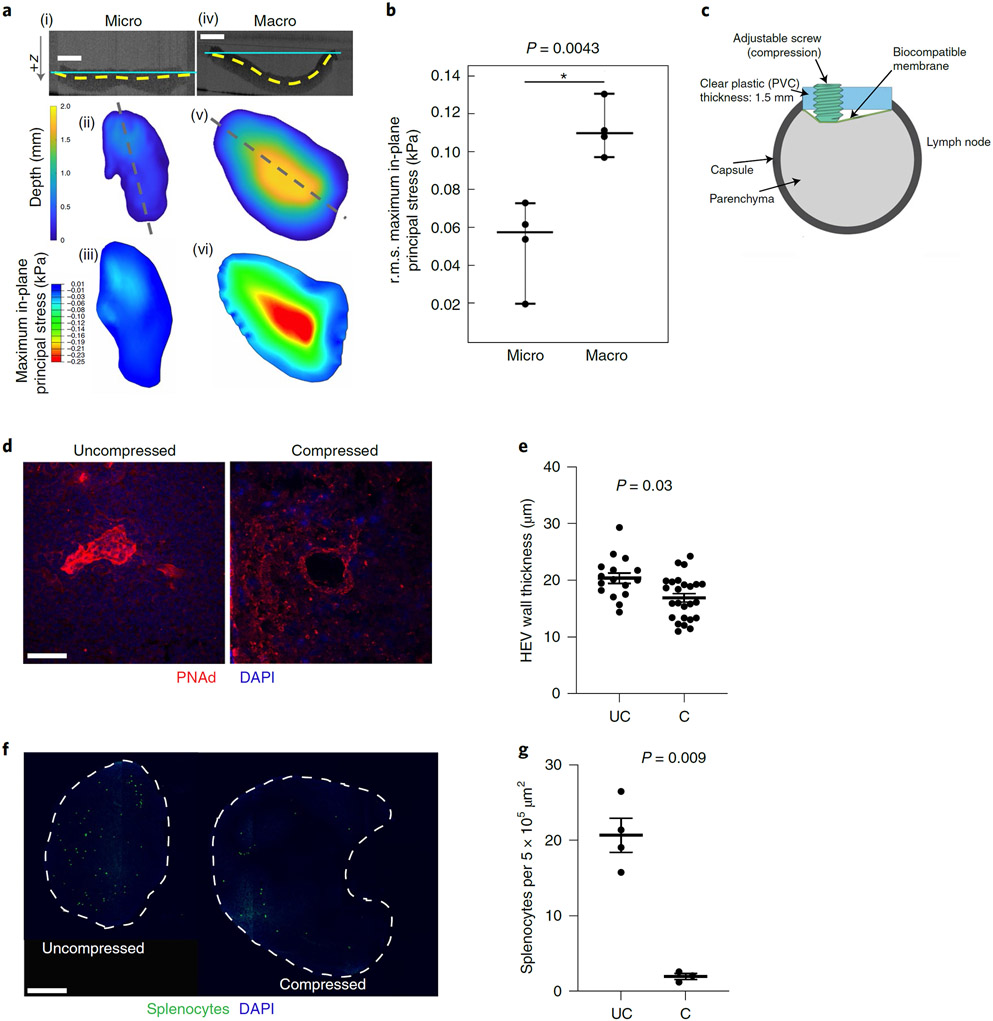
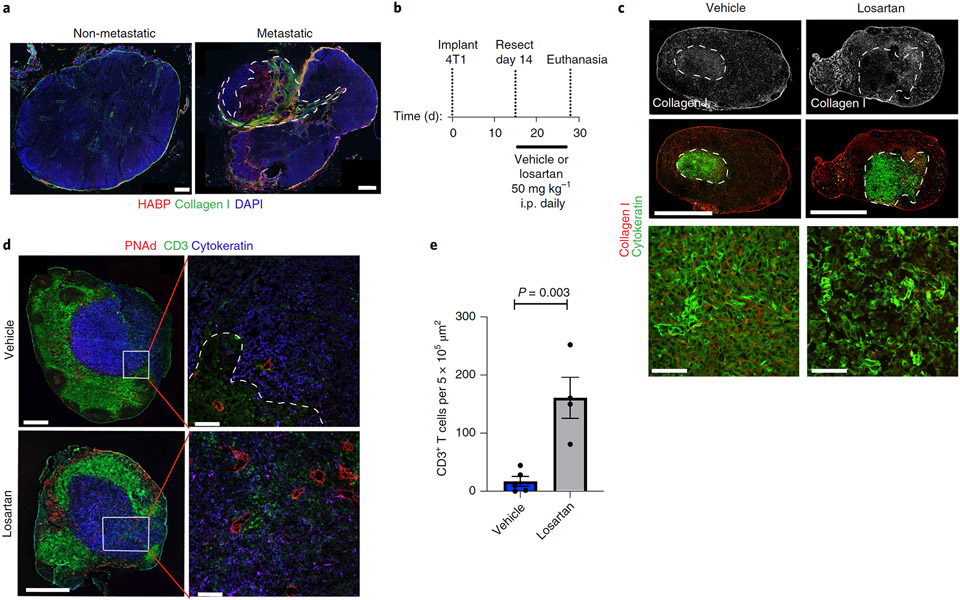
Strong and durable anticancer immune responses are associated with the generation of activated cancer-specific T cells in the draining lymph nodes. However, cancer cells can colonize lymph nodes and drive tumour progression. Here, we show that lymphocytes fail to penetrate metastatic lesions in lymph nodes. In tissue from patients with breast, colon, and head and neck cancers, as well as in mice with spontaneously developing breast-cancer lymph-node metastases, we found that lymphocyte exclusion from nodal lesions is associated with the presence of solid stress caused by lesion growth, that solid stress induces reductions in the number of functional high endothelial venules in the nodes, and that relieving solid stress in the mice increased the presence of lymphocytes in lymph-node lesions by about 15-fold. Solid-stress-mediated impairment of lymphocyte infiltration into lymph-node metastases suggests a therapeutic route for overcoming T-cell exclusion during immunotherapy.


Conflict of interest statement

Competing interests

The authors declare no competing interests.

Figures

Extended Data Fig. 1 ∣
Extended Data Fig. 1 ∣. Lack of CD8 T-cell infiltration into the metastatic lesion.
a, Representative (out of about 13 images) image of immunofluorescent staining of CD8 T cells (red) in a metastatic lymph node of a patient with head and neck squamous cell carcinoma (HNSCC). Cancer cells were stained with anti-cytokeratin (green). The dashed line indicates the margin of the lymph-node lesion. Scale bar, 636 μm. b, Quantification of the area of CD8 T cells within the metastatic tumour (T) and the adjacent non-tumour (NT) lymph-node area in LN-bearing HNSCC (n = 13). c, Representative (out of about 5 images) images of immunofluorescent staining of CD8 T cells (red) in metastatic lymph nodes of mice bearing mouse 4T1 cancer cells. Cancer cells were stained with anti-cytokeratin (green). The dashed line indicates the margin of the lymph-node lesion. Scale bar, 636 μm. d, Quantification of the area of CD8 T cells in LNs bearing 4T1 cells within the non-tumour area (NT) and tumour area (T) (n = 5). Data plotted as mean±s.e.m. Statistical significance was tested via a 2-tailed paired Students’ t-test. DAPI (blue) stains all nucleated cells.
Extended Data Fig. 2 ∣
Extended Data Fig. 2 ∣. Quantification of immune populations in tumour draining lymph nodes.
a, Histology of naïve, metastatic 4T1, and metastatic MCa lymph nodes. The dashed line indicates the margin of the lymph-node lesion. The tumour is left of the dashed lines. Scale bar= 50 μm. n = 3. b, Single-cell suspensions were generated from naïve lymph nodes or from lymph nodes of tumour-bearing mice on day 28 post-4T1 cancer cell implantation. Gating strategy of flow cytometry in d–j. c, Flow-cytometry plot showing the presence of EpCAM+ tumour cells in metastatic tumour draining lymph node (MET), right plot, compared to their absence in non-metastatic tumour draining lymph nodes (TDLN), left plot. The presence or absence of EpCAM+ tumour cells (as depicted in c) was used to define TDLNs and MET LNs in d-j. d, Flow-cytometry quantification of B cells (CD45+CD19+); e, T cells (CD45+ CD3+) from naïve lymph nodes (N) (n = 8), non-metastatic TDLNs (TDLN) (n = 15), and metastatic TDLNs (MET) (n = 7) of mice harbouring 4T1 tumours. Flow-cytometry quantification of total number of (f) CD45+CD19+ and (g) CD45+ CD3+ cells from N, TDLN and MET lymph nodes. For e and f, the total number of B and T cells, respectively, was calculated by multiplying the % population by the total lymph node cell count. Flow cytometry quantification of h, CD45 + CD3 + CD4 + Foxp3 + , i, CD45 + CD3 + CD8 + and j, CD45 + CD3 + CD4 + subpopulations from the, N, TDLN and MET LNs. Statistical analysis: Data plotted as the mean±s.e.m. Statistical significance was tested by one-way ANOVA with Tukey’s Honestly Significant Difference post-hoc test.
Extended Data Fig. 3 ∣
Extended Data Fig. 3 ∣. Analysis of lymphocytes in primary tumours.
a, Representative immunofluorescent staining of naïve lymph node (positive control, n = 9) and 4T1 primary tumour (14 days post-implantation, n = 4) stained concomitantly with anti-cytokeratin (green), anti-B220 (red), and anti-CD3 (white). b, Quantification of B220 + B cells and CD3 + T cells in 4T1 primary tumours (n = 4). c, Quantification of proliferating T cells based on CD3/Ki67 double-positive cells per 20x field of view in FTY720 or control treated mice: TDLN = non-metastatic tumour draining lymph node; MET = LN tissue remaining of a metastatic tumour draining lymph node (outside lesion) and metastatic tissue (inside lesion); L = metastatic lesion only in a metastatic tumour draining lymph node (inside lesion) Statistical analysis: Data plotted as the mean±s.e.m. Statistical significance was tested by 2-tailed unpaired Students’ t test (b) and by one-way ANOVA with Tukey’s Honestly Significant Difference post-hoc test (c).
Extended Data Fig. 4 ∣
Extended Data Fig. 4 ∣. Effect of anti-PD-1 therapy on lymph node metastasis.
Expression of Cd274 (PD-L1) (a) and Pdcd1 (PD-1) transcript (b) measured by qRT-PCR, in naïve lymph node, primary tumour (PT), contralateral (CLN) and tumour draining lymph nodes (TDLN) from mice bearing 4T1 breast cancer. Relative gene expression calculated using 2ΔCT method, as normalized against Gapdh (n = 3 biological replicates for a and b). c, Representative immunofluorescent staining (4 images taken from each group) of PD-1+ cells (red) in naïve lymph nodes of Balb/c mice and metastatic lymph nodes from Balb/c mice bearing mouse 4T1 cells. Scale bars = 500 μm. Cancer cells are stained green (cytokeratin + ) and DAPI (blue) stains all nucleated cells. d-e, 4T1 tumour-bearing Balb/c mice were treated with 200 μg of anti-PD-1 antibody (BioXcell clone RMP1-14, cat# BE0146) or isotype (rat IgG, Jackson Immunoresearch Laboratories, cat. # 012-000-003) control every 3 days following primary tumour resection 14 days post-implantation. d, Survival of animals treated with anti-PD-1 or isotype antibody. Anti-PD-1 n = 15, isotype; n = 16. e, Incidence of metastatic lymph nodes after anti-PD1 or isotype antibody treatment, as determined by cytokeratin staining of serial lymph node sections. Anti-PD-1 n = 32, isotype; n = 30. f, Tumour area of cytokeratin-positive metastatic lesions after treatment with indicated antibodies. Tumour area was measured using Image J analysis. g, Quantification of CD8 + cells within tumour and non-tumour areas of metastatic lymph nodes from 4T1 tumours in Balb/c mice treated with anti-PD-1 antibody or isotype control. Data plotted as the mean±s.e.m. Statistical significance was tested by one-way ANOVA with Tukey’s Honestly Significant Difference post-hoc test (a-b, f-g). For d, statistical analysis was calculated using Kaplan Meier analysis with non-parametric log-rank test. For e, statistical analysis was performed using a 2×2 chi-square test with Yates correction.
Extended Data Fig. 5 ∣
Extended Data Fig. 5 ∣. Effect of IDO inhibition and chemotherapy on lymph-node metastasis.
a, Expression of Ido1 measured by qRT-PCR from tumour (T) and non-tumour (NT) regions of metastatic LNs and from primary tumour of mice bearing 4T1 cells (n = 6 biological replicates for tumour and non-tumour, 4 biological replicates for tumour). Relative gene expression normalized to Gapdh and calculated using the 2ΔCT method. b, Schematic of treatment regimen. c, Measurement of primary tumour volume at time of resection for each treatment group. d, Weight of tumour draining axillary lymph node after treatment. Untreated (n = 16); 1M-DL-Try (n = 16); CYC (cyclophosphamide) (n = 15); 1M-DL-Try + CYC (n = 15). e, Incidence of metastatic lymph nodes, as determined by cytokeratin staining of serial lymph node sections. f, Quantification of pulmonary macrometastatic nodules after treatment with indicated therapies. Untreated (n = 16); 1M-DL-Try (n = 16); CYC (n = 15); 1M-DL-Try + CYC (n = 16). g, Representative immunofluorescent staining of T cells (CD3, red) and cancer cells (cytokeratin, green) in lymph nodes from control (untreated), or treated (as indicated) animals. The inset shows single tumour cells within lymph nodes of cyclophosphamide-treated animals. DAPI (blue) stains all nucleated cells. Scale bars, 500 μm. Inset scale bar = 50 μm Four images were taken per group. Data plotted as the mean±s.e.m. Statistical significance was tested by one-way ANOVA with Tukey’s Honestly Significant Difference post-hoc test (c,d,f) and between categorical variables in e using a chi-square test.
Extended Data Fig. 6 ∣
Extended Data Fig. 6 ∣. High-endothelial-venule wall-thickness in non-metastatic and metastatic lymph nodes.
a, Representative immunofluorescent staining of naïve lymph node, non-metastatic tumour draining lymph node and metastatic tumour draining lymph node with anti-cytokeratin (green) and anti-PNAd (red). DAPI (blue). Scale bars = 1272 μm. Inset below shows magnified region of interest from respective tiled lymph nodes. Scale bar = 50 μm. Four images were taken per group. b, Quantification of HEV wall thickness. Each point represents the average of 8 measurements per vessel. n = 4 animals for naïve and non-metastatic; n = 3 animals for metastatic. Data plotted as mean with 95% CI. Statistical significance was tested by one-way ANOVA with Tukey’s Honestly Significant Difference post-hoc test.
Extended Data Fig. 7 ∣
Extended Data Fig. 7 ∣. Vessel perfusion in tumour- draining lymph nodes.
a, Representative false color OCT non-metastatic TDLN on days 1 and 7 post-primary tumour (4T1) resection. Depth is denoted by color, yellow/green = superficial, red=deep. Dashed line indicates the margin of the lymph node. Scale bar = 500 μm. Experiment is representative of 5 biological replicates. b, Representative image of lectin-perfused vessels (green) in contralateral (CLN, left) and metastatic lymph node (MET, right) from animal bearing 4T1 tumour. CD31 + vessels are stained red. Adjacent hematoxylin and eosin-stained sections were used to identify the cancer cell lesion. Dashed line indicates the margin of the lymph node lesion. Scale bar = 500 μm. The number of images taken is reflected in the n values for c. c, From the 4T1 model, quantification of CD31 + Lectin+ vessels in contralateral lymph nodes (CLNs, n = 8), metastatic lymph nodes (MET), n = 6), and only within the lesion (L) of a metastatic lymph node (n = 6). Data plotted as the mean±s.e.m. Statistical significance was tested by one-way ANOVA with Tukey’s Honestly Significant Difference post-hoc test.
Extended Data Fig. 8 ∣
Extended Data Fig. 8 ∣. Trafficking of adoptively transferred T cells to naïve and tumour draining lymph nodes.
Adoptive transfer of CFSE (green)-labeled naïve T cells into naïve or 4T1-tumour bearing mice 5 or 9 days post-primary tumour resection. a, Quantification of adoptively transferred T cells (10 million) entering contralateral lymph nodes (CLN) (n = 8) and tumour draining lymph nodes (TDLN) (n = 6) within 4 hours of cell transfer at Day 5 post-tumour resection. b, Quantification of adoptively transferred T cells (14 million) entering contralateral lymph nodes (CLN) (n = 4) and tumour draining lymph nodes (TDLN) (n = 3) within 4 hours of cell transfer at Day 9 post-tumour resection. c, Quantification of the non-tumour area (NT) and tumour area (T) of D9 metastatic LNs (n = 3) within 4 hours of cell transfer. Data plotted as the mean±s.e.m. Significance tested by one-way ANOVA with Tukey’s Honestly Significant Difference post-hoc test (a,b) and 2-tailed paired Students’ t-test (c).
Extended Data Fig. 9 ∣
Extended Data Fig. 9 ∣. Gene expression in metastatic lymph nodes.
a, qRT-PCR analysis from tumour (T) and non-tumour (NT) regions of metastatic LNs a, Krt18 was used to confirm the presence of cancer cells in each individual metastatic lymph node. Transcript expression normalized to Gapdh. b–h, Analysis of genes related to T cells trafficking. Expression normalized to Pecam1. (n = 3 biological replicates) i–j, Ccl19 (i) and Ccl21 (j) expression normalized to Gapdh. (n = 3 biological replicates for both tumour and non-tumour groups in a-j). Relative gene expression calculated using 2ΔCT method. k, Pearson correlation between the number of intralesional CD3 + T cells and lesion area of 4T1 cancer cells in lymph nodes (r = −0.37, n = 19 biological replicates). Data plotted as the mean±s.e.m. Statistical significance was tested by 2-tailed paired Students’ t-test (a-j).
Extended Data Fig. 10 ∣
Extended Data Fig. 10 ∣. ICAM-1 in lymph nodes experiencing solid stress.
a, Representative immunofluorescence staining of ICAM-1(red) and cytokeratin (green) in non-metastatic and metastatic LNs from mouse 4T1 model. The number of images taken is reflected in the n values for b. b, Quantification of ICAM-1 in non-metastatic (n = 3) and metastatic (n = 5) lymph nodes. DAPI, blue. c, Quantitation of non-tumour area (NT) and tumour area (T) of metastatic LNs (n = 5). Scale bars = 636 μm. d, Representative immunofluorescence staining of ICAM-1 (red) in an uncompressed and compressed inguinal lymph node DAPI, blue. Scale bar = 1272 μm. 3 images were taken per group and are quantified in e. f, Percentage (of total CFSE + cells) of CD3 + CFSE + cells in animals receiving adoptively transferred splenocytes. n = 7 biological replicates. Statistical analysis: Data plotted as the mean±s.e.m. Significance tested by 2-tailed unpaired (b,e) and paired Students’ t-test (c).
Fig. 1 ∣
Fig. 1 ∣. Immune evasion by human cancer cells within metastatic LNs.
a, Representative IF staining of metastatic LNs from patients with head and neck, colon and breast cancer. Scale bar, 1.2 mm. The number of images taken is reflected in the n values for b–d. The dashed lines indicate the margin of the LN lesion. b–d, Lymphocyte quantification within the non-tumour area (NT) and tumour area (T) of metastatic LNs from patients with head and neck cancer (b), colon cancer (c) and breast cancer (d). n = 9 patients with head and neck cancer (n = 8 (non-tumour B-cell area), n = 9 (non-tumour T-cell area) and n = 9 (tumour B- and T-cell area)). T- and B-cell area fraction from n = 13 patients with colon cancer was measured (n = 18 (non-tumour B-cell area), n = 19 (non-tumour T-cell area) and n = 21 (tumour B- and T-cell area)). T- and B-cell area fraction from n = 7 patients with breast cancer was measured (n = 12 (non-tumour B- and T-cell area) and n = 15 (tumour B- and T-cell area)). e, Representative IF staining of CD68+ macrophages (red) in a non-metastatic TDLN and a metastatic LN from a patient with head and neck cancer. Cancer cells are stained green (cytokeratin+), and DAPI (blue) stains all nucleated cells. n = 5 images taken from n = 5 non-metastatic LNs, n = 5 images from n = 5 metastatic LNs. Scale bar, 500 μm. f, Quantification of CD68+ macrophages within LN tumour and non-tumour areas from patients with head and neck squamous cell carcinoma (HNSCC). n = 5 LNs from n = 5 different patients; two of the LNs did not have a non-tumour area. Data are mean ± s.e.m. For b–d and f, significance was tested using two-tailed paired Student’s t-tests (b–d) and an unpaired Student’s t-test (f).
Fig. 2 ∣
Fig. 2 ∣. Selective exclusion of T cells from LN metastases.
a,c, Naive, contralateral and metastatic LNs from mice bearing 4T1 (a) or MCa (c) tumours. Cancer cells (blue), CD3+ T cells (red) and B220+ B cells (green) are shown. The dashed lines indicate the margin of the LN lesions. Scale bars, 636 μm. The number of images taken is reflected in the n values for b,d. b,d, Quantification of B- and T-cell area per LN area in naive LNs (N), contralateral LNs (CLN), metastatic LNs (MET) and metastatic lesions within a metastatic LN (L) in the 4T1 (b) and MCa (d) models. For 4T1: n = 9 (naive LNs), n = 6 (contralateral LNs), n = 5 (metastatic LNs) and n = 5 (metastatic lesions within a metastatic LN). For MCa: n = 6 (naive LNs), n = 7 (contralateral LNs), n = 7 (metastatic LNs) and n = 7 (metastatic lesions within a metastatic LN). e, Representative IF staining (of three in each group) of F4/80+ macrophages (red, left; white, right) in naive LNs, non-metastatic TDLNs and metastatic TDLNs from BALB/c mice. Scale bars, 200 μm. f, Quantification of F4/80+ macrophages within naive LNs and non-metastatic and metastatic TDLNs. n = 3. g, The percentage of CD8 T cells expressing granzyme B in naive LNs (N; n = 8), TDLNs (n = 15) and 4T1 MET LNs (n = 6). h, Correlation of the absolute counts of granzyme B+ CD8 T cells and 4T1 cancer cells in MET LNs. n = 21. i, Granzyme B staining (GZB, green) in the LN of a patient with breast cancer. n = 5 images taken. The dashed line indicates the margin of the LN lesion. Scale bars, 120 μm (left) and 25 μm (right). For b,d,f and g, data are mean ± s.e.m. Significance was tested using one-way ANOVA with Tukey’s honestly significant difference post hoc test.
Fig. 3 ∣
Fig. 3 ∣. Effect of sphingosine-1-phosphate receptor inhibition on metastatic burden.
a, Schematic of the treatment regimen. b, Incidence of metastatic LNs after FTY720 or vehicle treatment, as determined by cytokeratin staining of serial LN sections (n = 16 per group). The experiment is representative of two biological replicate studies. c, Quantification of pulmonary macrometastatic nodules after treatment with FTY720 or vehicle. n = 16 (vehicle) and n = 5 (FTY720). d, Representative IF staining of T cells (CD3, blue), cancer cells (cytokeratin, green) and B cells (B220, red) in LNs from vehicle- or FTY720-treated animals. Scale bar, 636 μm. n = 5 images for each group were taken. e, Quantification of T-cell (left) and B-cell (right) infiltration of vehicle-treated or FTY720-treated metastatic LNs. For b, statistical analysis was performed using a 2 ×2 χ2 test with Yates correction (no significance was found). For c and e, significance was tested using two-tailed unpaired Student’s t-tests. Data are mean ± s.e.m.
Fig. 4 ∣
Fig. 4 ∣. Reduced HEVs in metastatic lesions.
a, Representative IF analysis of PNAd+ HEVs (red) of metastatic LNs from patients with HNSCC, colon cancer and breast cancer. Cancer cells were stained with anti-cytokeratin (green) and DAPI (blue) stains all nucleated cells. Scale bars, 636 μm (HNSCC and breast cancer) and 350 μm (colon cancer). The number of images taken is reflected in the n values for b–d. b–d, PNAd quantification of patients with HNSCC (n = 12) (b), colon cancer (n = 5) (c) and breast cancer (n = 4) (d). e,f, IF analysis of HEVs (PNAd+; red) in MET LNs from mouse 4T1 (e) and MCa (f) tumours. Cancer cells were stained with anti-cytokeratin antibodies (green) and DAPI (blue). For e and f, scale bars, 636 μm. The number of images taken is reflected in the n values for g and h. g,h, PNAd quantification of 4T1 (n = 6) (g) and MCa (n = 4) (h) LN metastases. i, The frequency distribution of the number of HEVs on the basis of the distance from the edge of the metastatic lesion (x = 0); negative values indicate vessels outside the lesion, and positive values indicate vessels inside the lesion. n = 4. j,k, The number of HEVs per defined area and the distance outside (j; n = 7) and inside (k, n = 11) metastatic lesions. Data are mean ± s.e.m. Significance was tested using two-tailed paired Student’s t-tests.
Fig. 5 ∣
Fig. 5 ∣. Impaired blood vessel function in metastatic lesions.
a, Doppler OCT image of a metastatic LN on days 1, 3, 5 and 8 after primary tumour (4T1) resection. The depth is denoted by colour: yellow/green (superficial); red (deep). OCT detects vessels up to approximately 1 mm. The dashed lines indicate the margin of the LN lesion. Scale bar, 500 μm. The experiment is representative of four biological replicates. b, Quantification of vessels per 5 × 105 μm2 in individual non-metastatic (TDLN, n = 5) and metastatic (MET, n = 4) LNs from longitudinal imaging by OCT. c, Quantification of OCT vessel diameter from metastatic and non-metastatic LNs. The experiment is representative of four biological replicates. d, Adoptive transfer of CMFDA-labelled (green) naive T cells into naive or 4T1 tumour-bearing mice 14 d after primary tumour resection (PNAd+ HEVs; red) and cancer cells (cytokeratin+, blue). Scale bar, 636 μm. e,f, Quantification of adoptively transferred T cells entering naive LNs (N, n = 8), contralateral LNs (CLN, n = 9), MET LNs (MET, n = 5) (e), and within the non-tumour area (NT) and tumour area (T) of MET LNs (n = 5) within 4 h of cell transfer (f). g,h, The number of adoptively transferred T cells associated with HEVs outside (g) and inside (h) metastatic lesions, according to the distance from the edge of the lesion. n = 3. For b, statistical analysis was performed using a mixed regression model in which vessel density was the dependent variable identified by individual animals, with the experimental group (non-metastatic TDLN versus metastatic TDLN), time (continuous) and an interaction term between time and group as fixed effects, to show a difference between vessel density in non-metastatic and metastatic TDLNs. For c and e–h, significance was tested using two-tailed paired Student’s t-tests (f–h) and one-way ANOVA with Tukey’s honestly significant difference post hoc test (c and e). For e and f, data are mean ± s.e.m.
Fig. 6 ∣
Fig. 6 ∣. Solid stress impairs lymphocyte trafficking into LNs.
a, Representative micrometastasis sample (of 4) ((i)–(iii)) and representative macrometastasis sample (of 4) ((iv)–(vi)). Sagittal section of a LN slice from an OCT image stack associated with the grey dashed lines in (ii) and (v) ((i) and (iv)). The yellow dashed line indicates the approximate membrane reconstructed from (ii) and (v). The cyan solid line indicates the zero plane for the OCT image stack for the respective sample. Transverse view of reconstructed membrane profile in MATLAB with a heat map to indicate the distribution of deformation or depth in the z direction ((ii) and (v)). Heat map of the maximum in-plane principal solid stress obtained from the finite-element model of the membrane with deformation described in (ii) and (v) ((iii) and (vi)). Scale bars, 1 mm. b, Root mean squared (r.m.s.) maximum in-plane principal solid stress values obtained for all samples in the micrometastasis and macrometastasis groups. n = 4. c, Schematic of the LN compression device. d, Representative IF staining of PNAd+ HEVs (red) in an uncompressed (contralateral) and compressed inguinal LN. Scale bar, 40 μm. e, Quantification of endothelial wall thickness in uncompressed (UC) and compressed (C) LNs. n = 3. f, Adoptive transfer of CFSE-labelled (green) naive splenocytes into mice with a compression device. The dashed lines indicate the margin of the LN. Scale bar, 450 μm. g, Quantification of adoptively transferred splenocytes entering uncompressed (UC) contralateral LNs (n = 4) and compressed (C) inguinal LNs (n = 3). For b,e and g, data are median ± 1.5× the respective interquartile range (b) and mean ± s.e.m. (e and g). Significance was tested using two-tailed unpaired Student’s t-tests.
Fig. 7 ∣
Fig. 7 ∣. Losartan treatment increases T cells within LN lesions.
a, Representative IF staining (n = 4) of collagen I (green) and HABP to detect hyaluronan in LN metastases from patients with breast cancer. Scale bars, 400 μm (non-metastatic) and 600 μm (metastatic). n = 6 (non-metastatic); n = 12 (metastatic). b, Schematic of losartan treatment regimen. c, Representative IF staining of collagen I (white, top row; red, middle and bottom rows) and cytokeratin (green) in metastatic LNs from vehicle- and losartan-treated animals. n = 9 (vehicle); n = 4 (losartan). Scale bars, 636 μm (middle row, which also apply to the top row) and 50 μm (bottom row). Integrated density of collagen 219 a.u. (vehicle), 123 a.u. (losartan). d, Representative IF staining of PNAd+ HEVs (red), CD3+ T cells (green) and cytokeratin+ cancer cells (blue) in metastatic LNs of BALB/c mice bearing mouse 4T1 cells and treated with vehicle or losartan. Scale bars, 636 μm (left) and 100 μm (right). The number of images taken in c and d is reflected in the n values for e. e, Quantification of CD3 T cells depicted in d. n = 5 (vehicle) and n = 4 (losartan). For a,c and d, the dashed lines indicate the margin of the LN lesion. Data are mean ± s.e.m. Significance was tested using two-tailed unpaired Student’s t-tests.

References

    1. Jatoi I, Hilsenbeck SG, Clark GM & Osborne CK Significance of axillary lymph node metastasis in primary breast cancer. J. Clin. Oncol 17, 2334–2340 (1999). - PubMed
    1. Ferris RL, Lotze MT, Leong SP, Hoon DS & Morton DL Lymphatics, lymph nodes and the immune system: barriers and gateways for cancer spread. Clin. Exp. Metastasis 29, 729–736 (2012). - PMC - PubMed
    1. Nathanson SD, Kwon D, Kapke A, Alford SH & Chitale D The role of lymph node metastasis in the systemic dissemination of breast cancer. Ann. Surg. Oncol 16, 3396–3405 (2009). - PubMed
    1. Pereira ER et al. Lymph node metastases can invade local blood vessels, exit the node, and colonize distant organs in mice. Science 359, 1403–1407 (2018). - PMC - PubMed
    1. Brown M et al. Lymph node blood vessels provide exit routes for metastatic tumor cell dissemination in mice. Science 359, 1408–1411 (2018). - PubMed

Publication types