. 2021 Sep;18(9):2165-2176.
doi: 10.1038/s41423-021-00731-7. Epub 2021 Jul 19.

Kupffer cell restoration after partial hepatectomy is mainly driven by local cell proliferation in IL-6-dependent autocrine and paracrine manners

Affiliations

Kupffer cell restoration after partial hepatectomy is mainly driven by local cell proliferation in IL-6-dependent autocrine and paracrine manners

Yeni Ait Ahmed et al. Cell Mol Immunol. 2021 Sep.

Abstract

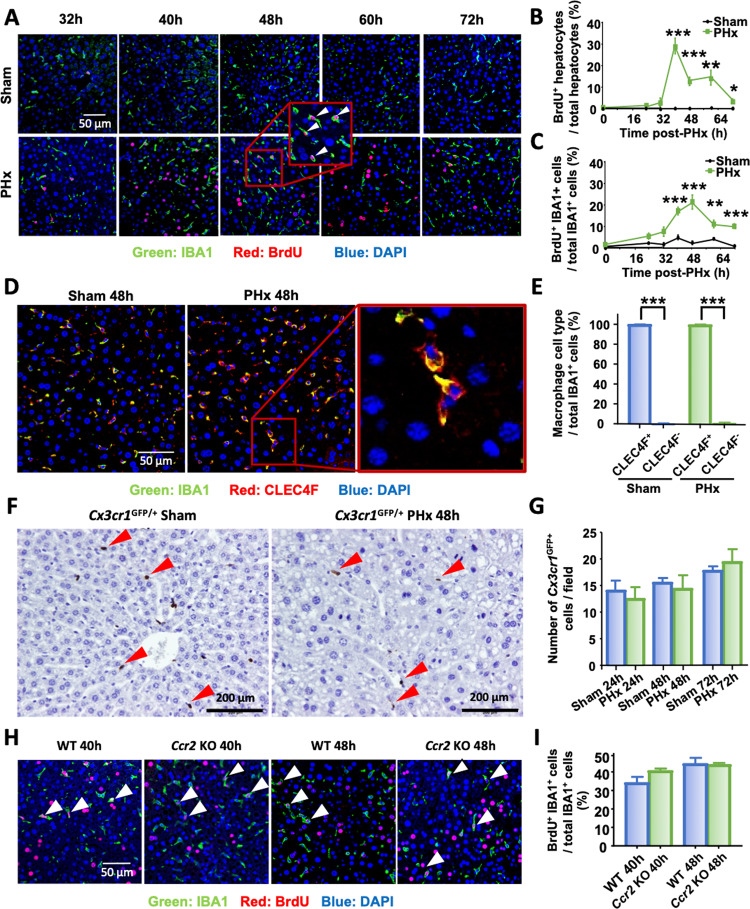
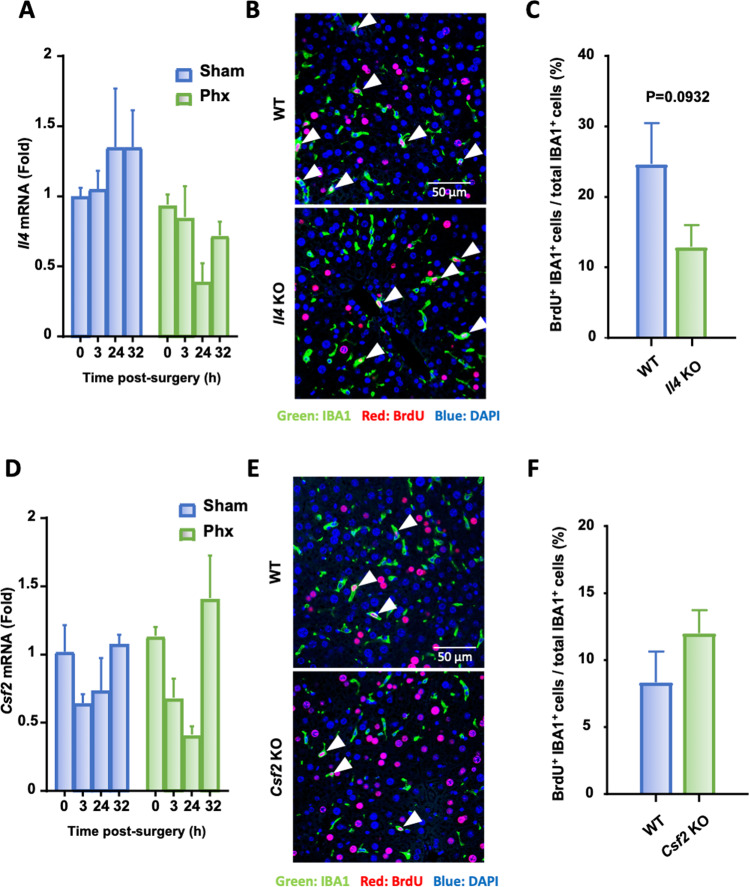
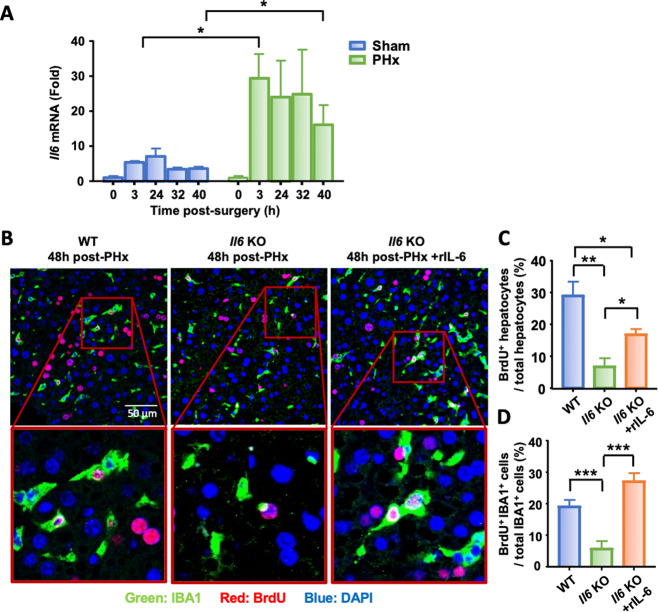
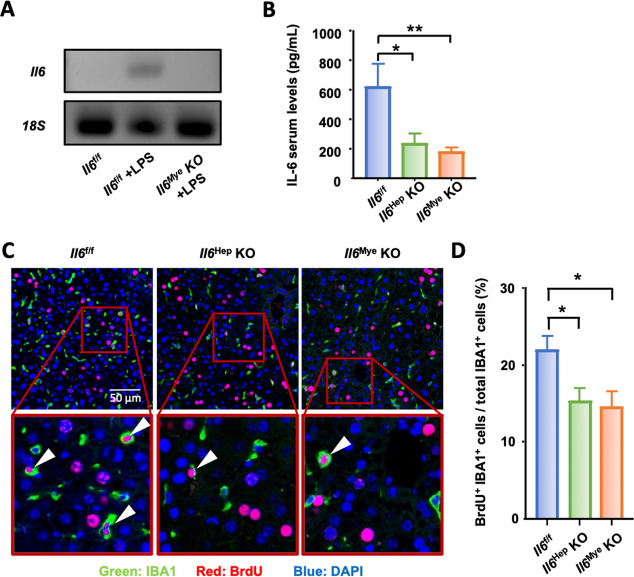
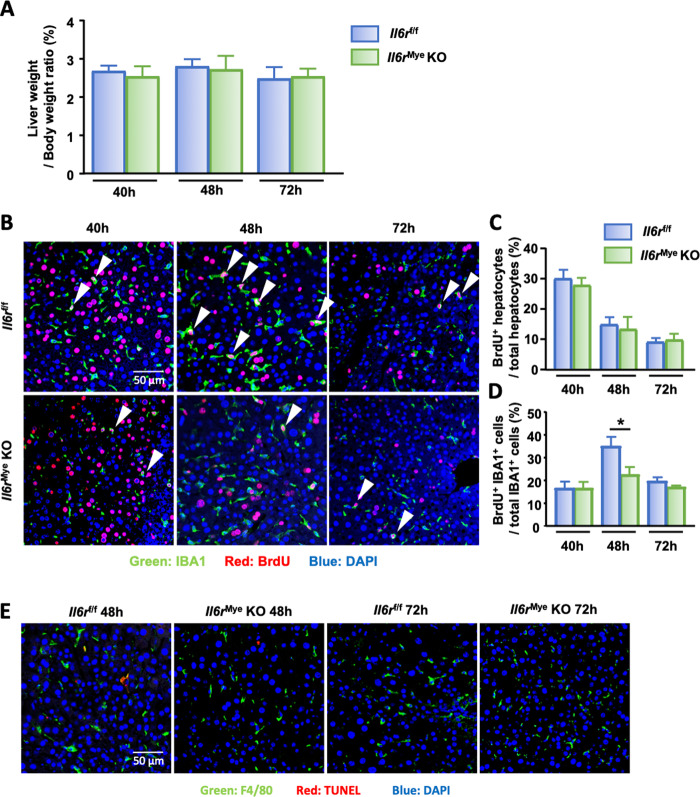
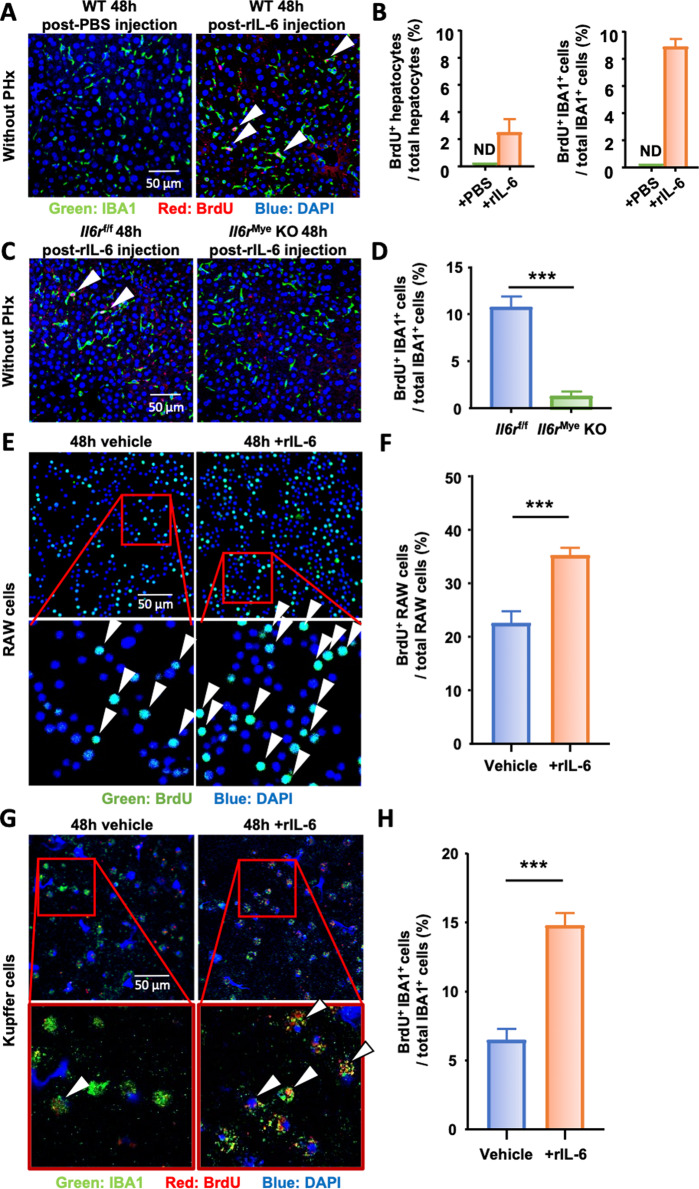
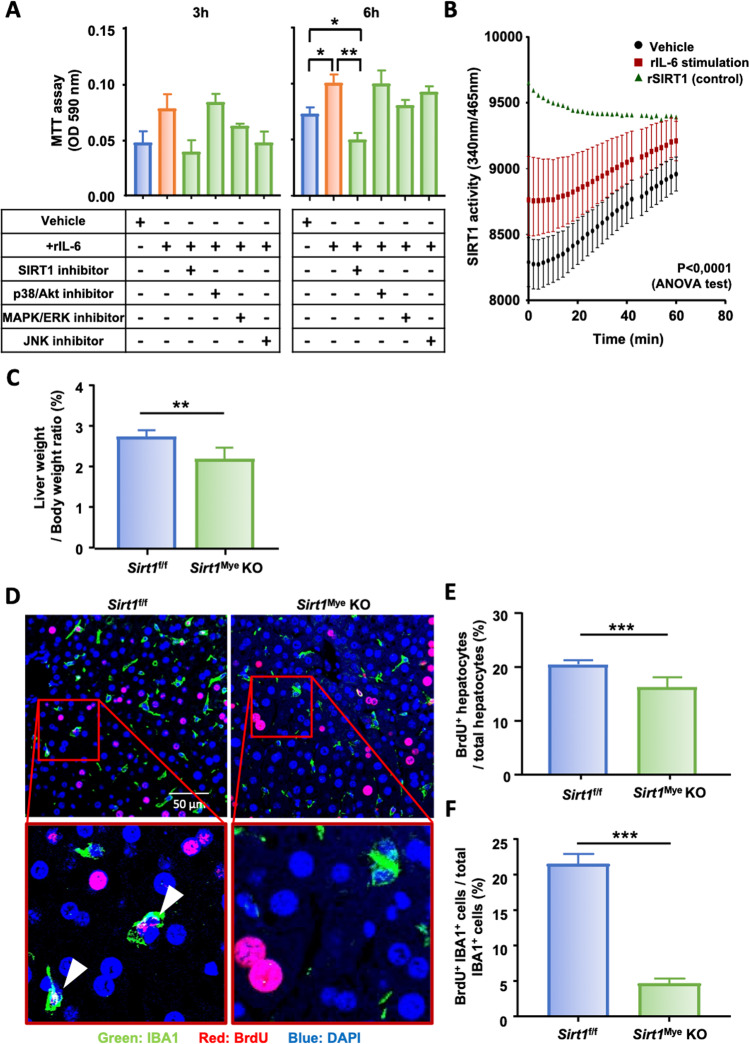
Kupffer cells (KCs), which are liver-resident macrophages, originate from the fetal yolk sac and represent one of the largest macrophage populations in the body. However, the current data on the origin of the cells that restore macrophages during liver injury and regeneration remain controversial. Here, we address the question of whether liver macrophage restoration results from circulating monocyte infiltration or local KC proliferation in regenerating livers after partial hepatectomy (PHx) and uncover the underlying mechanisms. By using several strains of genetically modified mice and performing immunohistochemical analyses, we demonstrated that local KC proliferation mainly contributed to the restoration of liver macrophages after PHx. Peak KC proliferation was impaired in Il6-knockout (KO) mice and restored after the administration of IL-6 protein, whereas KC proliferation was not affected in Il4-KO or Csf2-KO mice. The source of IL-6 was identified using hepatocyte- and myeloid-specific Il6-KO mice and the results revealed that both hepatocytes and myeloid cells contribute to IL-6 production after PHx. Moreover, peak KC proliferation was also impaired in myeloid-specific Il6 receptor-KO mice after PHx, suggesting that IL-6 signaling directly promotes KC proliferation. Studies using several inhibitors to block the IL-6 signaling pathway revealed that sirtuin 1 (SIRT1) contributed to IL-6-mediated KC proliferation in vitro. Genetic deletion of the Sirt1 gene in myeloid cells, including KCs, impaired KC proliferation after PHx. In conclusion, our data suggest that KC repopulation after PHx is mainly driven by local KC proliferation, which is dependent on IL-6 and SIRT1 activation in KCs.

Keywords: IL-6; Kupffer cells; Liver regeneration; Myeloid cells; Sirtuin 1.


Conflict of interest statement

The authors declare no competing interests.

Figures

Fig. 1
Fig. 1
Liver macrophage restoration after PHx is mainly driven by local KC proliferation. AC Immunofluorescence analysis of liver tissue sections from sham and PHx mice (n = 5–6/group) 32 h to 72 h after surgery and stained with antibodies against IBA1 (green) and BrdU (red). Hepatocytes were identified by their large round nuclei, and macrophages were identified by IBA1 staining. Proliferating macrophages are highlighted by arrowheads. The quantification of hepatocyte and macrophage proliferation at the indicated time points is shown in panels (B) and (C). D, E IBA1 (green) and CLEC4F (red) immunofluorescence staining of liver tissue sections from sham and PHx mice 48 h after surgery (n = 6/group). Quantification of CLEC4F+ and CLEC4F- cells among IBA1+ cells in sham and PHx mice at 48 h is shown in panel (E). F, G GFP immunohistochemical staining of liver tissue sections from Cx3cr1GFP/- mice collected 48 h after surgery (n = 6/group). The number of CX3CR1GFP+ cells was counted and is shown in panel (G). Arrowheads represent CX3CR1GFP+ infiltrating monocytes. H, I Immunofluorescence analysis of liver tissue sections from WT and Ccr2-KO mice collected 40 h and 48 h after PHx (n = 5–6/group) and stained with antibodies against IBA1 (green) and BrdU (red). Arrowheads represent proliferating macrophages. Quantification of BrdU+ IBA1+ proliferating macrophages is shown in panel (I). BrdU was injected 2 h before sacrifice and is shown in panels (A) and (H). The values are expressed as the mean ± SEM. *P < 0.05, **P < 0.01, ***P < 0.001 in comparison to the corresponding sham groups in panels (B) and (C) and to CLEC4F- cells in panel (E)
Fig. 2
Fig. 2
IL-4 and CSF-2 are not required for the peak KC proliferation after PHx. A Kinetics of Il4 mRNA expression in liver homogenates from WT and Il4-KO mice after PHx as determined by RT-qPCR. B, C Immunofluorescence analysis of liver tissue sections from WT and Il4-KO mice collected 48 h after PHx (n = 6/group) and stained with antibodies against IBA1 (green) and BrdU (red). Arrowheads represent proliferating KCs. The quantification of KC proliferation in WT and Il4-KO mice 48 h post PHx is shown in panel (C). D Kinetics of Csf2 mRNA expression in liver homogenates from WT and Csf2-KO mice after PHx as determined by RT-qPCR. E, F Immunofluorescence analysis of liver tissue sections from WT and Csf2-KO mice collected 48 h after PHx (n = 6/group) and stained with antibodies against IBA1 (green) and BrdU (red). Arrowheads represent proliferating KCs. The quantification of KC proliferation in WT and Csf2-KO mice  48 h post PHx is shown in panel (F). The values are expressed as the mean ± SEM. BrdU was injected 2 h before sacrifice, as shown in panels (B) and (E)
Fig. 3
Fig. 3
IL-6 is required for proper KC proliferation after PHx. A Kinetics of Il6 mRNA expression in liver homogenates from mice subjected to sham or PHx collected at the indicated time points and analyzed by RT-qPCR. BD Immunofluorescence staining of liver tissue sections from WT, Il6-KO mice, and Il6-KO mice intravenously injected with rIL-6 and collected 48 h after PHx (n = 6–7/group). IBA1+ (green) and BrdU+ (red) cells indicate proliferating KCs. BrdU was injected 2 h before sacrifice, as shown in panel (B). The quantification of proliferating hepatocytes and KC 48 h post-PHx is shown in panels (C) and (D), respectively. The values are expressed as the mean ± SEM. *P < 0.05, **P < 0.01, ***P < 0.001
Fig. 4
Fig. 4
Hepatocytes and KCs are important sources of IL-6 after PHx. A RT-qPCR confirming Il6 deletion in KCs from Il6Mye-KO mice. Il6 mRNA expression in KCs isolated from control Il6f/f mice injected with PBS or LPS and Il6Mye-KO mice injected with LPS (3 h injection). B Serum IL-6 levels in Il6f/f, Il6Hep-KO, and Il6Mye-KO mice 3 h after PHx (n = 6/group). C, D Immunofluorescence analysis of liver tissue sections from Il6f/f, Il6Hep-KO, and Il6Mye-KO mice collected 48 h after PHx (n = 6/group) and stained with anti-IBA1 (green) and BrdU (red) antibodies. BrdU was injected 2 h before sacrifice, as shown in panel (C). Arrowheads represent proliferating KCs. The quantification of macrophage proliferation in the liver 48 h after PHx is shown in panel (D). The values are expressed as the mean ± SEM. *P < 0.05, **P < 0.01
Fig. 5
Fig. 5
Liver macrophage proliferation is impaired in Il6rMye-KO mice after PHx. A Liver-to-body weight ratios of Il6rf/f and Il6rMye-KO mice post-PHx. B Immunofluorescence analysis of liver tissue sections from Il6rf/f and Il6rMye-KO mice subjected to PHx (n = 6/group). Liver tissues were collected 40 h, 48 h, and 72 h after PHx and stained with antibodies targeting IBA1 (green) and BrdU (red). BrdU was injected 2 h before sacrifice. Arrowheads represent proliferating KCs. The quantification of hepatocyte and KC proliferation from panel B is shown in panels (C) and (D). E Immunofluorescence analysis of liver tissue sections from Il6rf/f and Il6rMye-KO mice 48 h and 72 h after PHx staining with anti-F4/80 and TUNEL antibodies. The values are expressed as the mean ± SEM. *P < 0.05
Fig. 6
Fig. 6
IL-6 stimulates macrophage proliferation in vivo and in vitro. A, B Naïve wild-type mice (without PHx) were intravenously injected with PBS (control) or rIL-6, and liver tissues were collected 48 h after injection (n = 7/group) and subjected to immunofluorescence staining with antibodies against IBA1 (green) and BrdU (red). Arrowheads represent proliferating KC. The quantifications of BrdU+ hepatocytes and BrdU+ IBA1+ cells are shown in panel B. ND: not detected. C, D Il6rf/f and Il6rMye-KO mice without PHx were intravenously injected with rIL-6 (n = 7/group), and liver tissues were collected 48 h after injection and subjected to immunofluorescence staining with antibodies against IBA1 (green) and BrdU (red). Arrowheads represent proliferating KC. The quantification of proliferating KCs in livers from Il6rf/f and Il6rMye-KO mice 48 h after intravenous injection of rIL-6 is shown in panel (D). E, F Immunofluorescence staining of RAW cells 48 h after exposure to rIL-6 or control medium (vehicle) with antibodies against BrdU (green). Proliferating RAW cells are identified by arrowheads. The quantification of proliferating RAW cells is shown in panel (F). G, H Immunofluorescence staining of freshly isolated KCs 48 h after exposure to rIL-6 or control medium (vehicle) with antibodies against IBA1 (green) and BrdU (red). The arrowheads represent proliferating KC. The quantification of KC proliferation is shown in panel (H). BrdU was injected 2 h before sacrifice in panels (A) and (C) and was added to the culture medium 2 h before collecting the cells in panels (E) and (G). The values are expressed as the mean ± SEM. ***P < 0.001
Fig. 7
Fig. 7
IL-6 stimulates KC proliferation by inducing SIRT1 intracellular mechanisms following PHx. A RAW cell proliferation was analyzed by MTT assays 3 h and 6 h after exposure to recombinant IL-6 (rIL-6) and the indicated inhibitors or the vehicle control. B SIRT1 enzymatic activity in RAW cells after exposure to rIL-6 or control medium. Recombinant SIRT1 (rSIRT1) activity was included as a positive control. C Liver-to-body weight ratios of Sirt1f/f and Sirt1Mye-KO mice that were sacrificed 48 h post-PHx. D Immunofluorescence staining of liver tissue sections from Sirt1f/f and Sirt1Mye-KO mice 48 h after PHx (n = 6/group) with antibodies against IBA1+ (green) and BrdU+ (red). Arrowheads represent proliferating KCs. The quantification of proliferating hepatocytes and KCs from panel (D) is shown in panels (E) and (F). The values are expressed as the mean ± SEM. *P < 0.05, **P < 0.01, ***P < 0.001

References

    1. Dong Z, Wei H, Sun R, Tian Z. The roles of innate immune cells in liver injury and regeneration. Cell Mol Immunol. 2007;4:241–52. - PubMed
    1. Markose D, Kirkland P, Ramachandran P, Henderson NC. Immune cell regulation of liver regeneration and repair. J Immunol Regen Med. 2018;2:1–10.
    1. Gao B, Jeong W-I, Tian Z. Liver: an organ with predominant innate immunity. Hepatology. 2008;47:729–36. - PubMed
    1. Heymann F, Tacke F. Immunology in the liver—from homeostasis to disease. Nat Rev Gastroenterol Hepatol. 2016;13:88–110. - PubMed
    1. Merlin S, Bhargava KK, Ranaldo G, Zanolini D, Palestro CJ, Santambrogio L, et al. Kupffer cell transplantation in mice for elucidating monocyte/macrophage biology and for potential in cell or gene therapy. Am J Pathol. 2016;186:539–51. - PMC - PubMed

Publication types