. 2021 Aug;22(8):996-1007.
doi: 10.1038/s41590-021-00965-7. Epub 2021 Jul 19.

BATF regulates progenitor to cytolytic effector CD8+ T cell transition during chronic viral infection

Affiliations

BATF regulates progenitor to cytolytic effector CD8+ T cell transition during chronic viral infection

Yao Chen et al. Nat Immunol. 2021 Aug.

Abstract

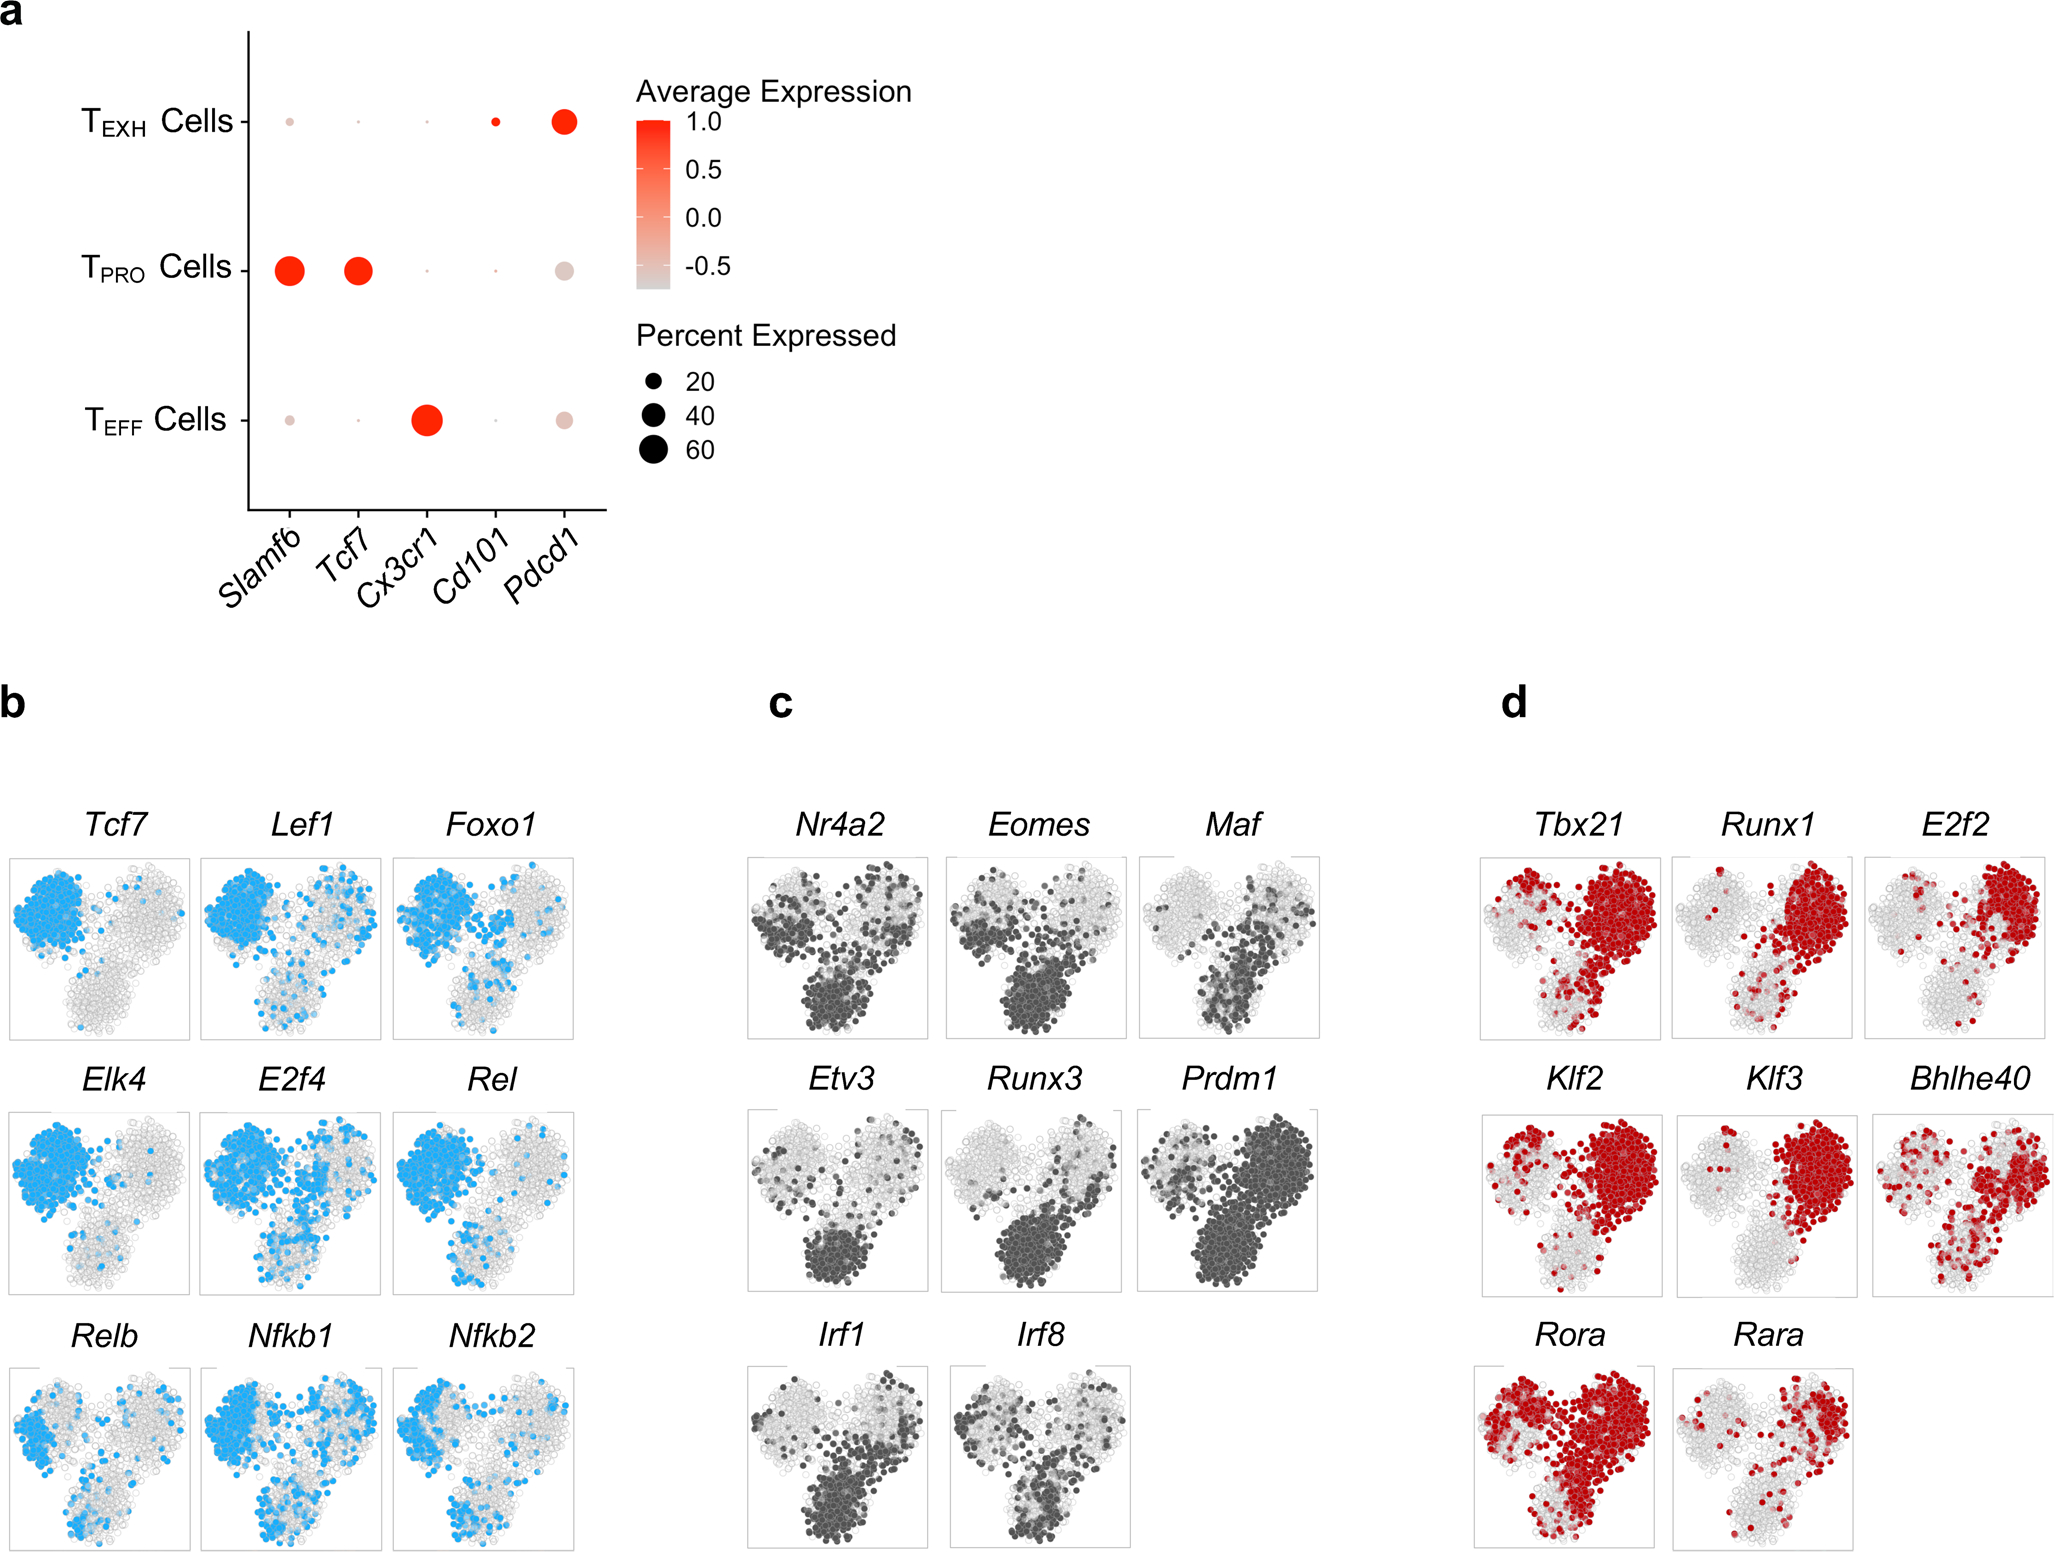
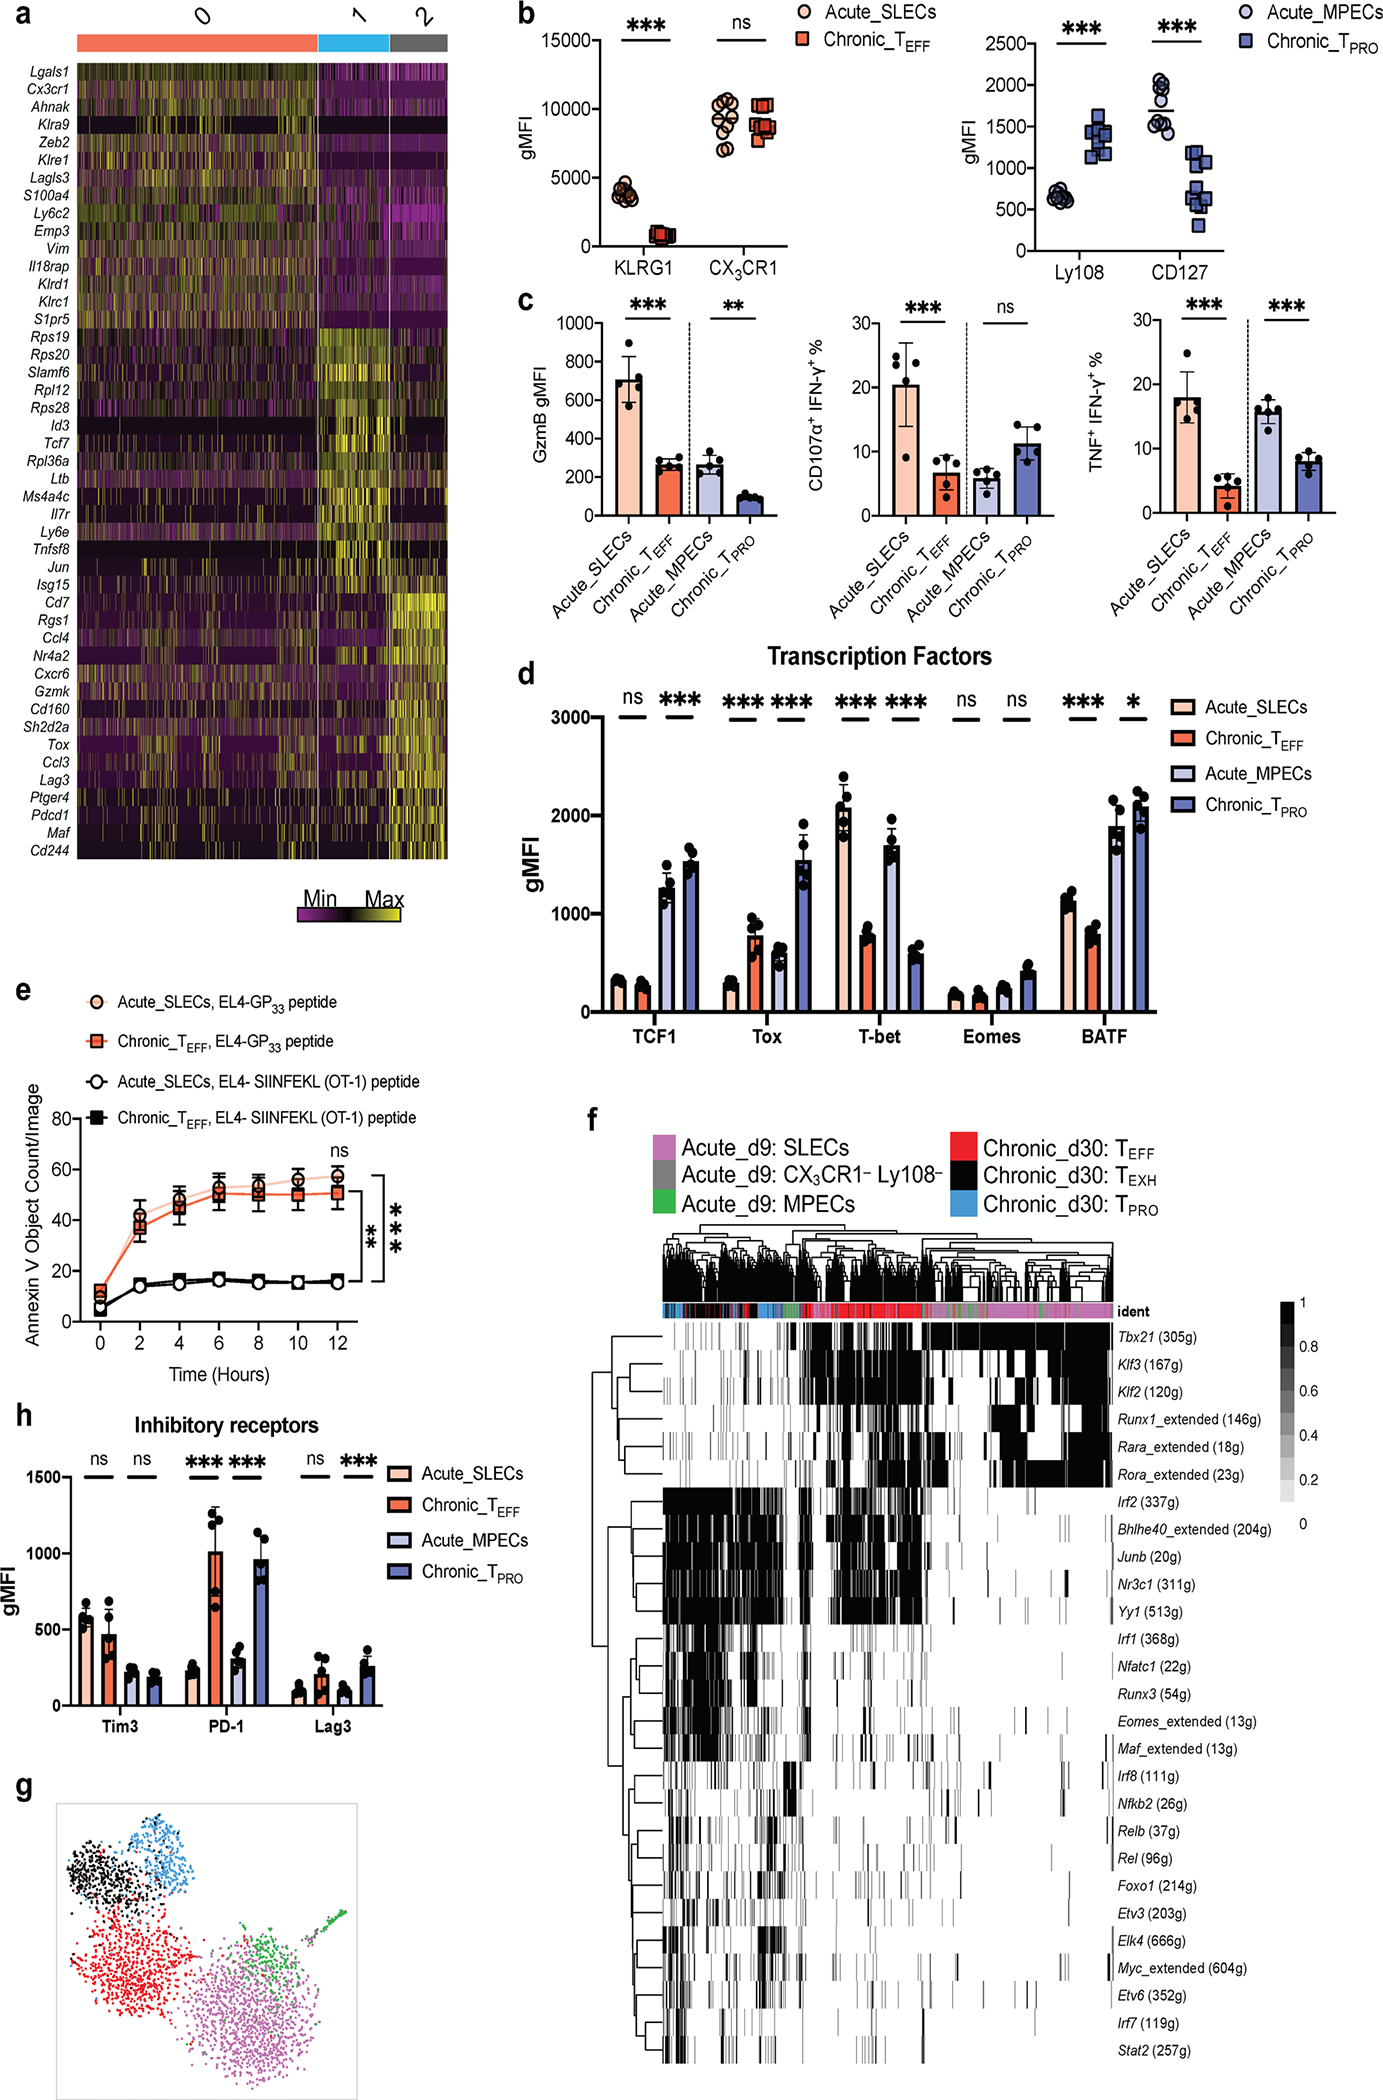
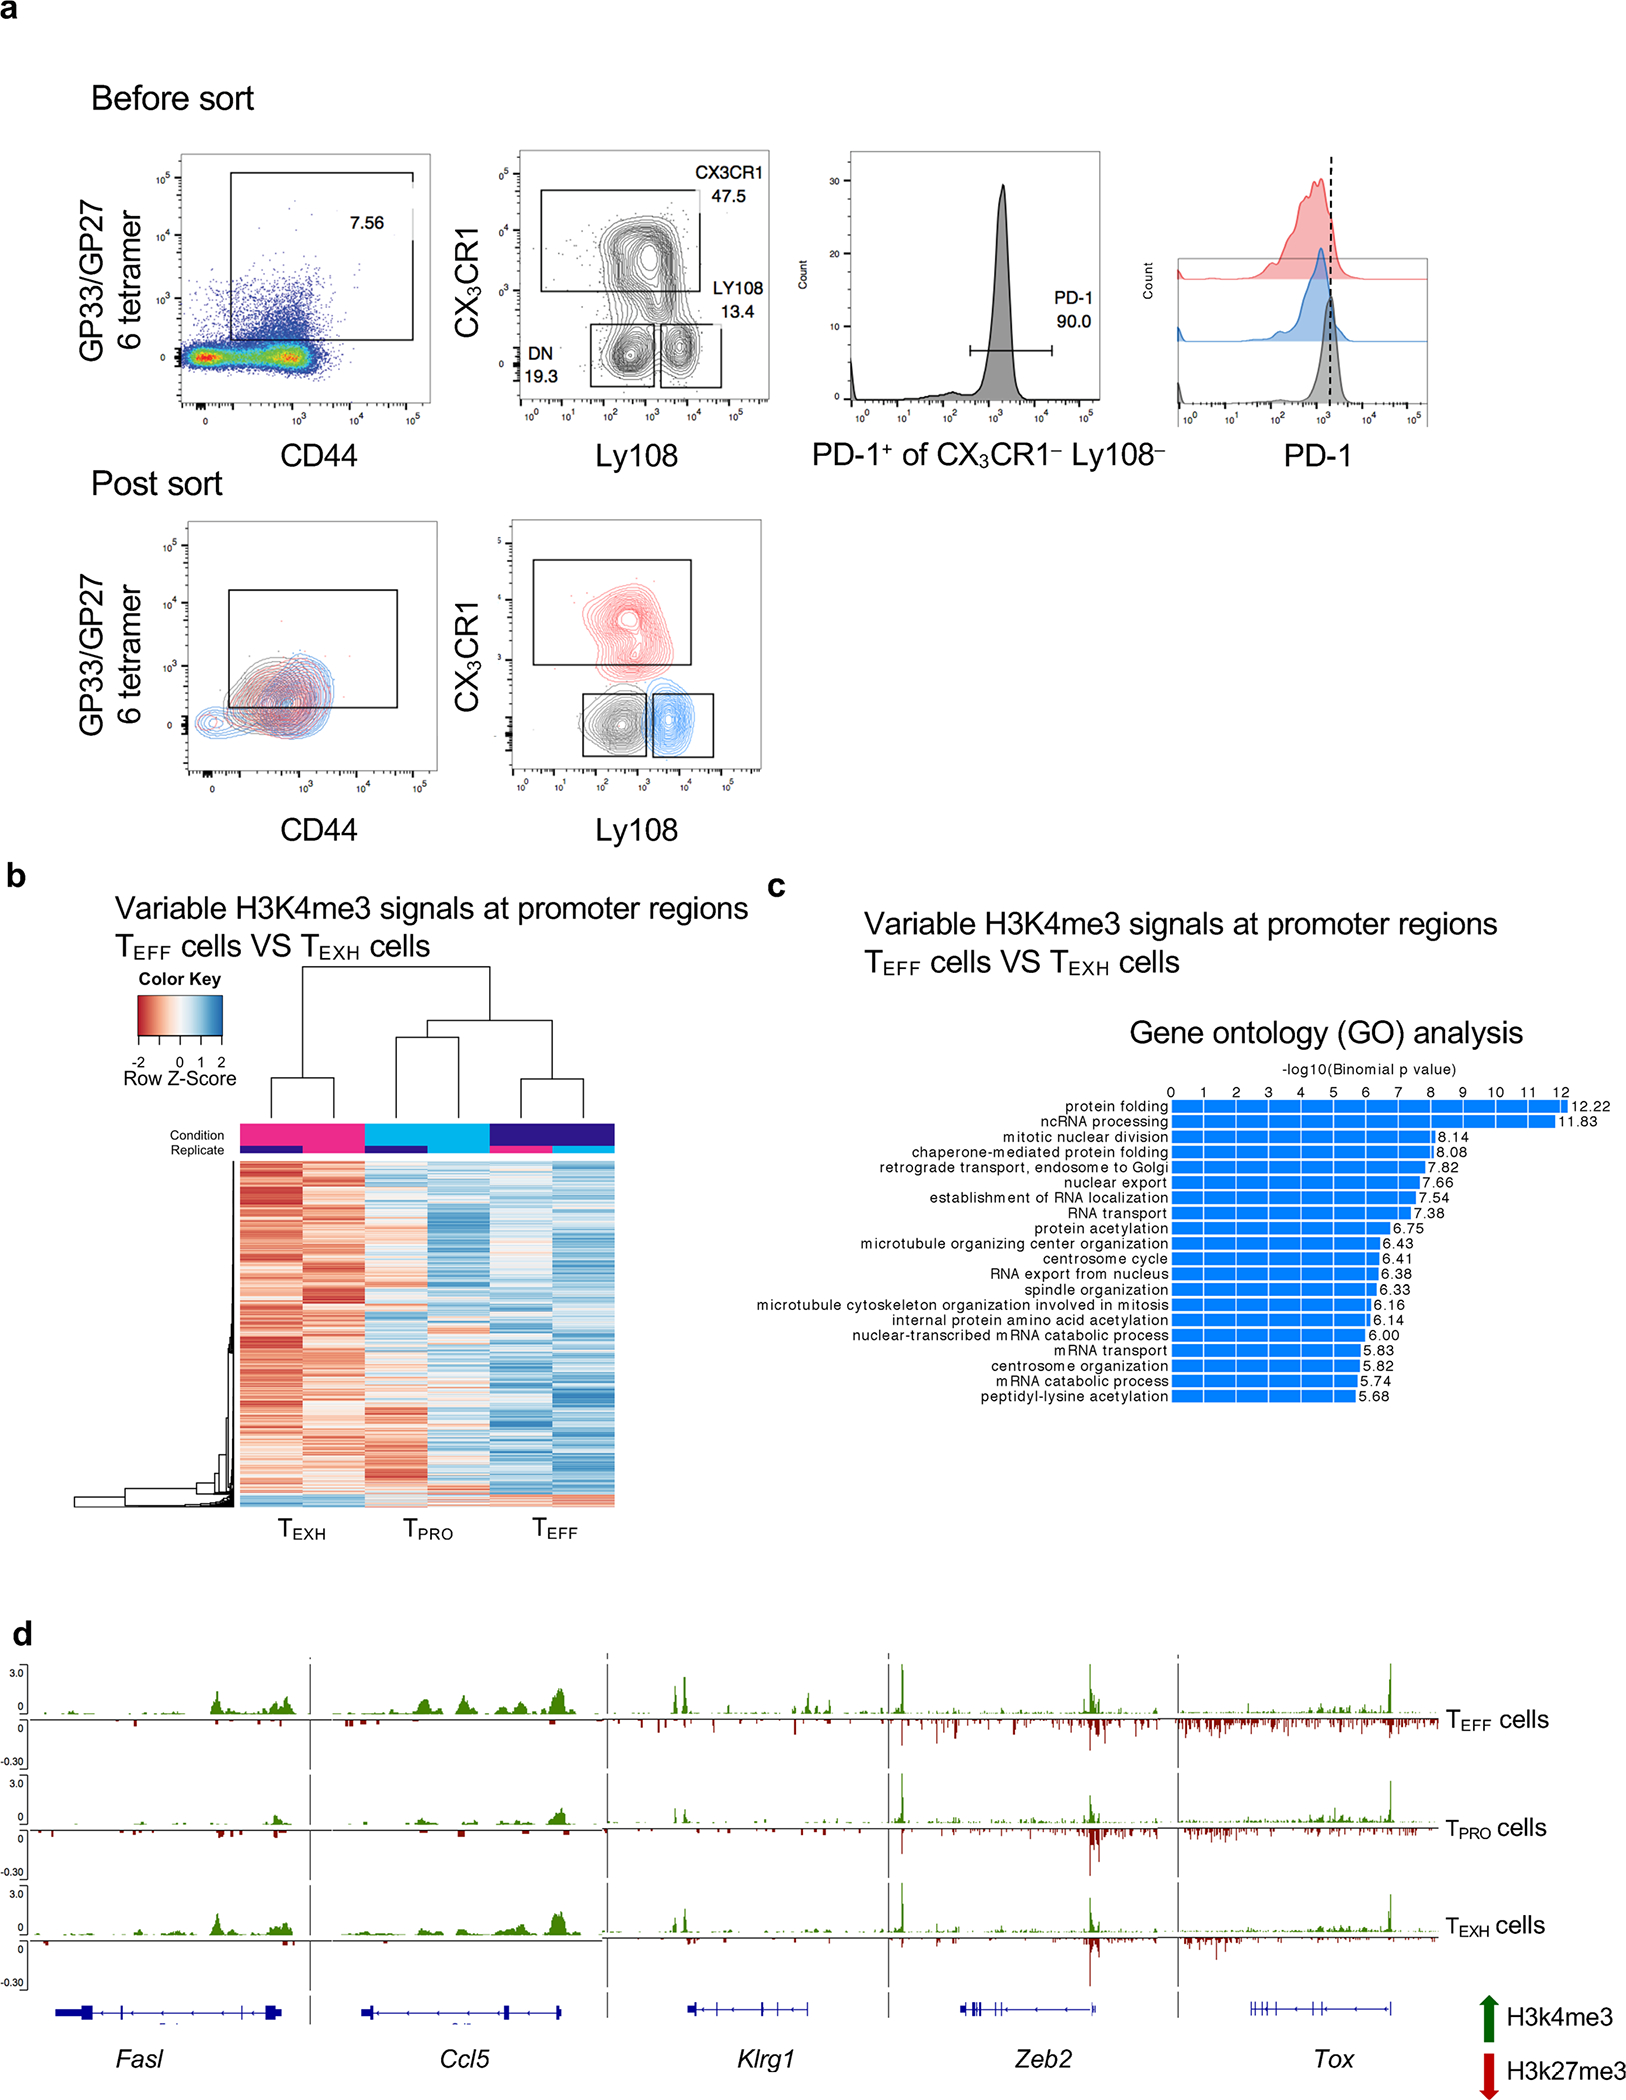
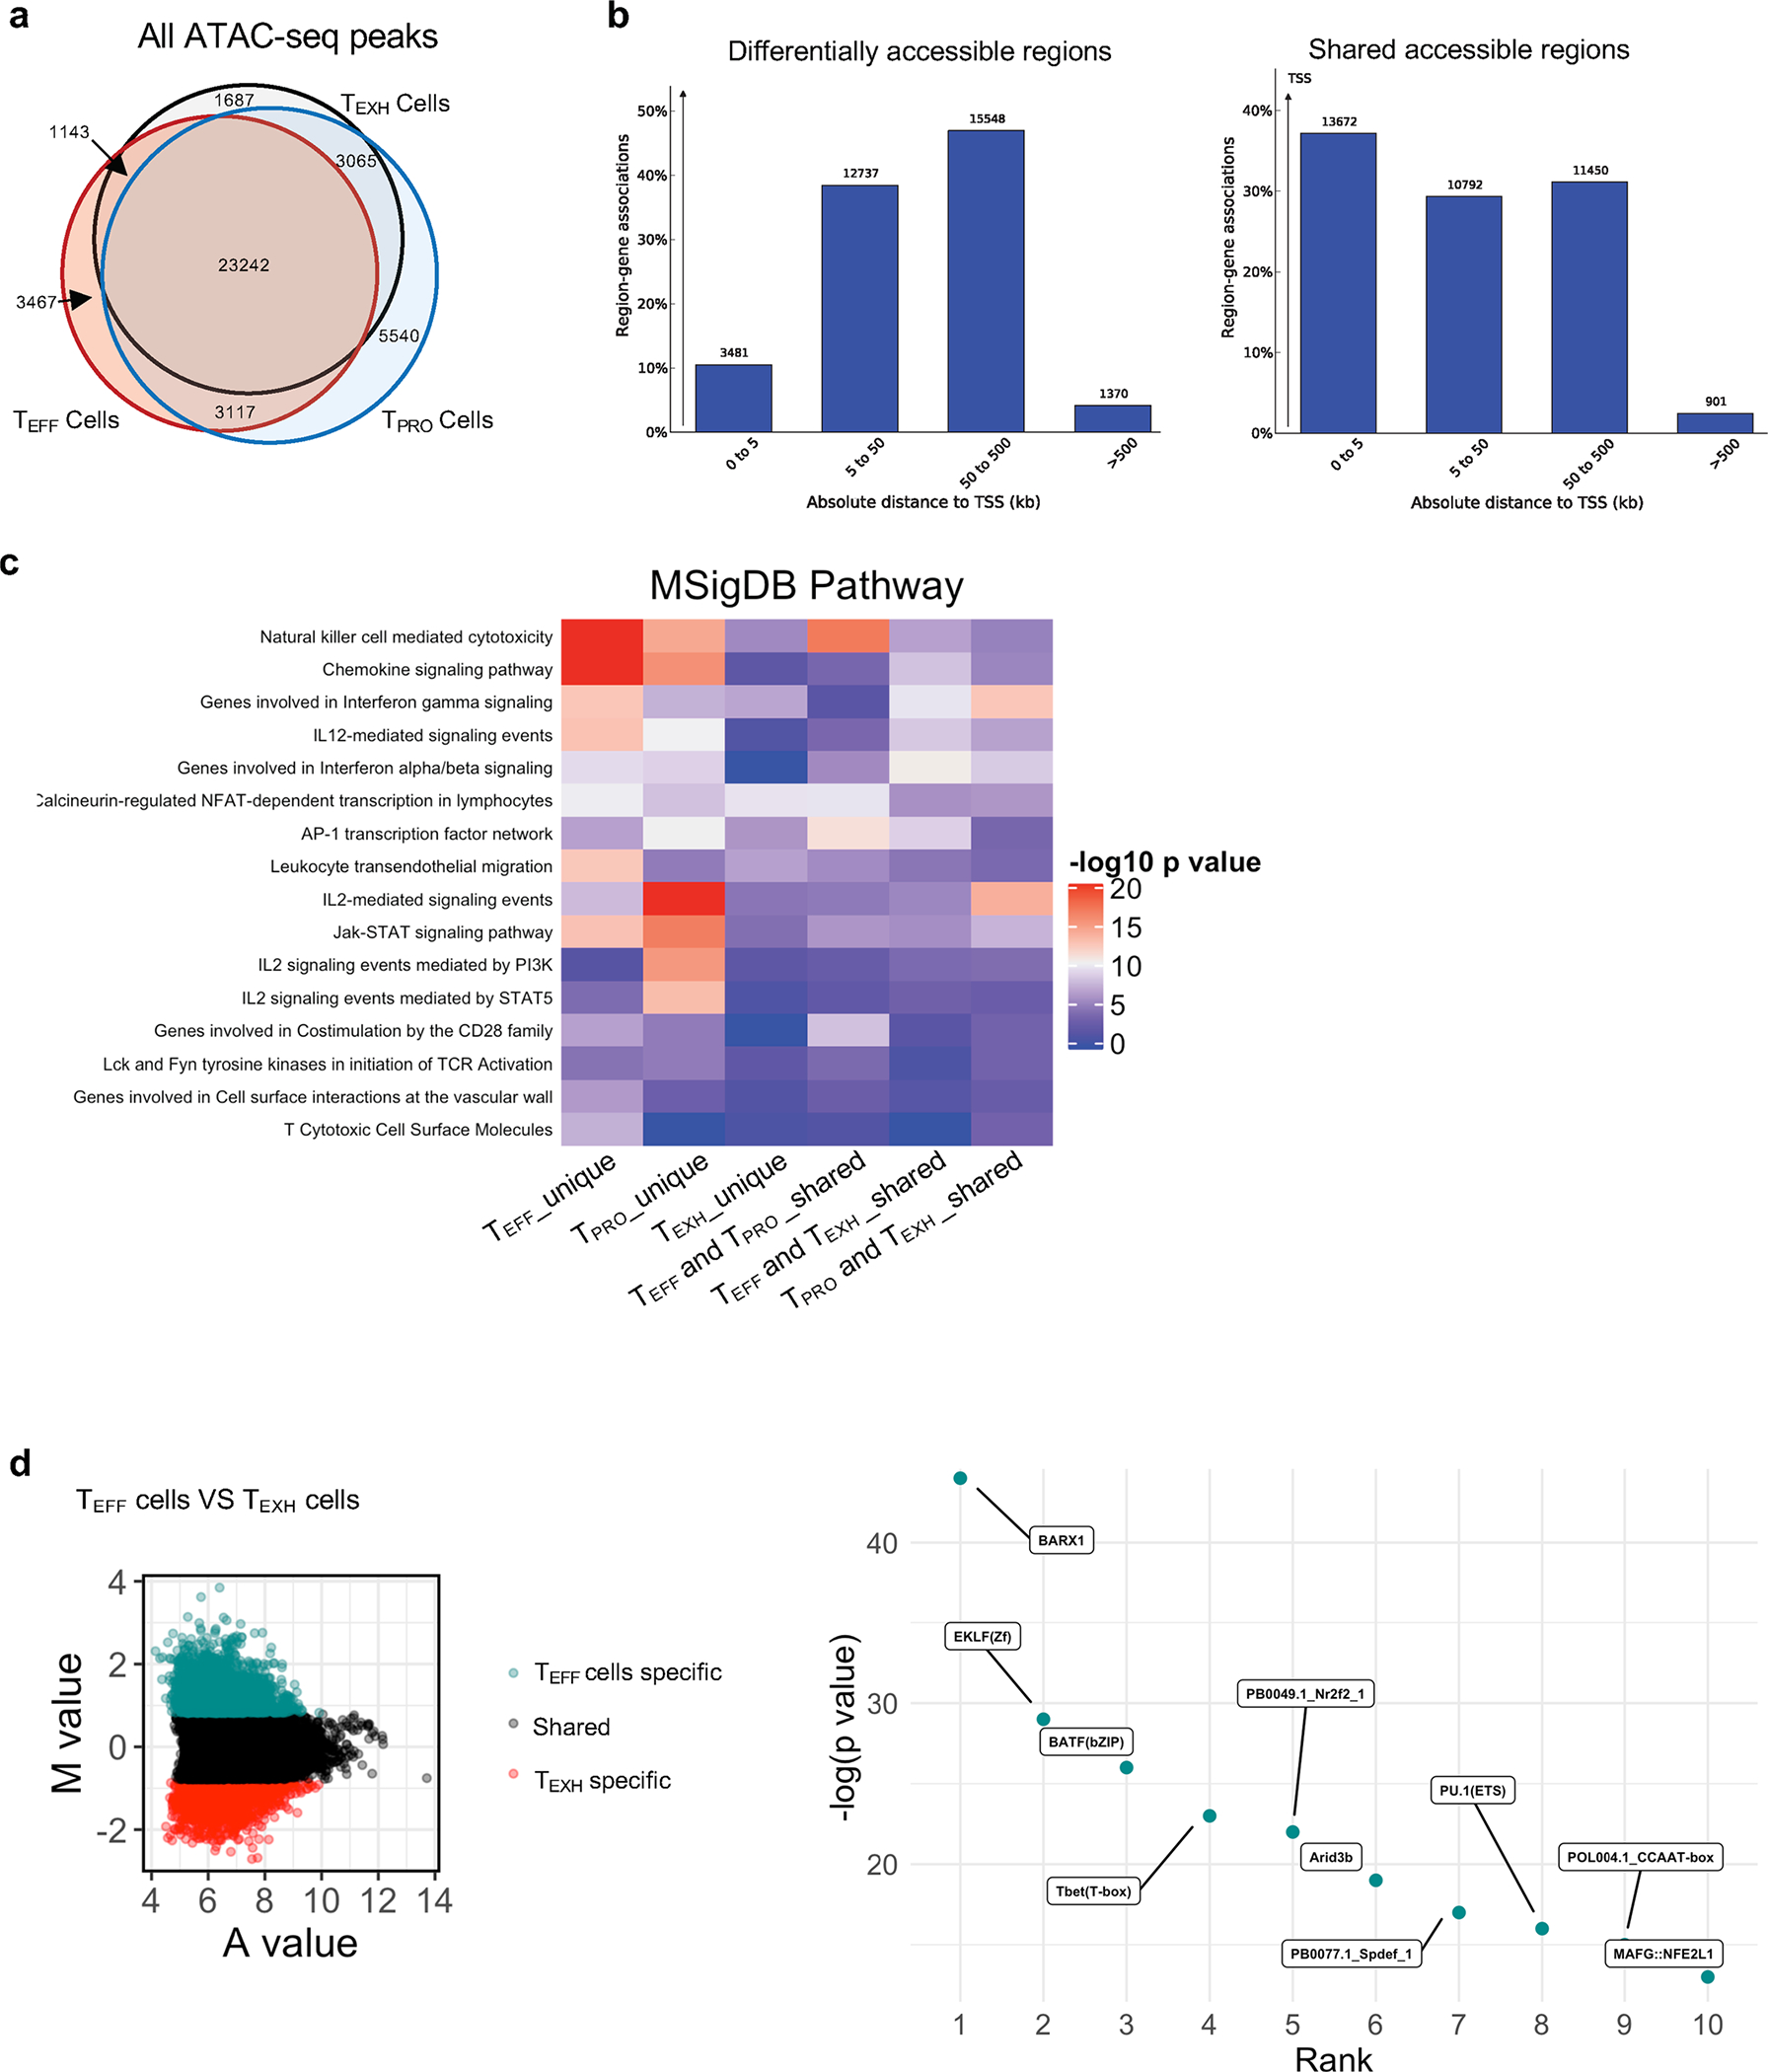
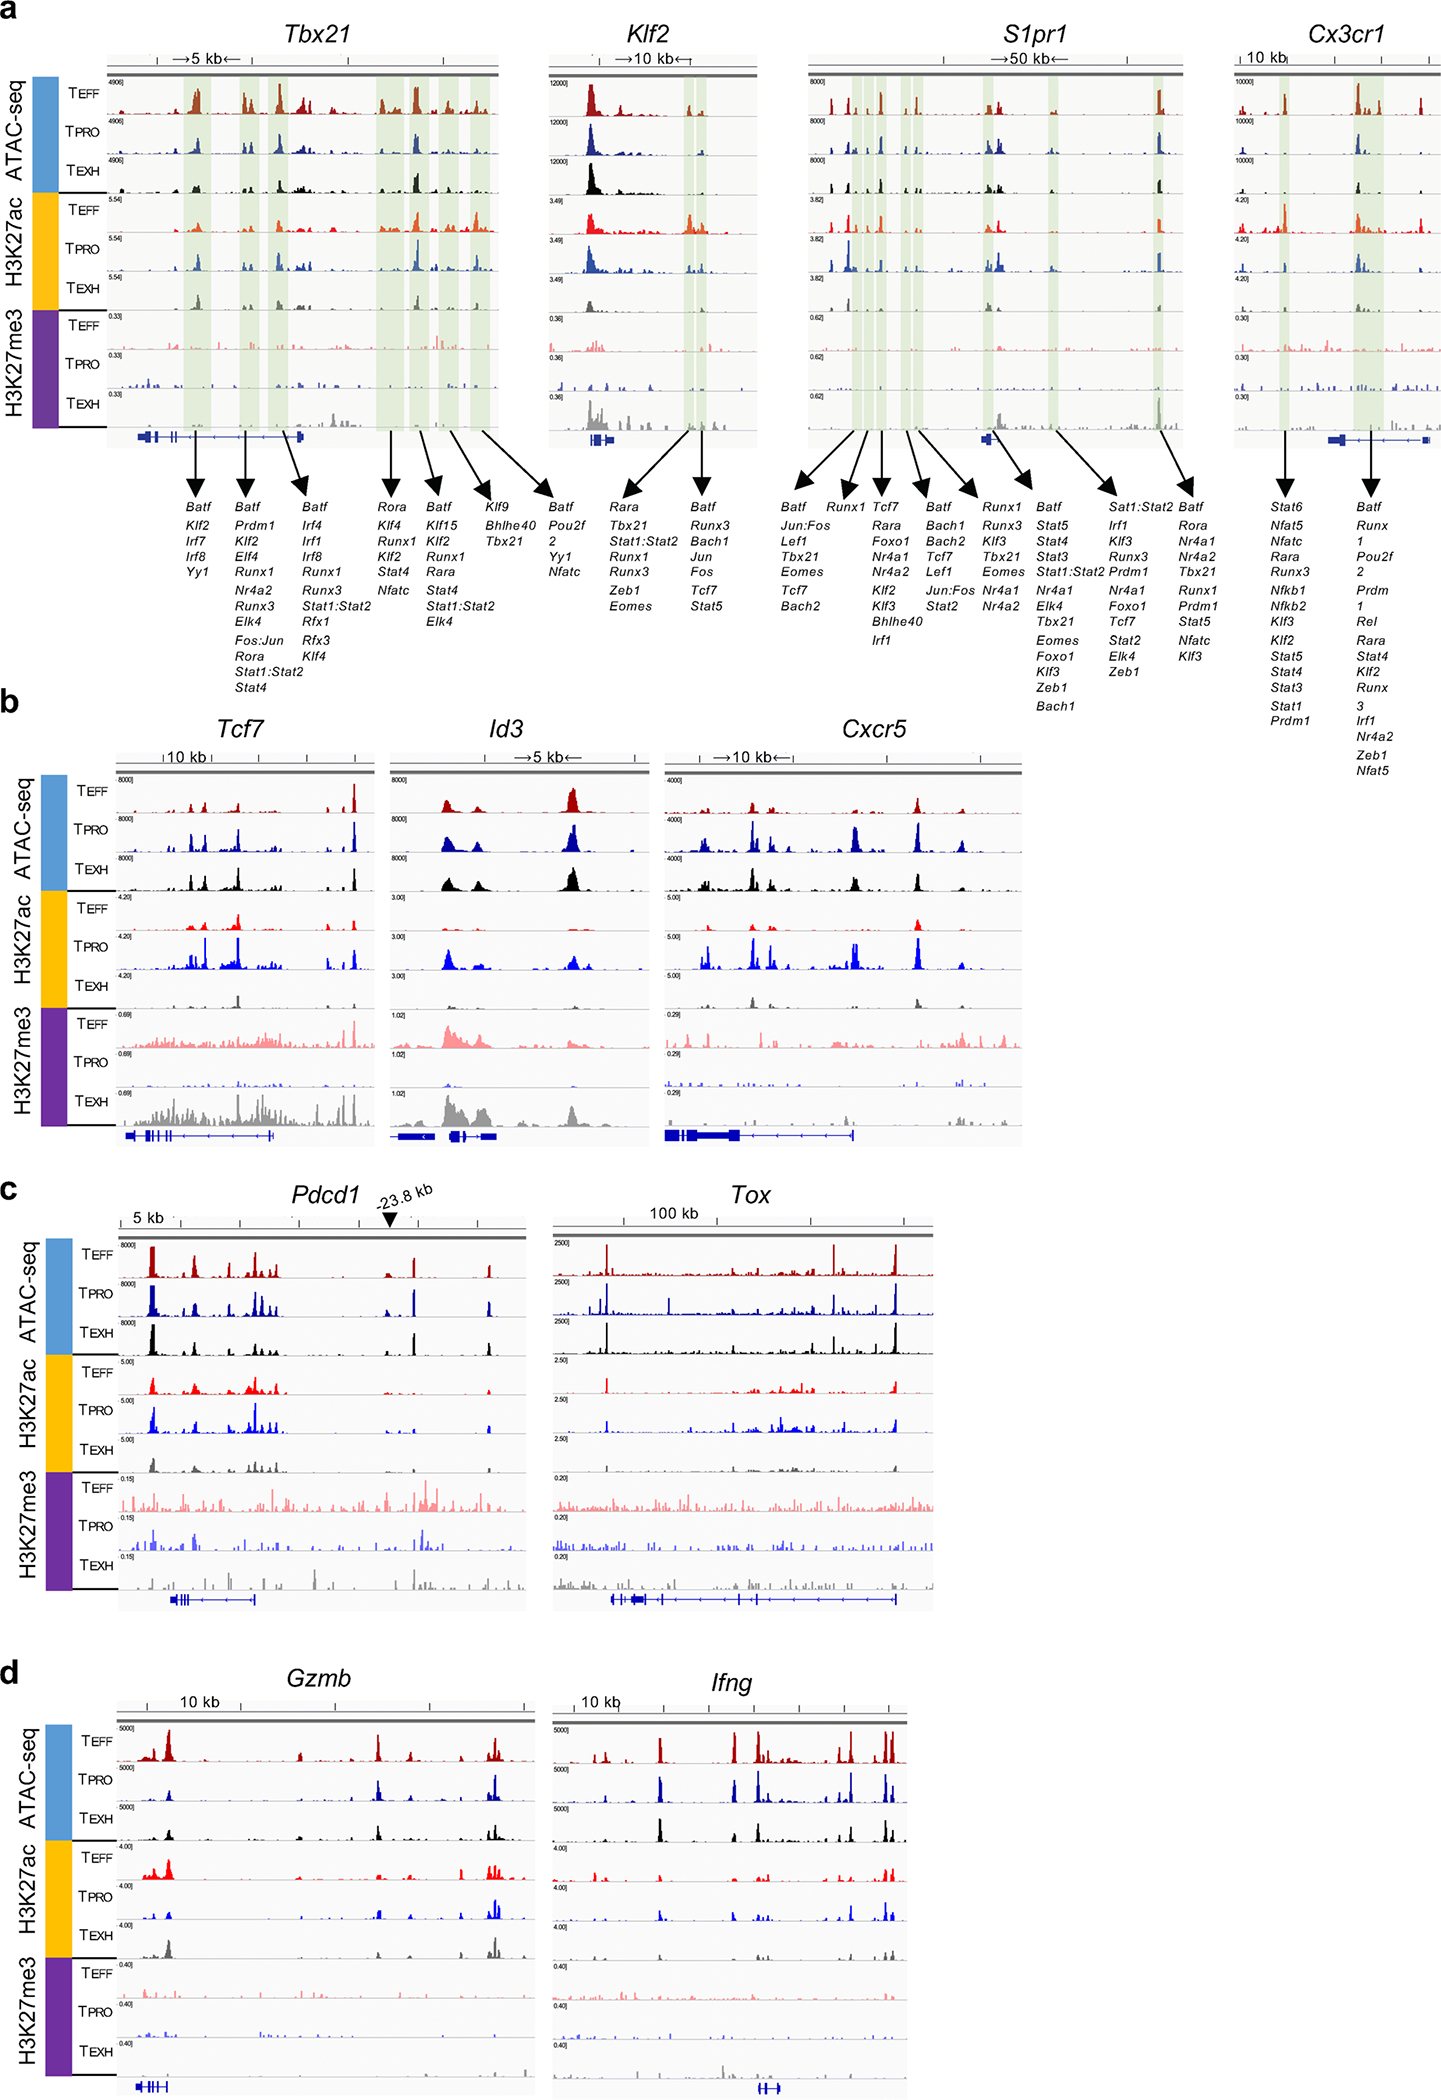
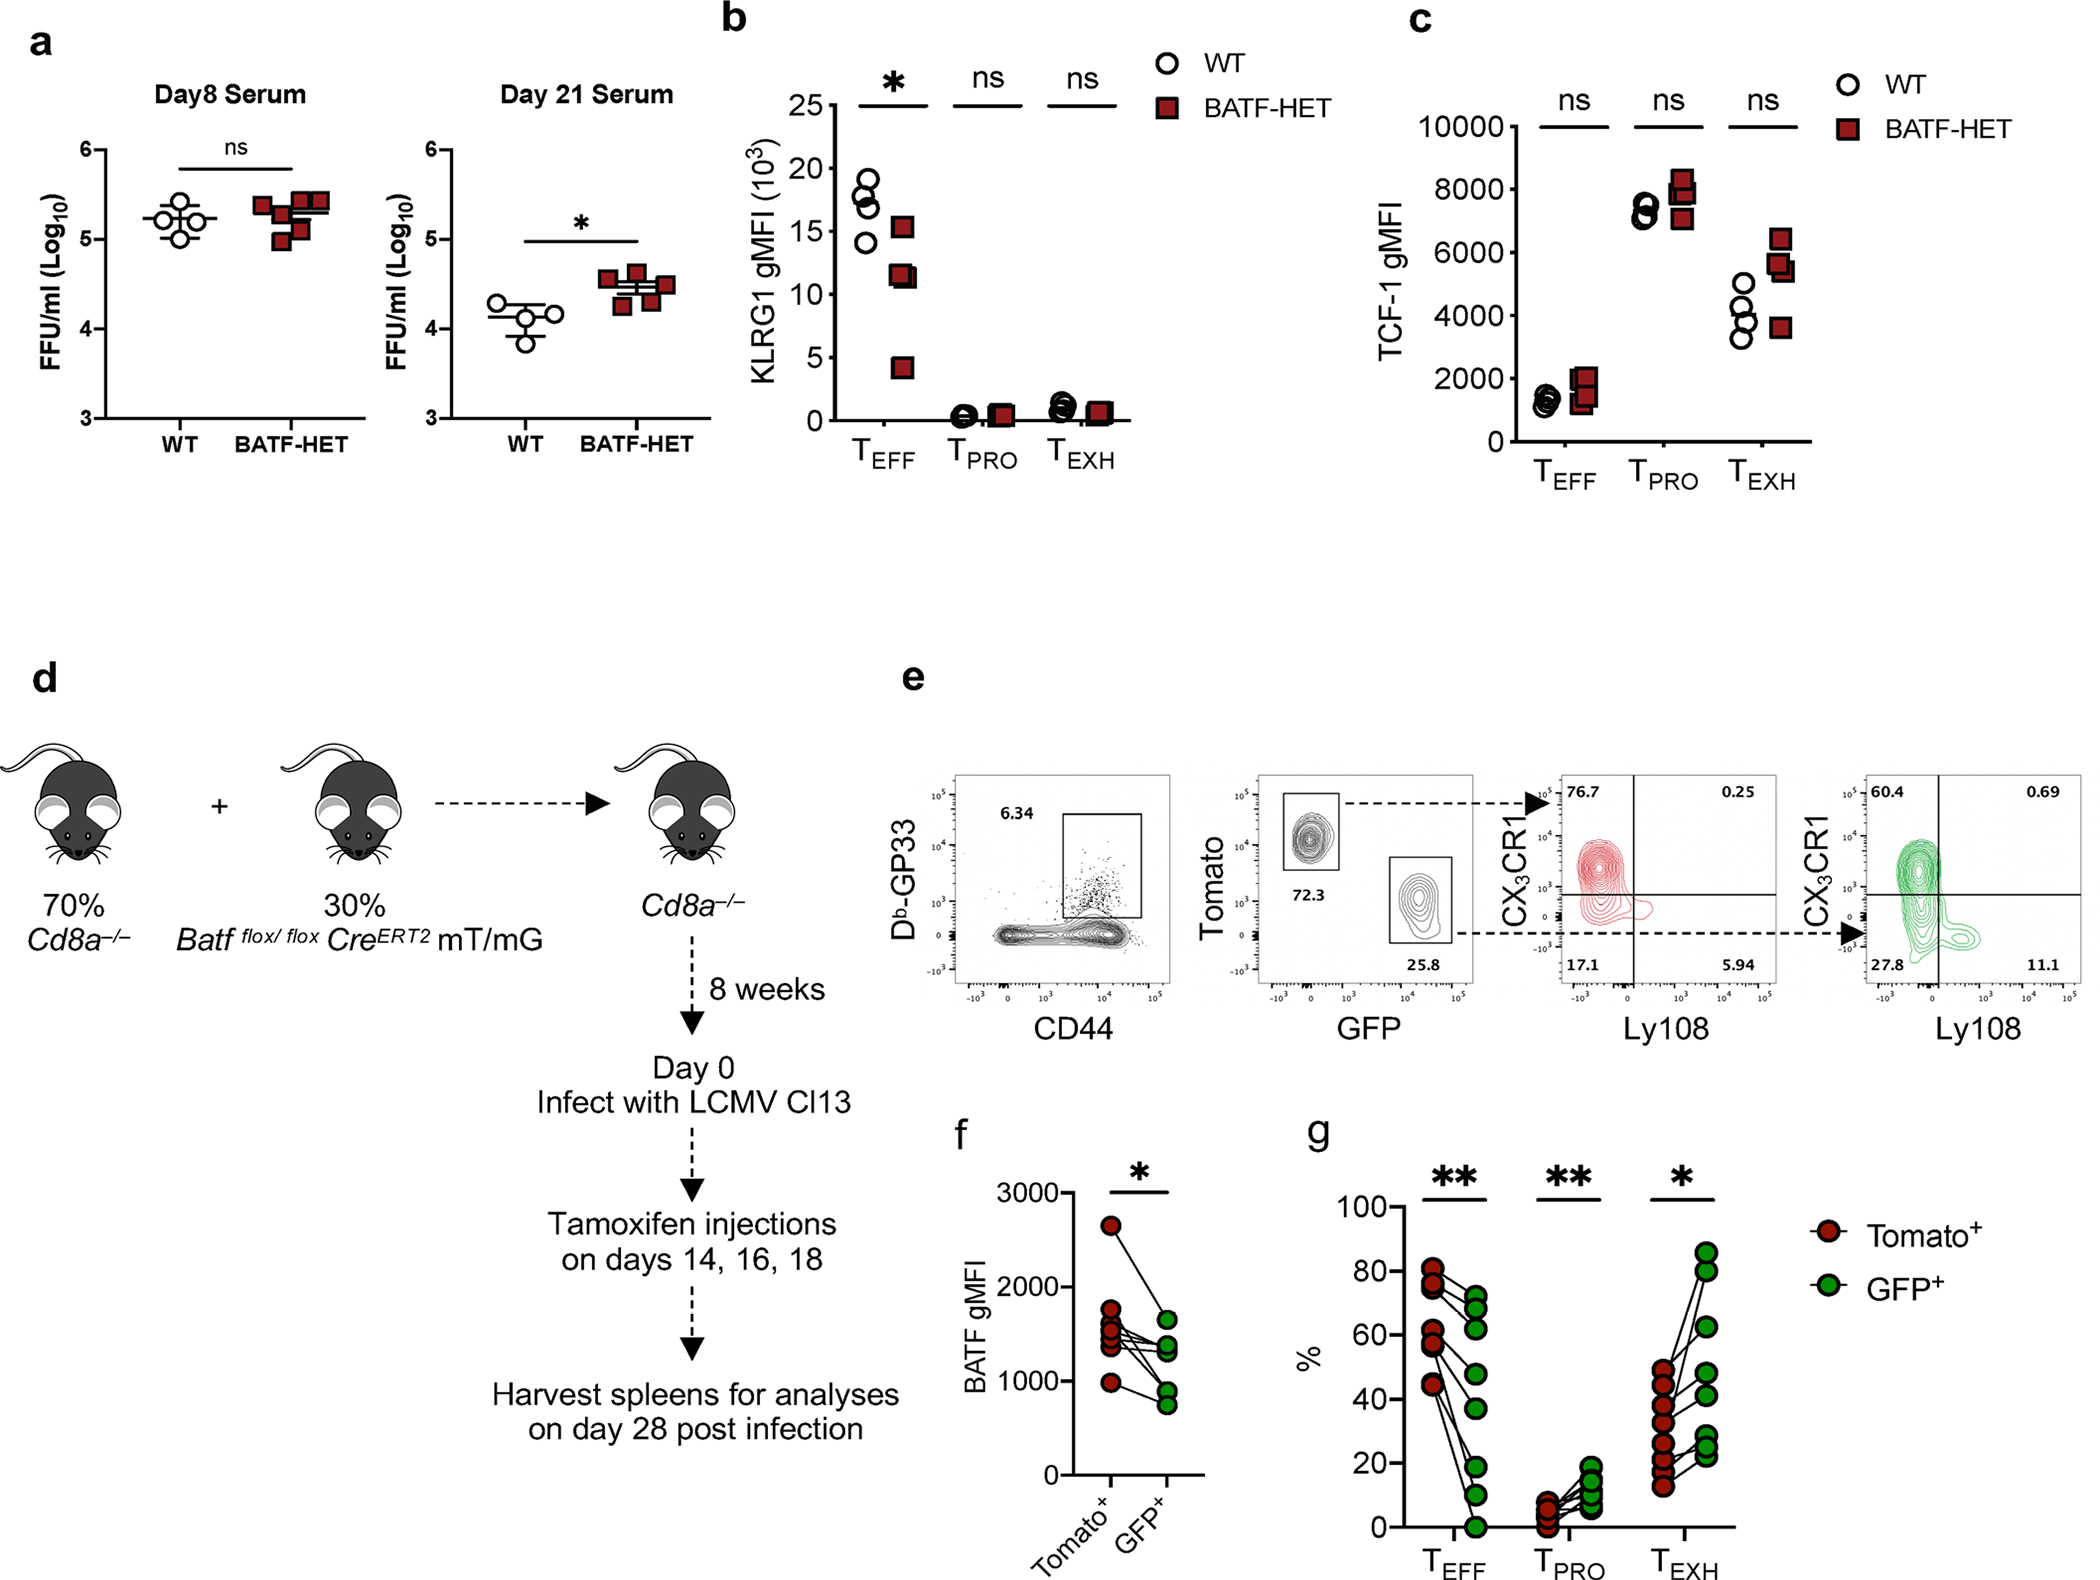
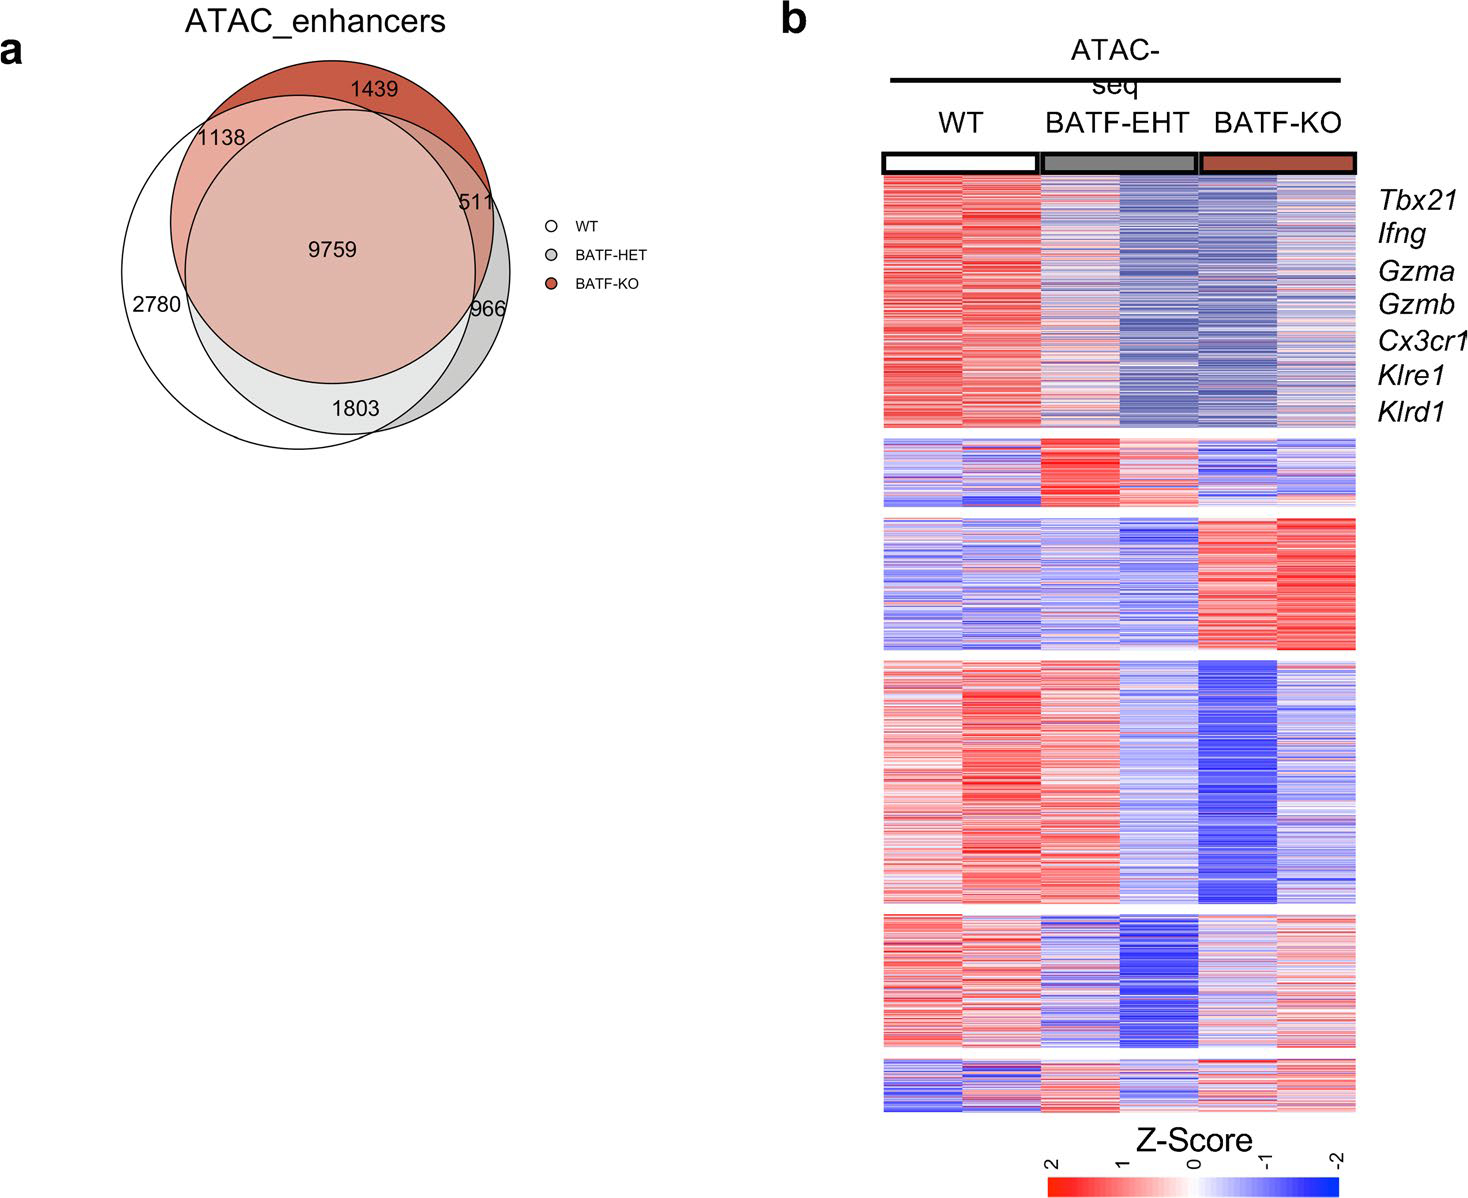
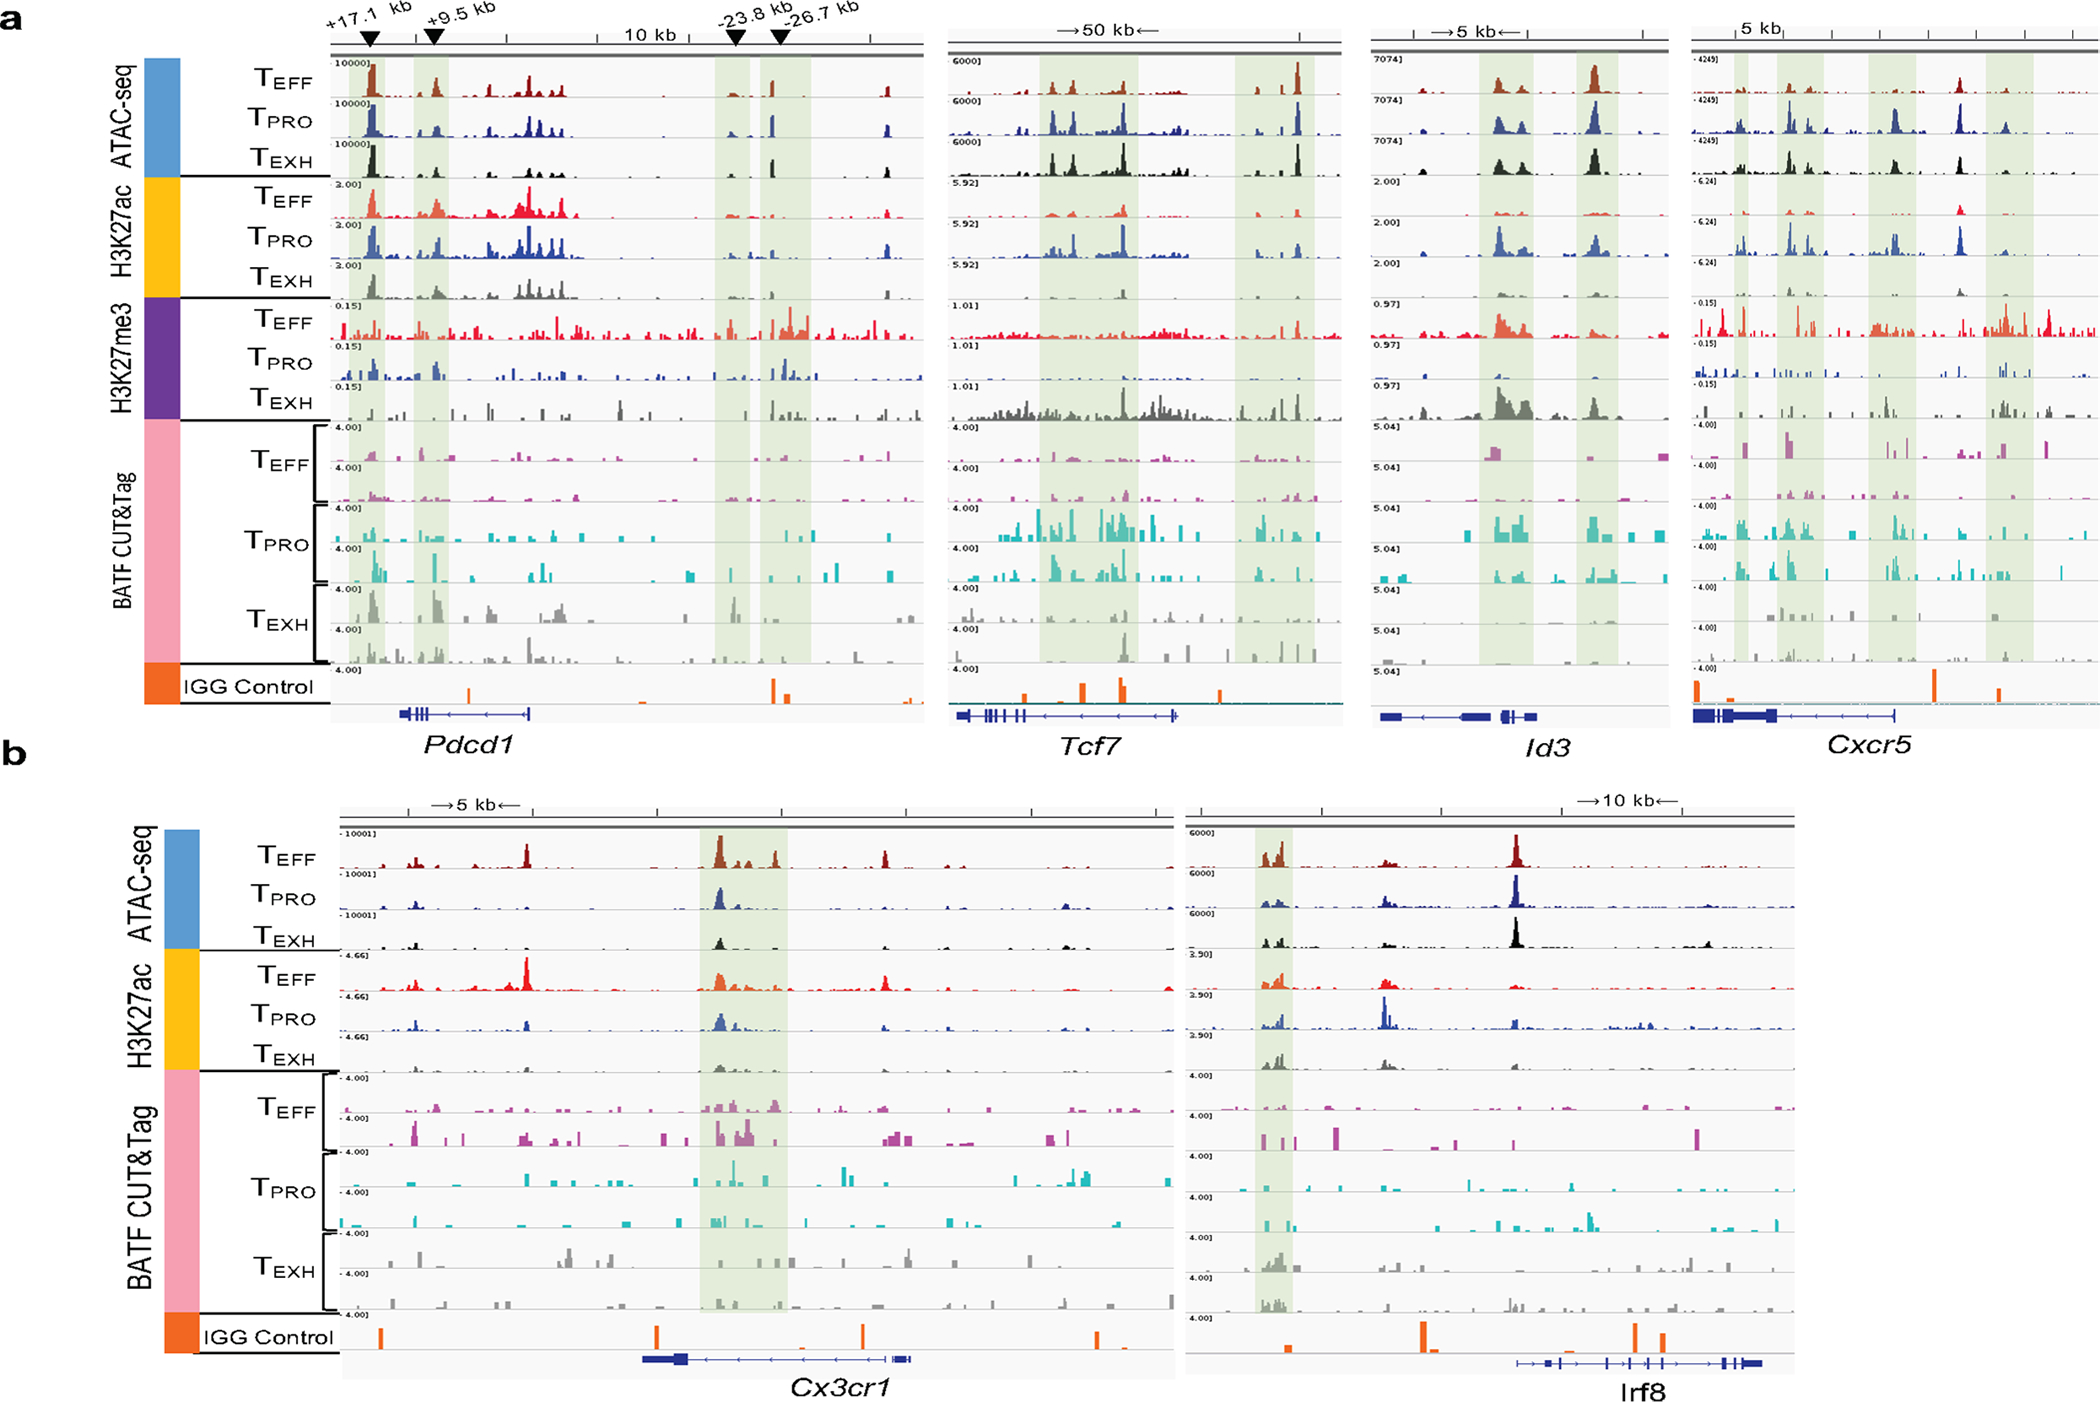
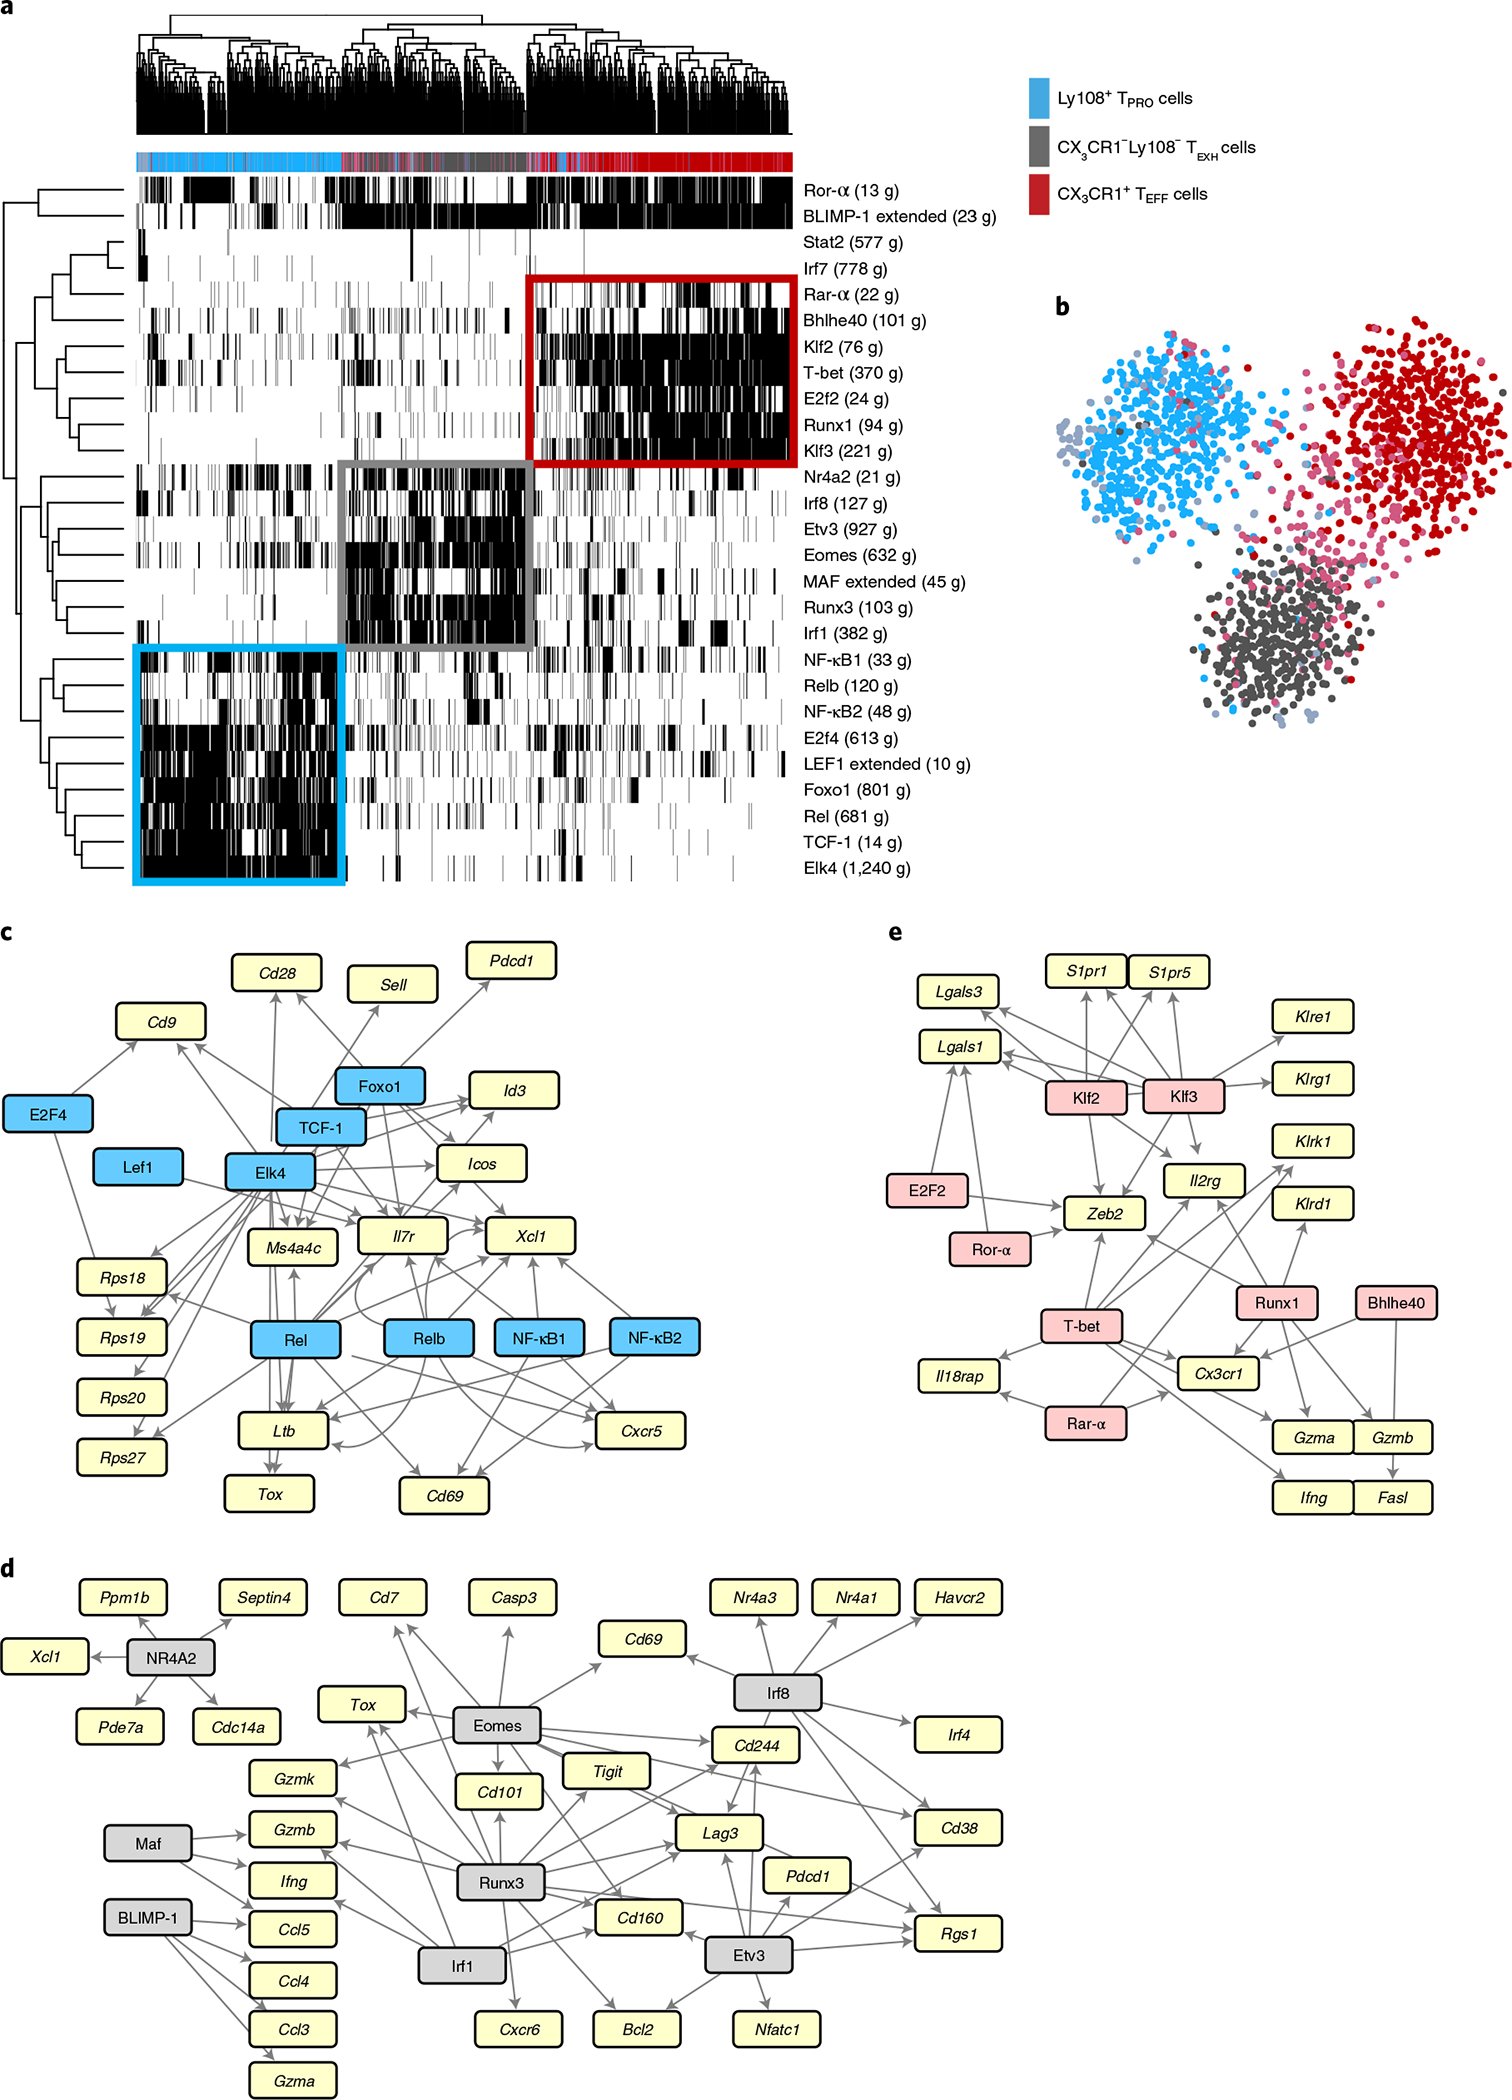
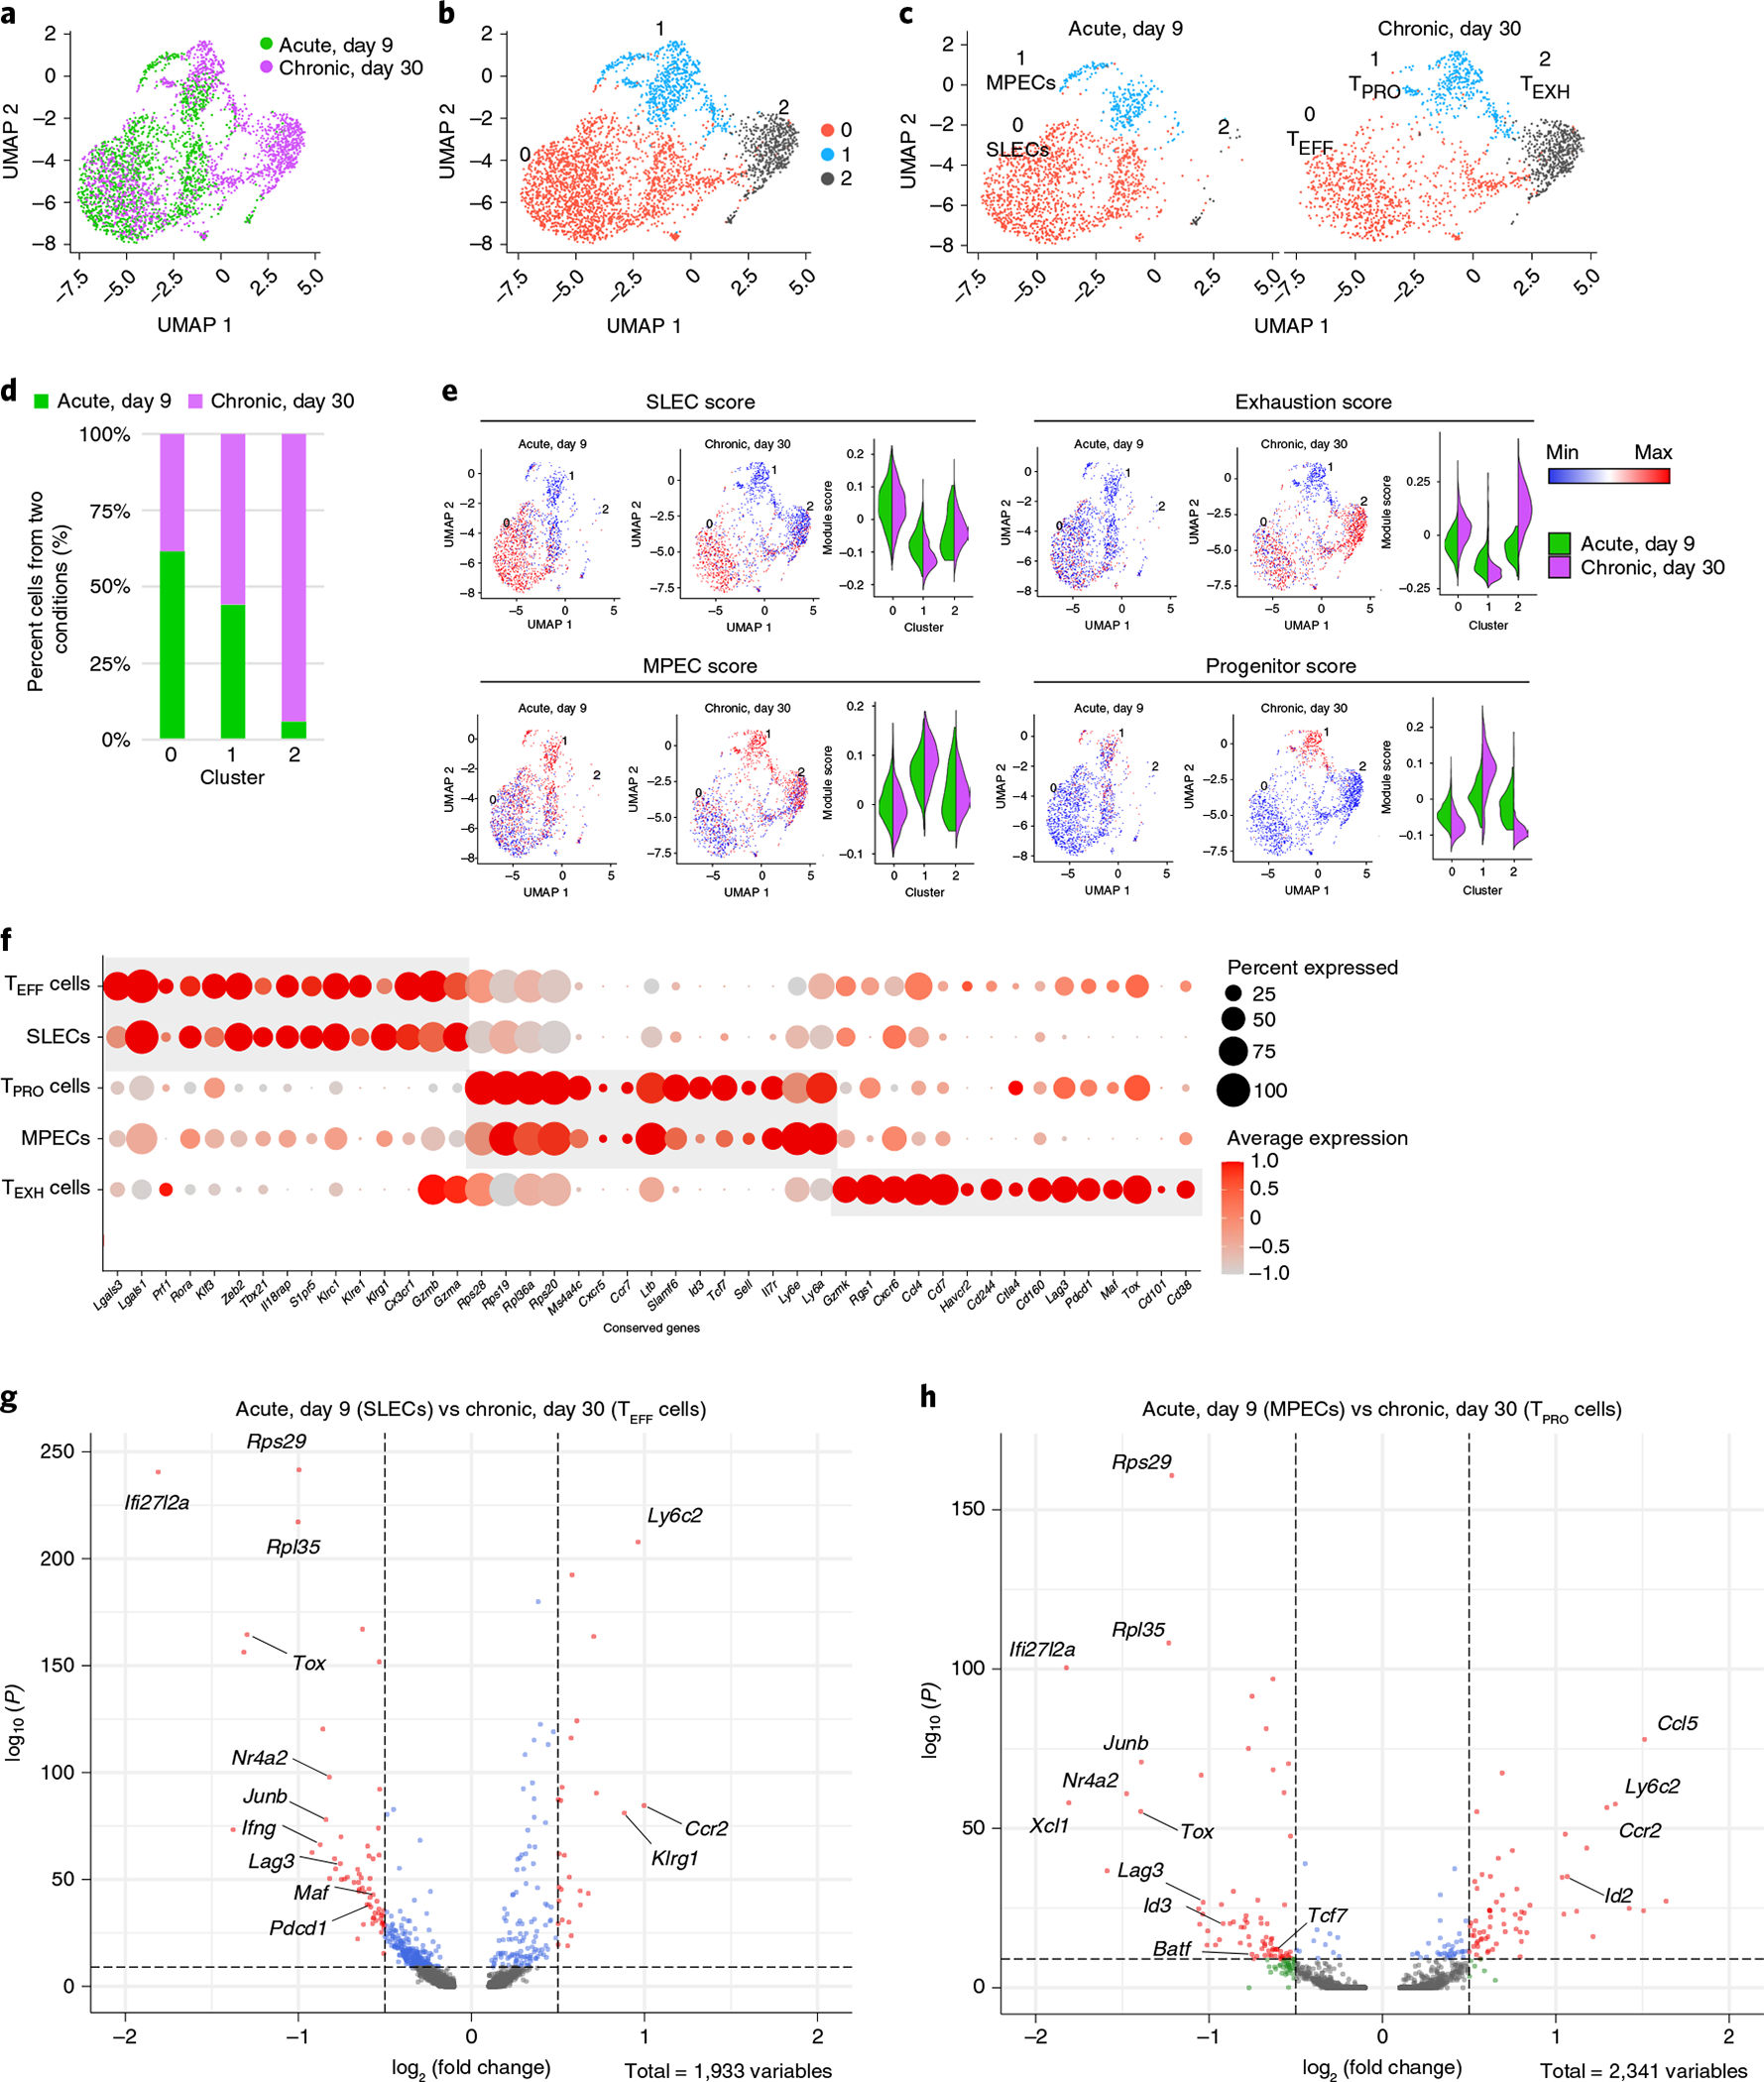
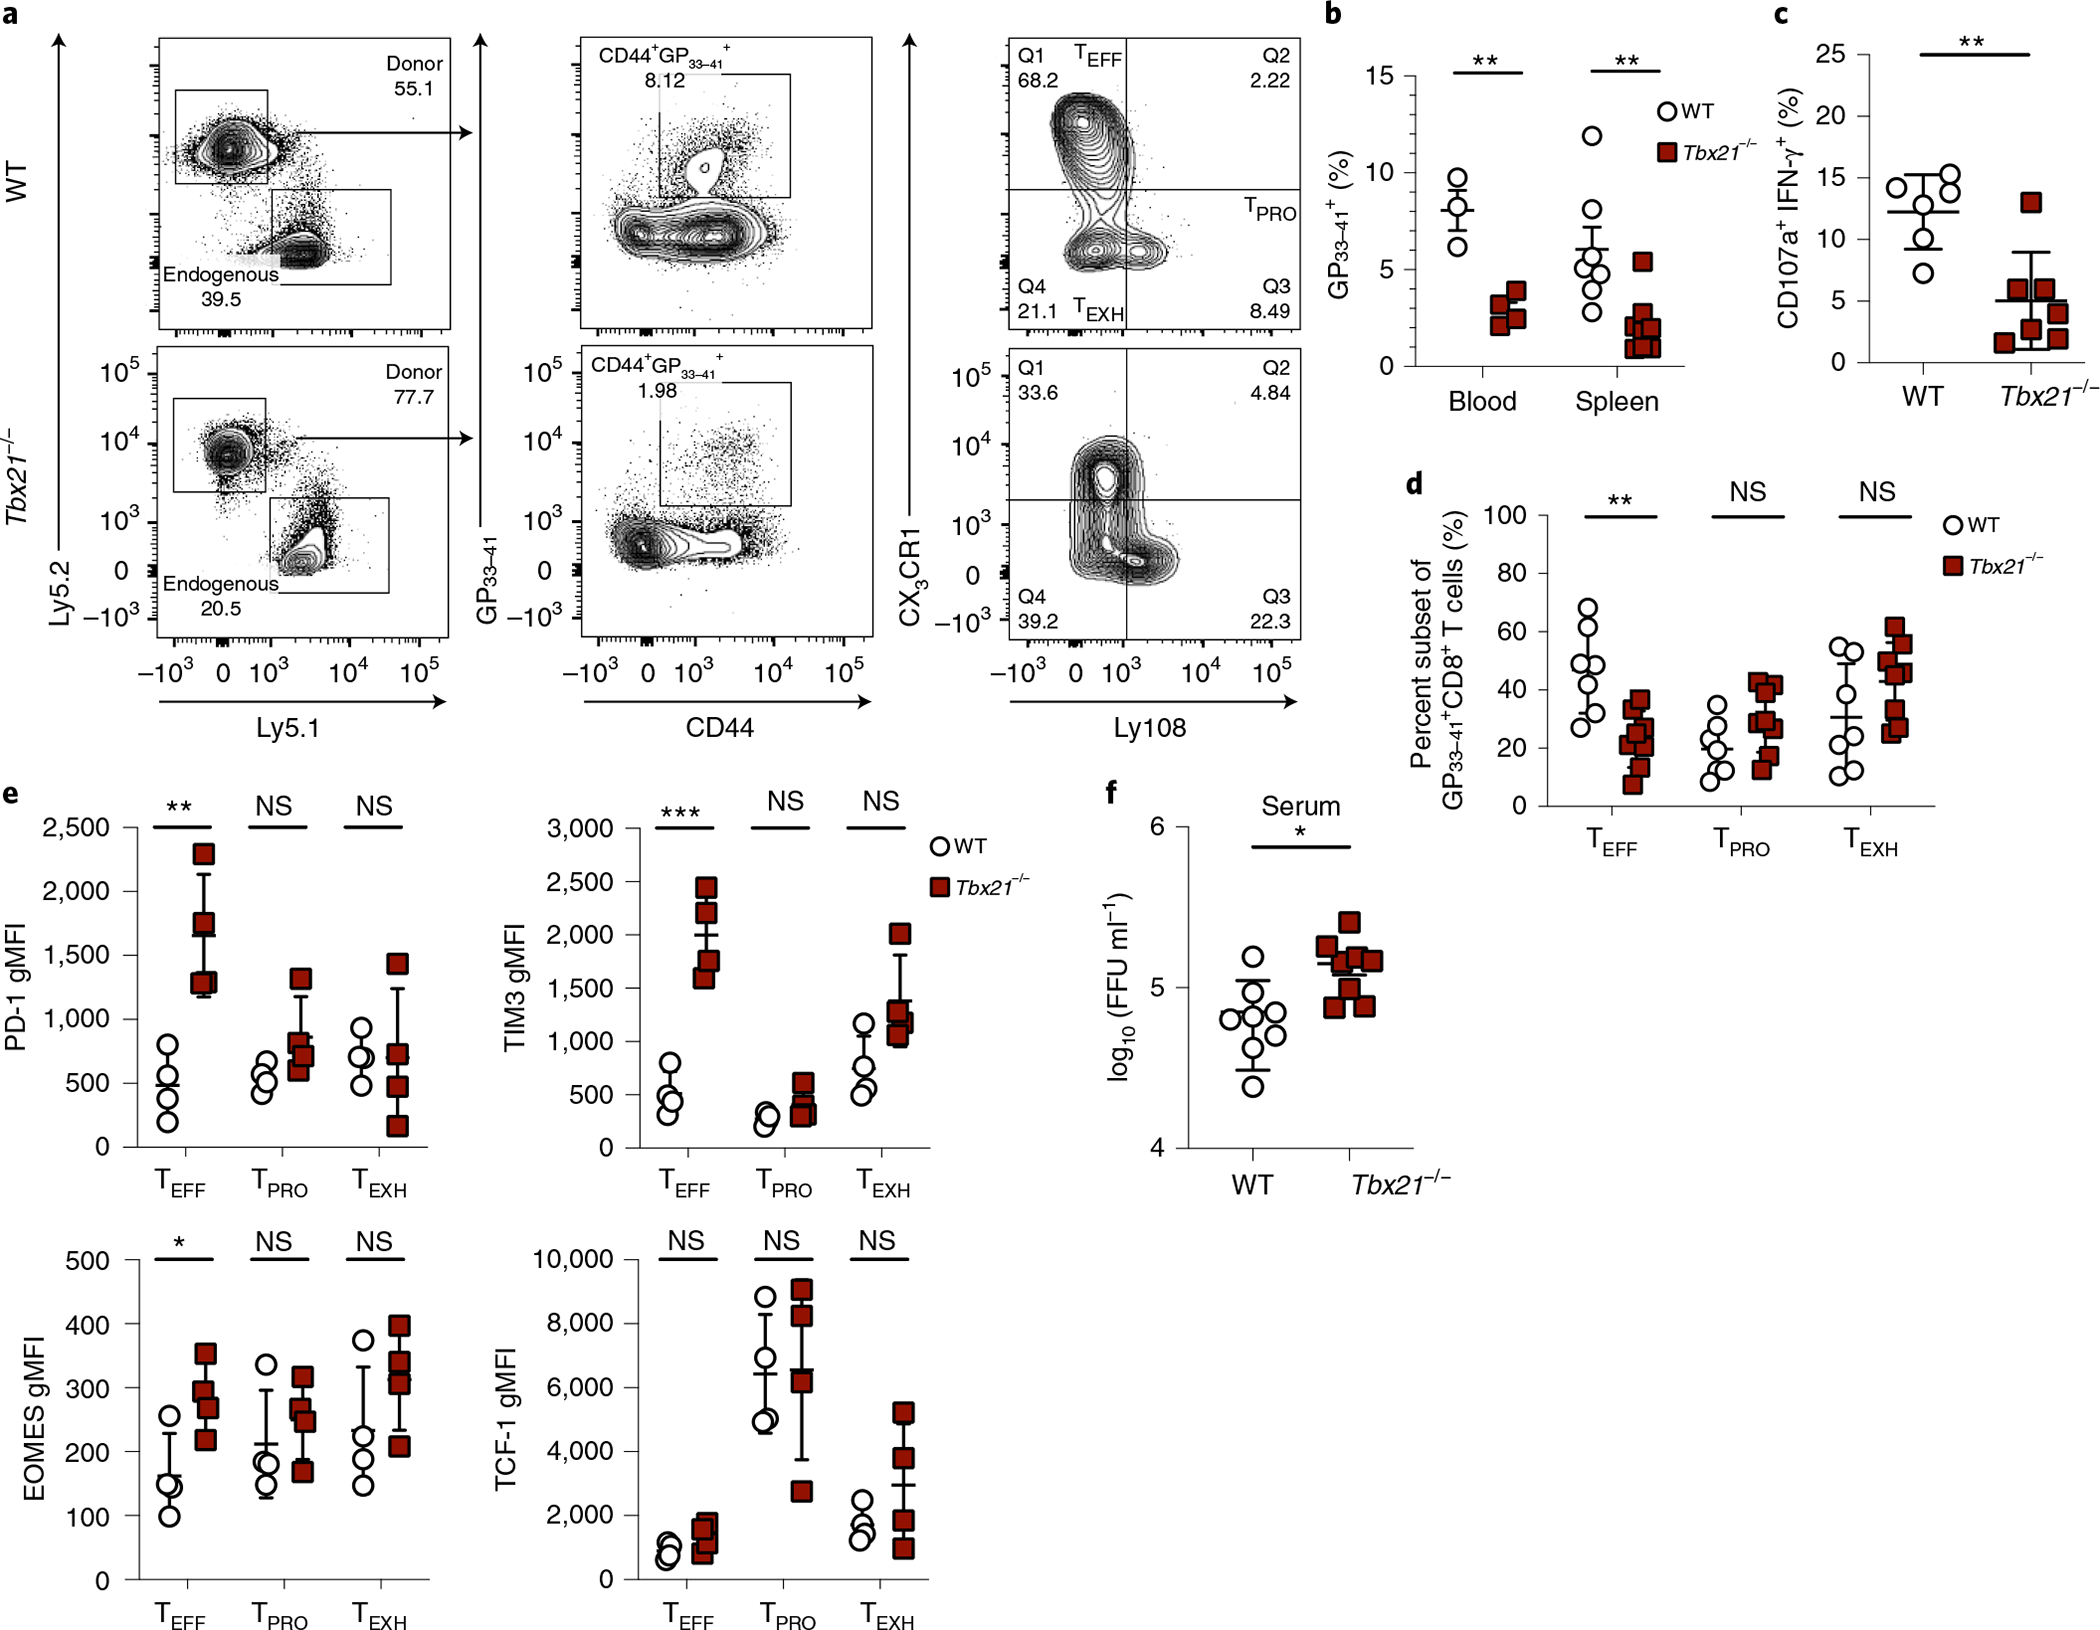
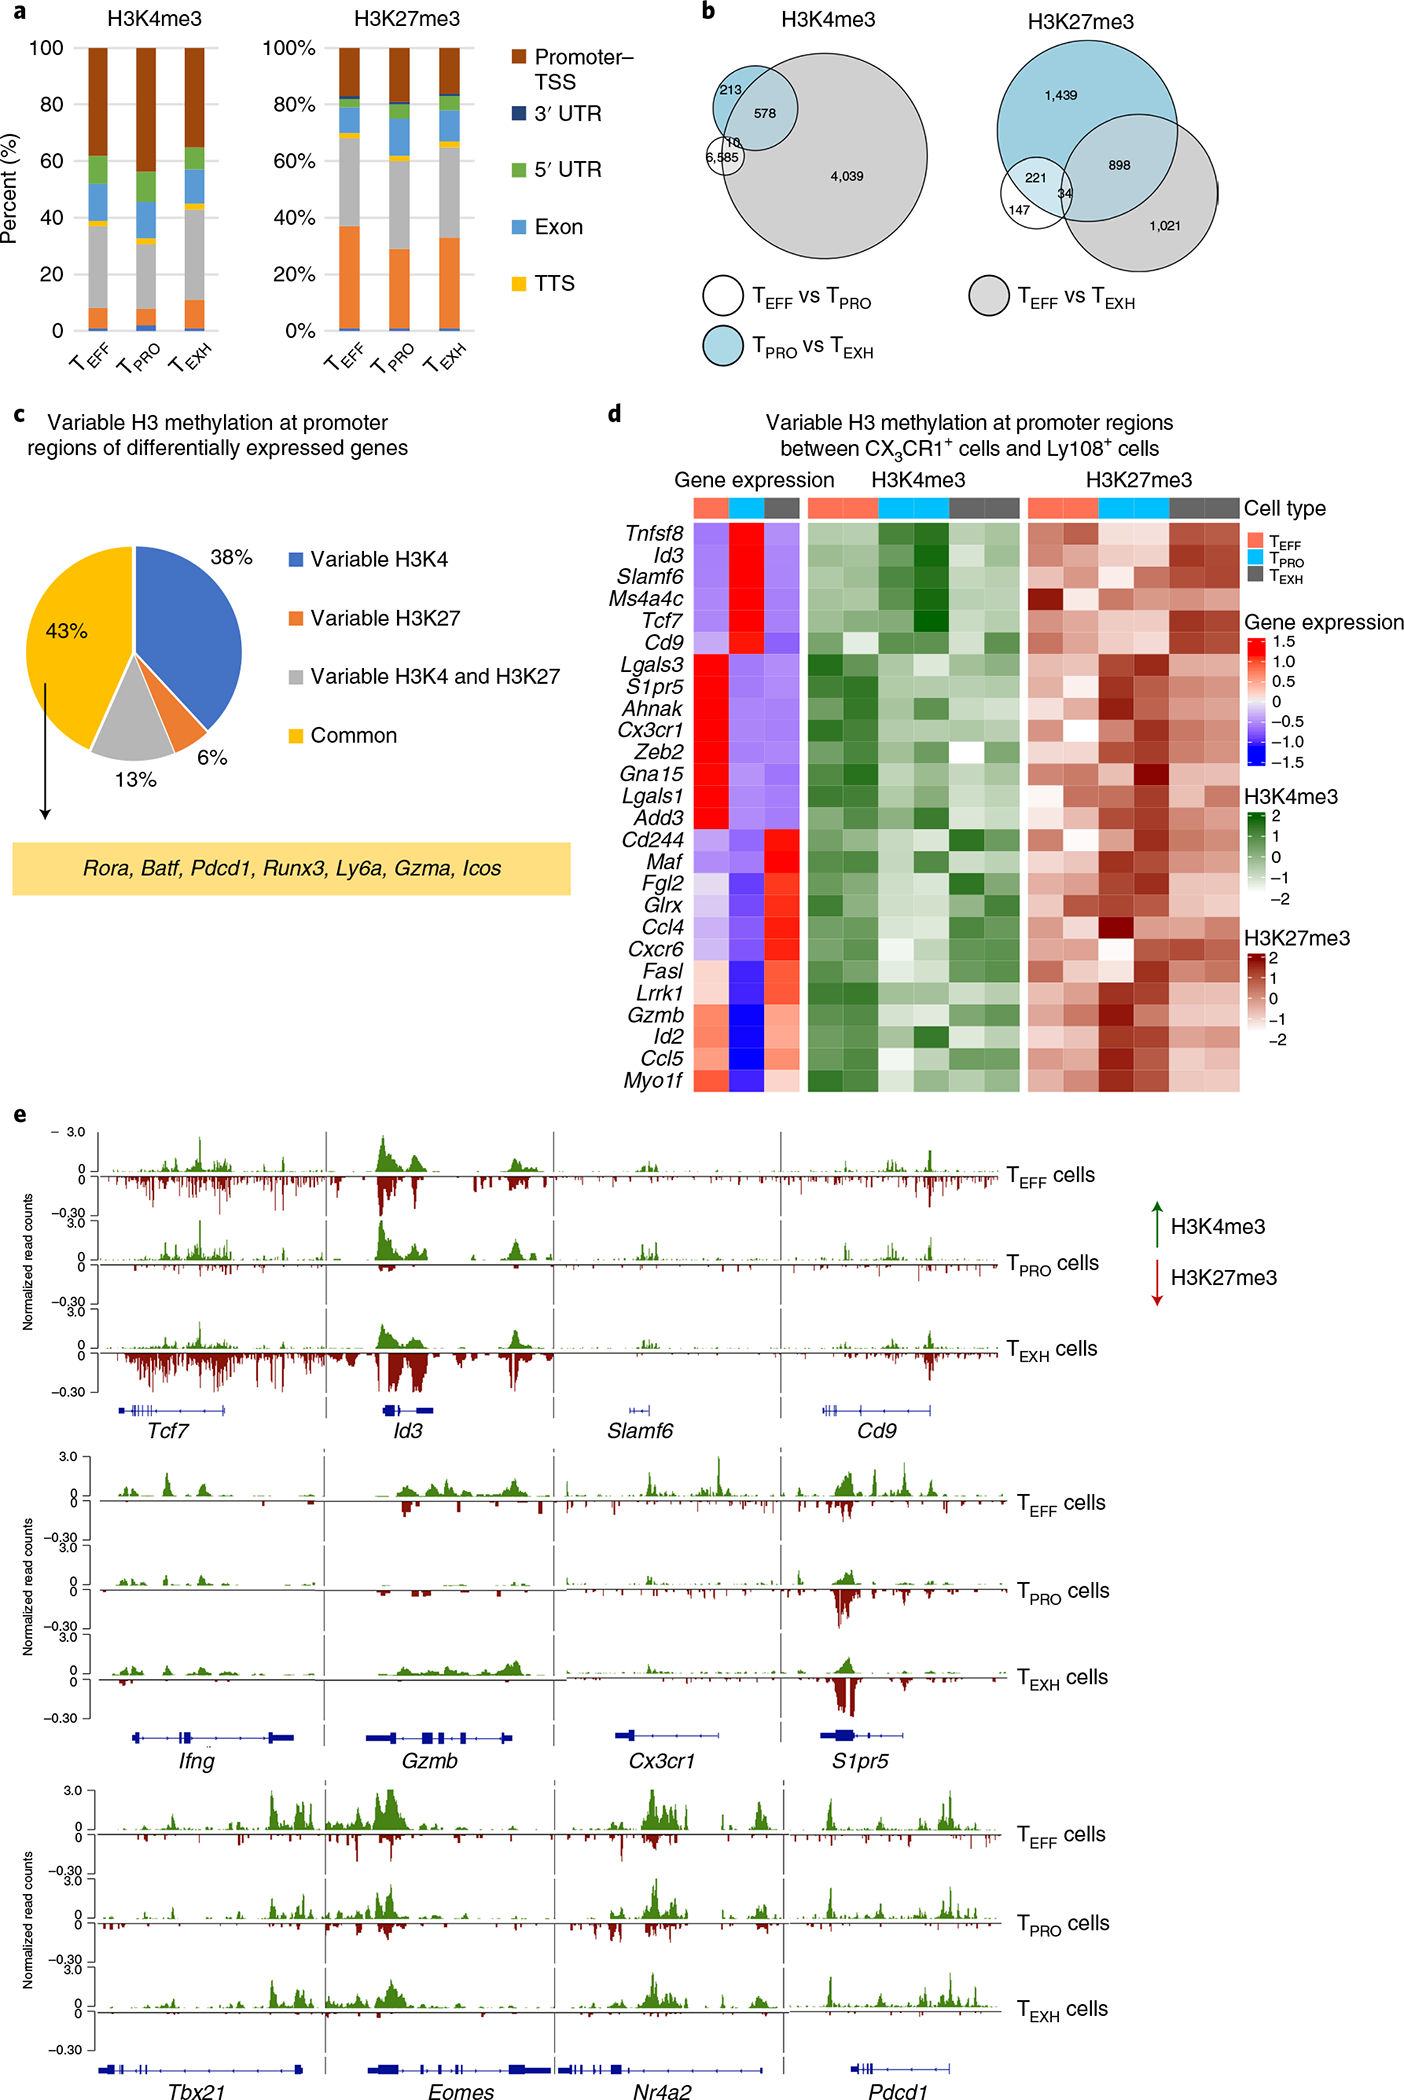
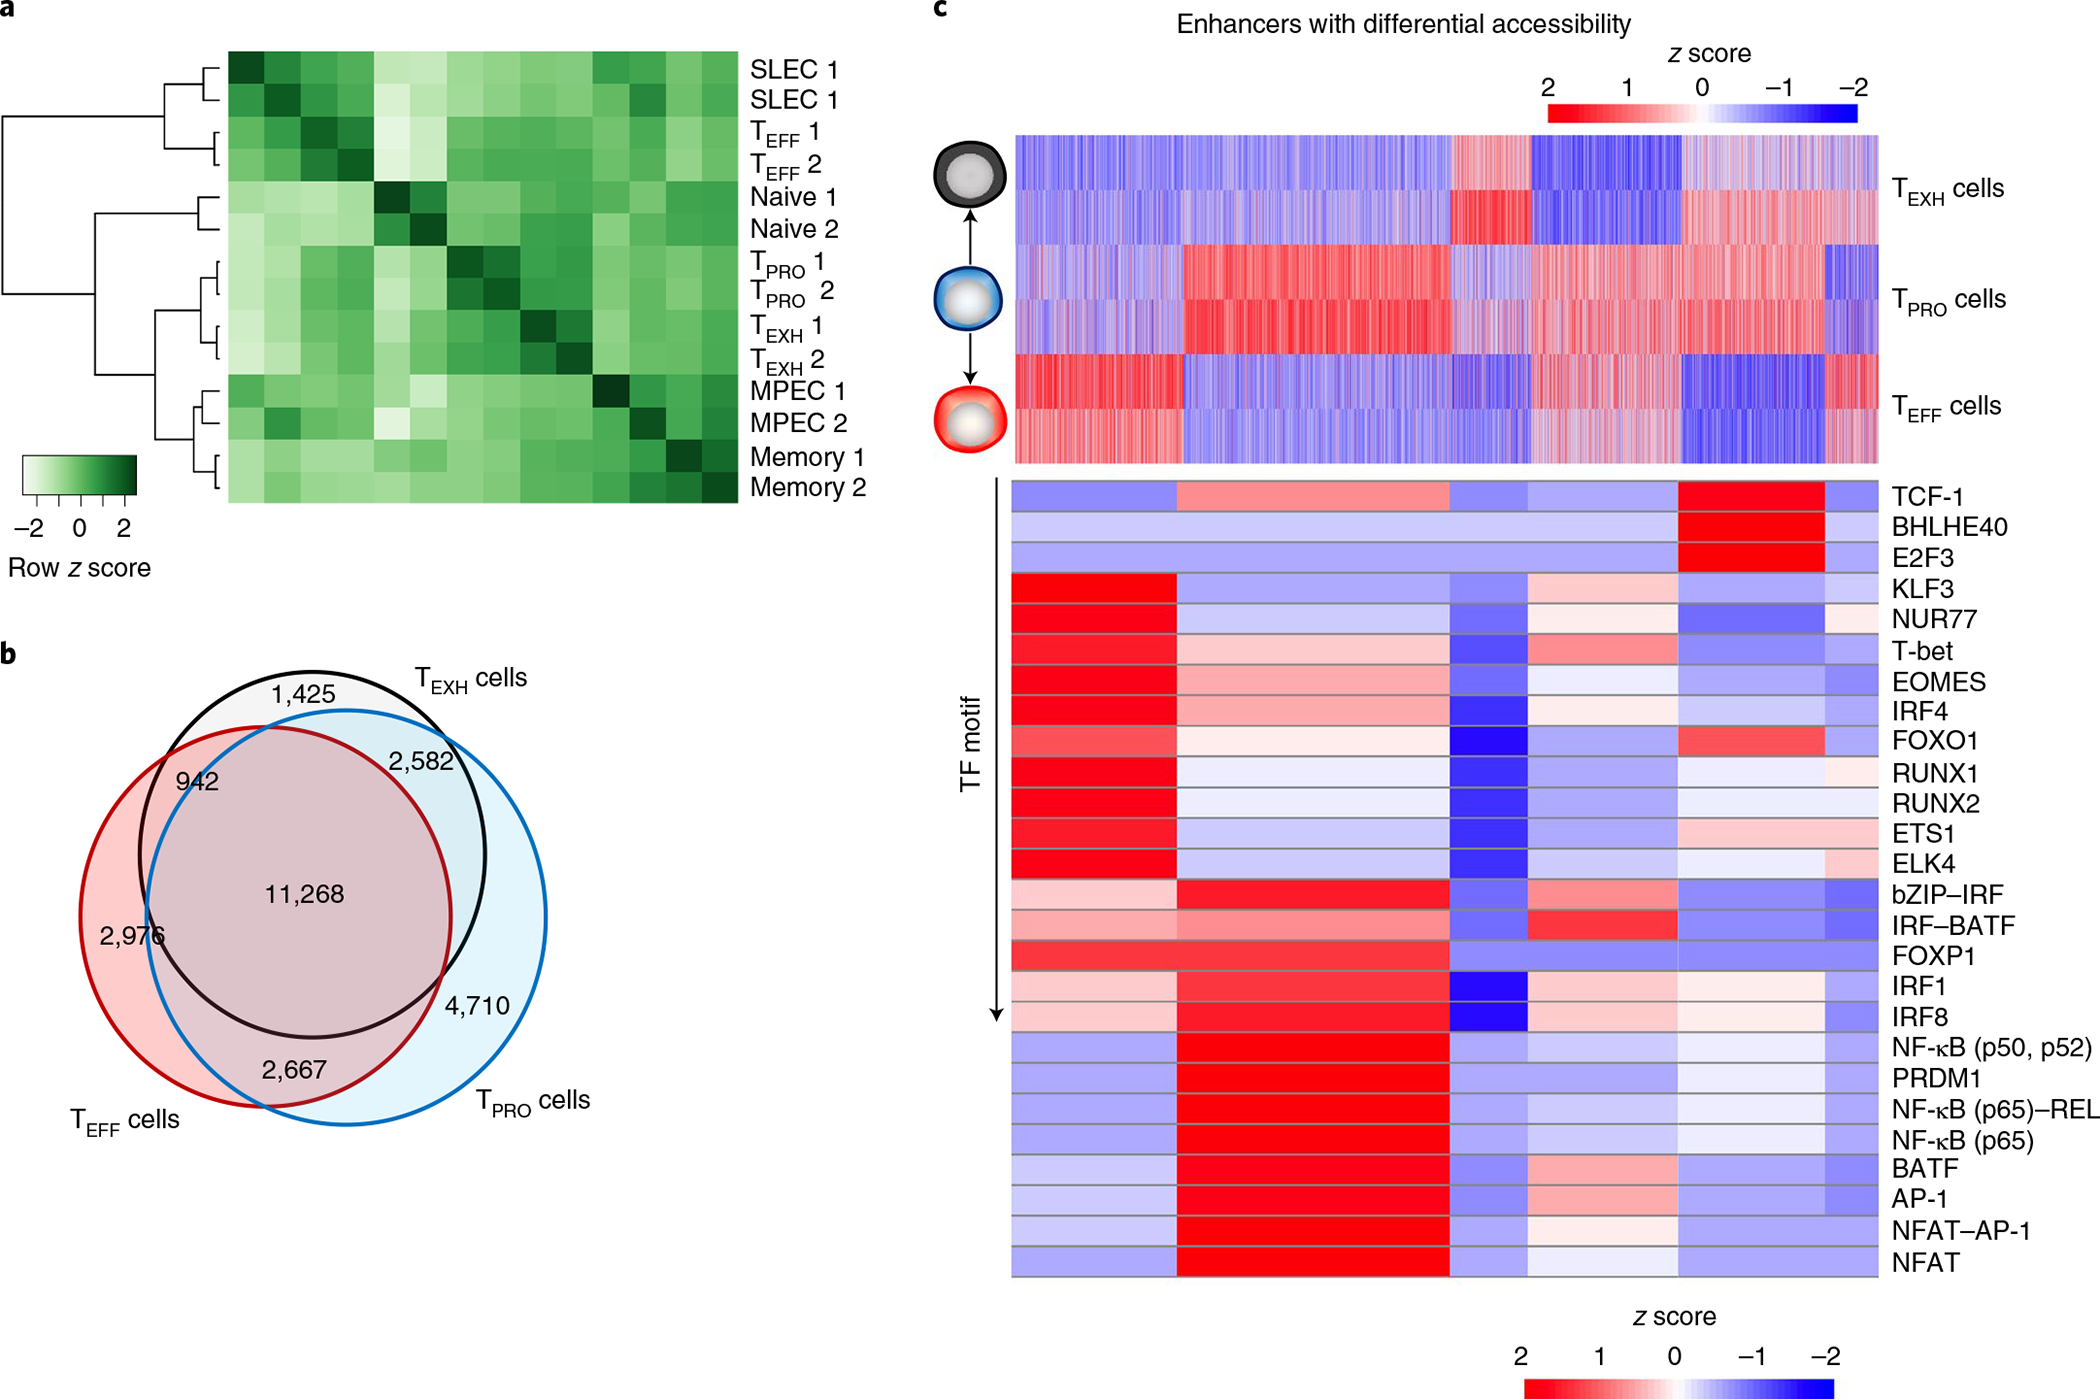
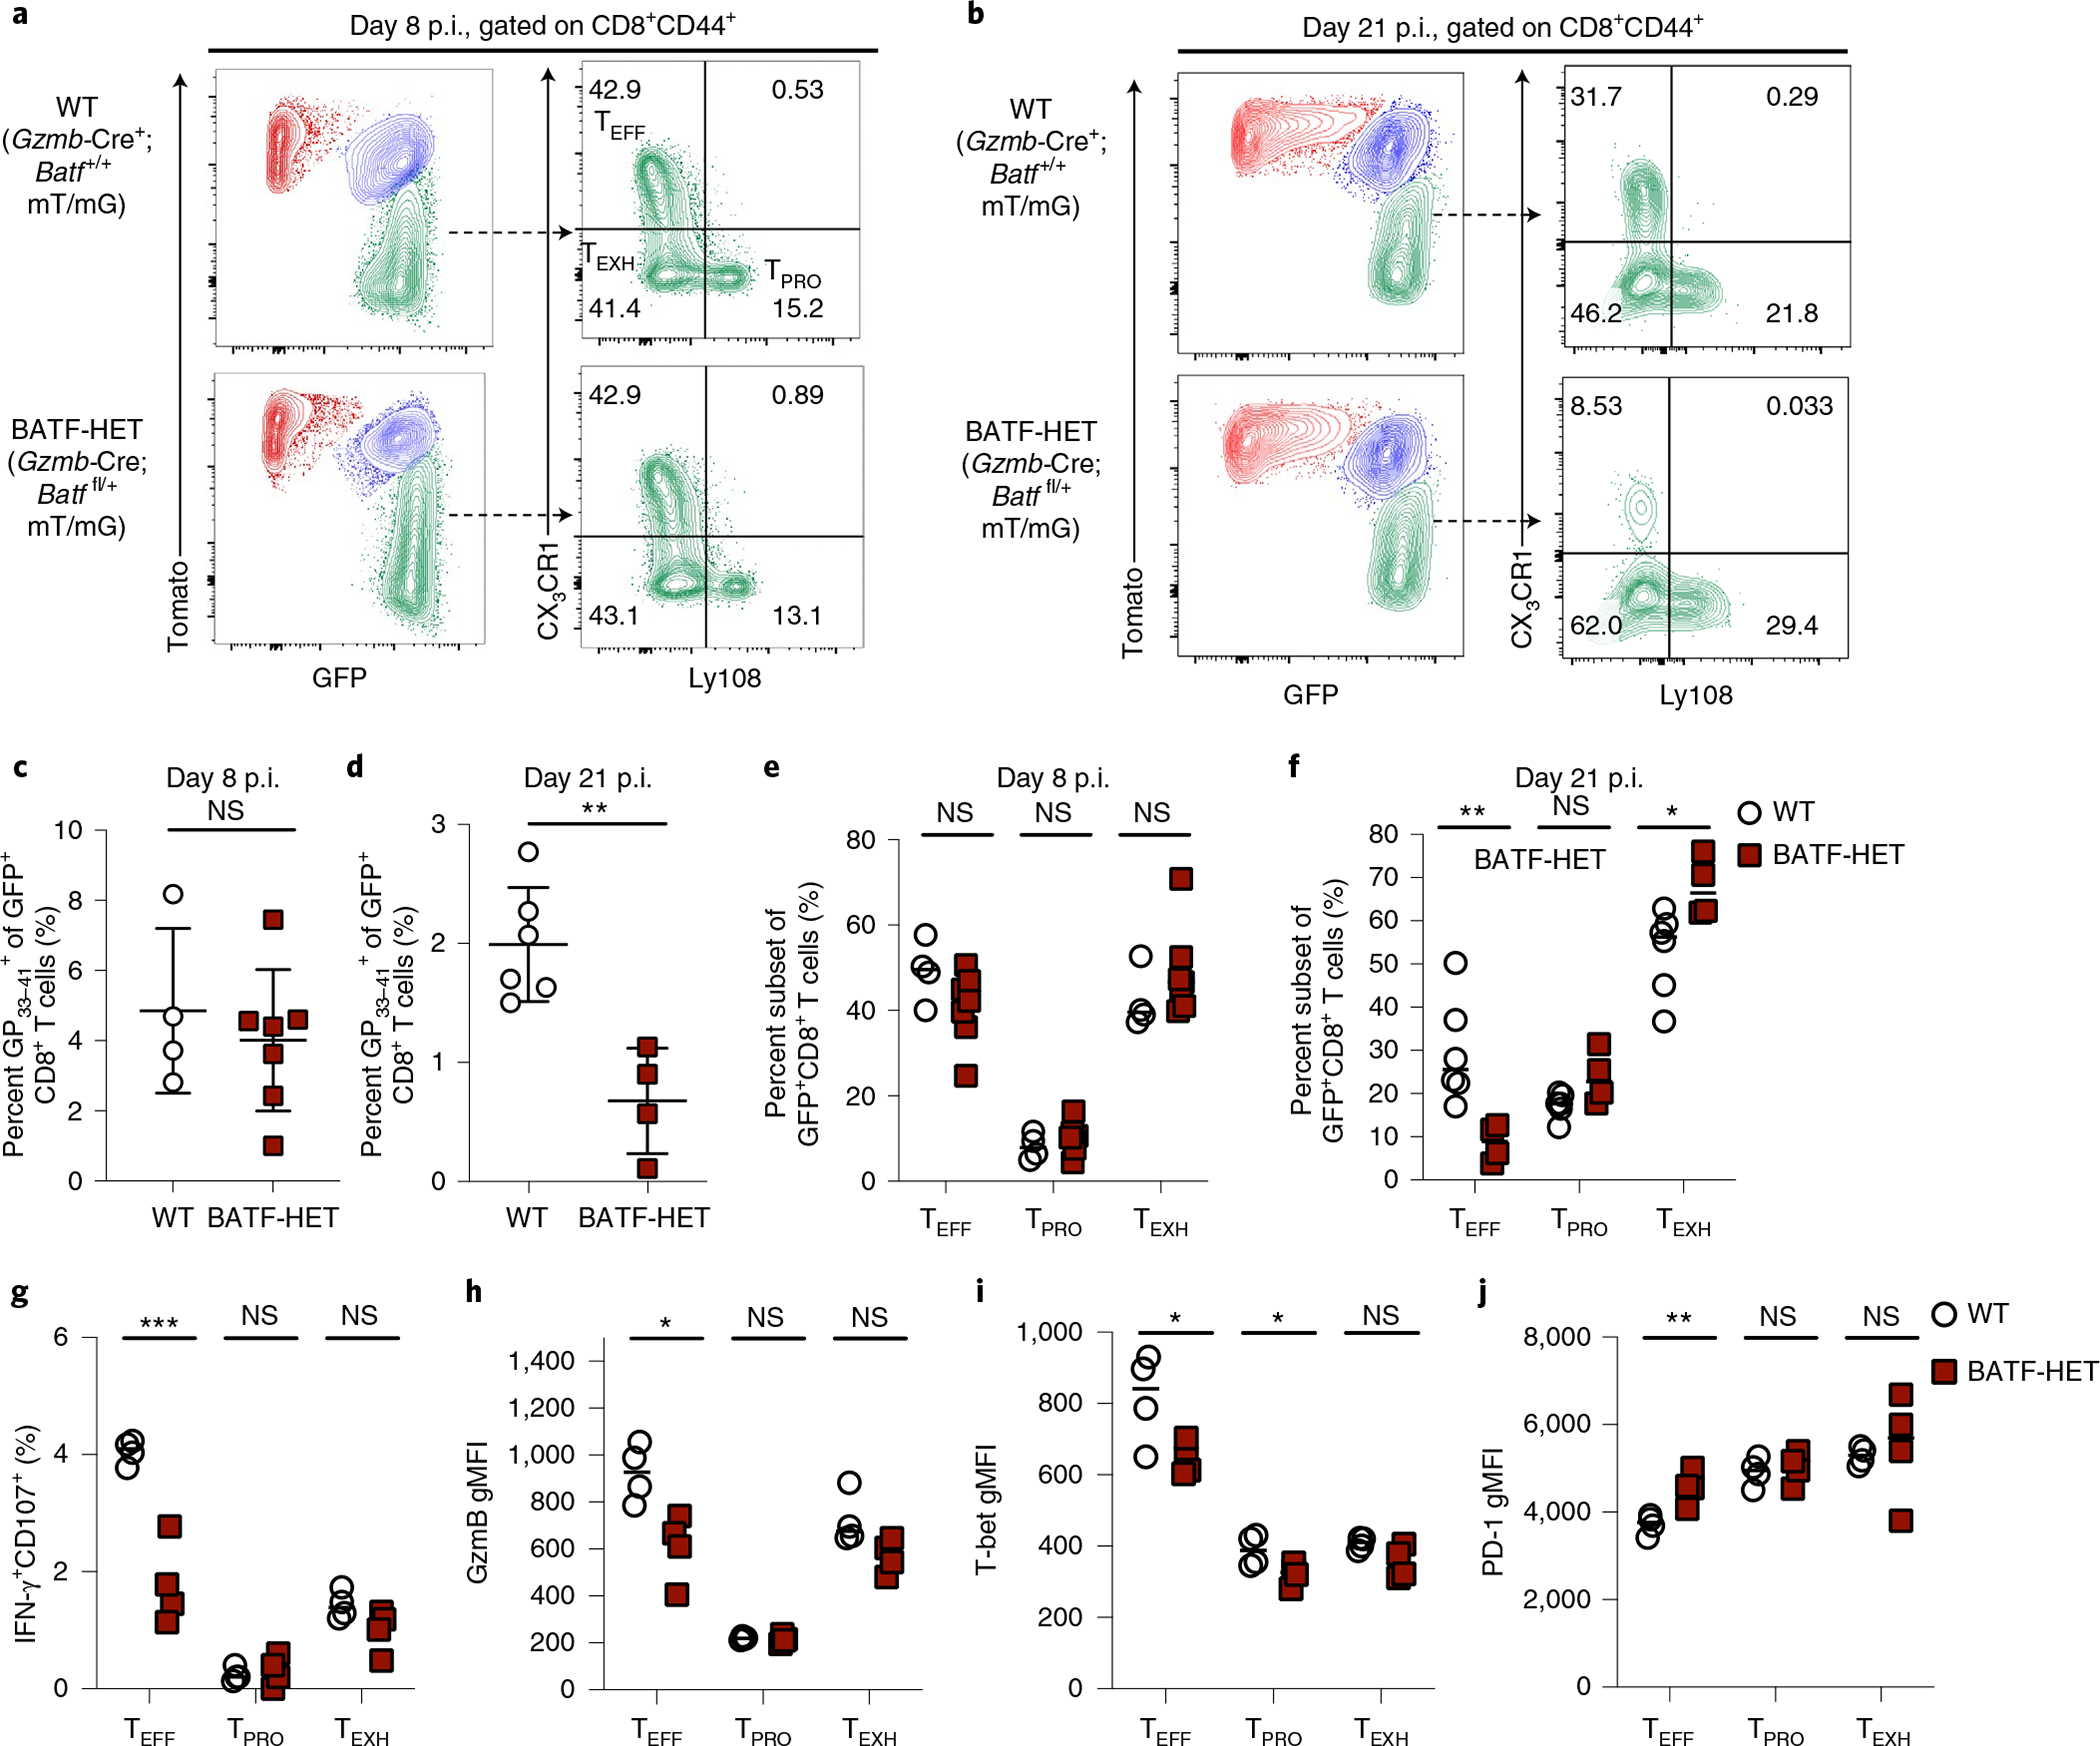
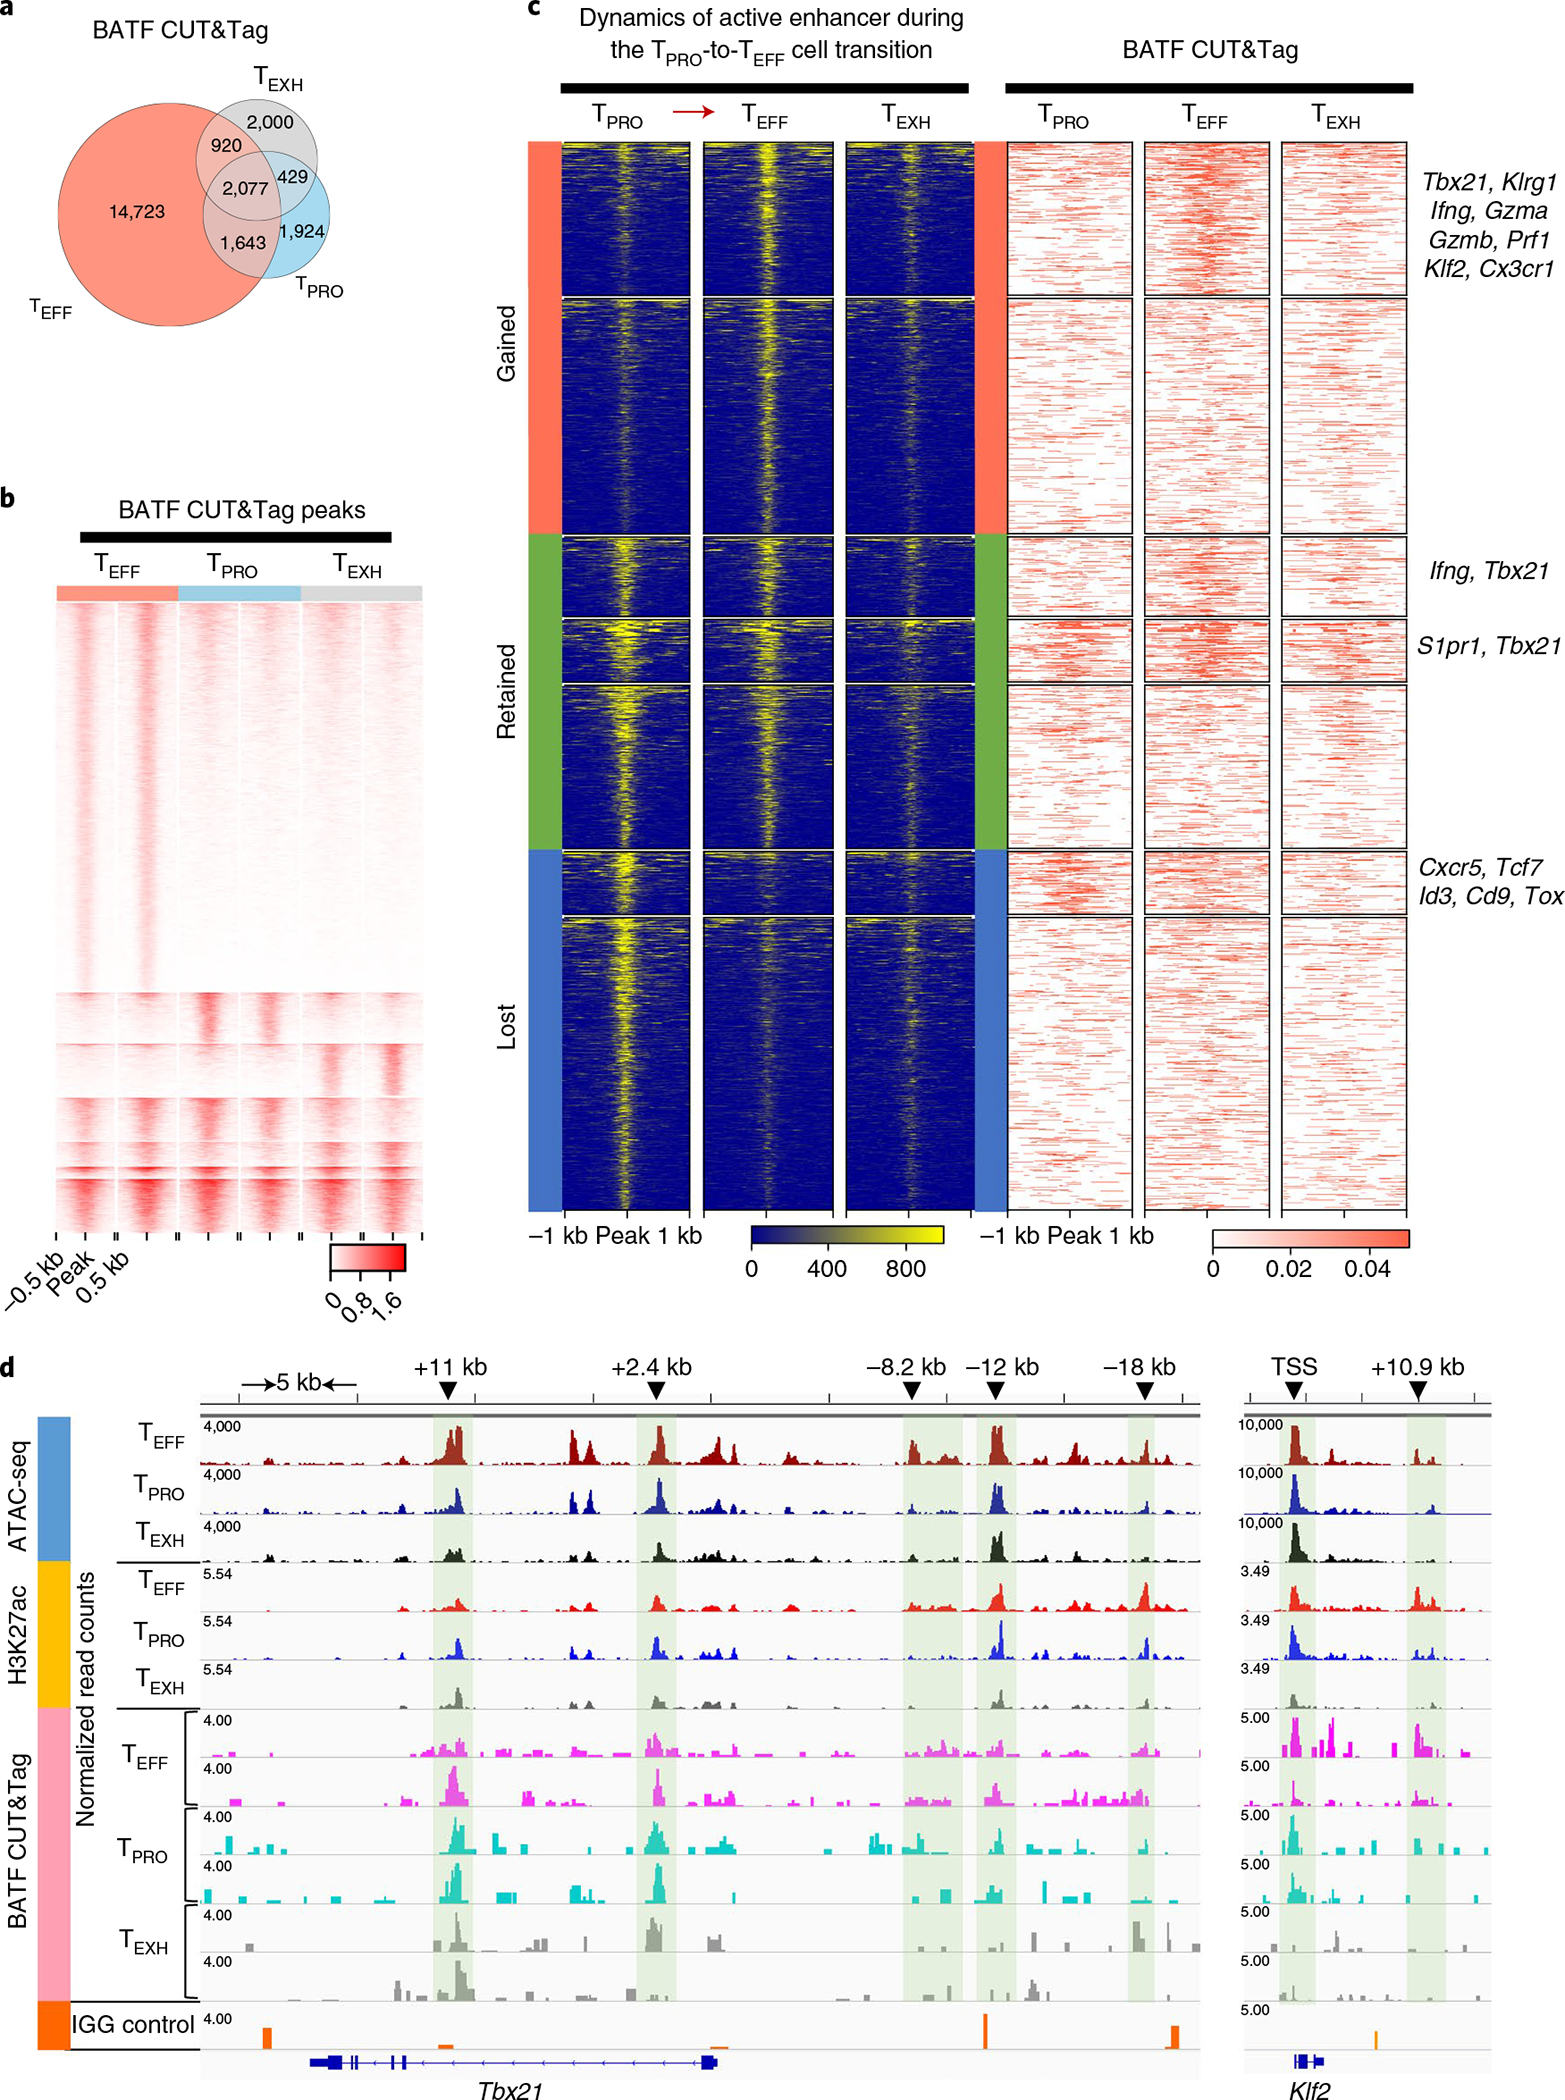
During chronic viral infection, CD8+ T cells develop into three major phenotypically and functionally distinct subsets: Ly108+TCF-1+ progenitors, Ly108-CX3CR1- terminally exhausted cells and the recently identified CX3CR1+ cytotoxic effector cells. Nevertheless, how CX3CR1+ effector cell differentiation is transcriptionally and epigenetically regulated remains elusive. Here, we identify distinct gene regulatory networks and epigenetic landscapes underpinning the formation of these subsets. Notably, our data demonstrate that CX3CR1+ effector cells bear a striking similarity to short-lived effector cells during acute infection. Genetic deletion of Tbx21 significantly diminished formation of the CX3CR1+ subset. Importantly, we further identify a previously unappreciated role for the transcription factor BATF in maintaining a permissive chromatin structure that allows the transition from TCF-1+ progenitors to CX3CR1+ effector cells. BATF directly bound to regulatory regions near Tbx21 and Klf2, modulating their enhancer accessibility to facilitate the transition. These mechanistic insights can potentially be harnessed to overcome T cell exhaustion during chronic infection and cancer.


Conflict of interest statement

Competing interests

The authors declare no competing interests.

Figures

Extended Data Fig. 1 |
Extended Data Fig. 1 |. SCENIC analysis revealed distinct transcriptional regulatory circuits for CD8+ T cell subsets during chronic viral infection.
a, Dot plot showing expression of signature genes for the TPRO cells, TEFF cells, and TEXH cells. b,c,d, t-SNE projections showing binary regulon activity of cell-specific regulons for the TPRO, TEXH and TEFF subsets.
Extended Data Fig. 2 |
Extended Data Fig. 2 |. Unsupervised clustering analysis identified three major cell populations in the integrated dataset.
a, Heatmap showing the top 15 differentially expressed genes for each cluster as defined in Fig. 2b. Columns and rows correspond to cells and genes, respectively. Cells from the same cluster are grouped together. The color scale representing Z-Score that is generated from log2 read counts. b,c,d,e,h, Showing the comparison of CD8 T cells from day 9 post-acute infection and day 30 post-chronic infection. Cells are gated on CD8+CD44+ GP33–41+ cells. b, left. Summary data showing the expression of surface makers for SLECs and TEFF cells. b, right. Summary data showing the expression of surface makers for MPECs and TPRO cells. c, Summary data showing the expression of GzmB, proportion of CD8+ T cell degranulating (CD107a+) and producing IFN-γ, and proportion of CD8+ T cell producing TNF and IFN-γ upon ex vivo stimulation with GP33–41 peptide. d,h, Summary data showing the expression of transcription factors and inhibitory receptors. e, Summary data showing the relative cytotoxicity of SLECs and TEFF cells against peptide-pulsed target cells. f, Heatmap showing binary regulon activities of CD8 T cells from day 9 post-acute infection and day 30 post-chronic infection. g, t-SNE projection depicting clustering of cells by regulon activity. b, 10 mice for acute infection and 10 mice for chronic infection. c,d,h, 5 mice for acute infection and 5 mice for chronic infection. e, 10 mice for acute infection and 7 mice for chronic infection. b-h, Data pooled from 2 independent experiments. Data are expressed as mean ± s.e.m. ns = not significant, * p < 0.05, ** p < 0.01, *** p < 0.001. b, Unpaired t-test with two-stage step-up method of Benjamini, Krieger, and Yekutieli. c,d,e,h, Ordinary one-way ANOVA.
Extended Data Fig. 3 |
Extended Data Fig. 3 |. Distinct H3K4me3 and H3K27me3 patterns associated with gene expression profiles of the three CD8+ T cell subsets.
a, Sorting strategy and sort purity of GP33–41 tetramer+ or GP276–286 tetramer+ virus-specific CD8+ T cell subsets that were sorted from C57BL/6 mice at 3–5 weeks post LCMV Cl13 infection. b,c, Heatmap showing gene promoter regions that exhibited differential H3K4me3 enrichment between TEFF cells and TEXH cells. Scale bar representing Z-Score that is generated from log2 RPKM. Bar plot showing the top pathways correlated with these genes by gene ontology (GO) analysis. d, Genome track view of representative gene loci showing H3K4me3 (green, above line) or H3K27me3 (red, below line) peaks. CUT & Tag-seq data are from two independent replicates. Each replicate was pooled together from 2–3 mice.
Extended Data Fig. 4 |
Extended Data Fig. 4 |. Distinct enhancer repertoires regulate transcriptional programs of the three CD8+ T cell subsets.
Venn diagram showing overlap of all chromatin-accessible regions (ChARs) detected by ATAC-seq. b, Bar plot showing the distance of ChARs to TSS. Left are ChARs with differential accessibility among the three CD8+ T cells subsets. Right are ChARs shared by the three subsets. c, Heatmap showing MSigDB pathway enrichment signatures in six enhancer peak sets as shown in Fig. 5c (Top). d, MA plot showing M value vs A value of the merged set of TEFF cell and TEXH cell enhancer peaks after normalization. Top 5,000 peaks are highlighted for TEFF cells (cyan) and TEXH cells (red). Dot plot showing the top 10 TFs whose motifs were significantly enriched in TEFF cell-specific enhancers compared to TEXH cell-specific enhancers.
Extended Data Fig. 5 |
Extended Data Fig. 5 |. Active and suppressive states of enhancer regions regulate gene expression in the three CD8 T cell subsets.
a, Genome track view of the gene loci showing ATAC-seq, H3K27ac, and H3K27me3 peaks in TPRO, TEXH and TEFF subsets, TFs with predictive binding sites at the enhancers (green shadow) were listed.
Extended Data Fig. 6 |
Extended Data Fig. 6 |. BATF is required for TPRO progenitor cell differentiation into TEFF cells.
a, Summary data showing viral titers in the serum of experimental mice on day 8 p.i. and day 30 p.i. b, c, Summary data showing the relative expression of KLRG1 and TCF-1 in three virus-specific CD8+ T cell subsets. d, Experimental design. e, g, Representative flow plots and summary data showing the proportion of three antigen-specific CD8+ T cell subsets in WT and BATF deficient cells on day 28 p.i. with LCMV Cl13. f, Summary data showing the expression of BATF in WT and BATF deficient cells. a, Day 8 data was collected from 4 WT and 6 BATF-HET mice. Day 21 data was collected from 4 WT and 5 BATF-HET mice. b,c, Data was collected from 4 WT and 4 BATF-HET mice. f,g, Data was collected from 8 Batf flox/flox CreERT2 mT/mG mice. c-j, Data pooled from 2 independent experiments. Data are expressed as mean ± s.e.m. ns = not significant, * p < 0.05, ** p < 0.01, *** p < 0.001. a, Two-tailed unpaired t-test. b,c, Unpaired t-test with Holm-Šídák method. f, Two-tailed paired t-test. g, Paired t-test with two-stage step-up method of Benjamini, Krieger, and Yekutieli.
Extended Data Fig. 7 |
Extended Data Fig. 7 |. BATF regulates chromatin accessibility of CD8+ T cells during chronic infection.
GzmbCre+;Batf+/+;RosamT/mG (WT), Gzmb-Cre+;Batffl/+;RosamT/mG (BATF-HET), and Gzmb-Cre+;Batffl/fl;RosamT/mG mice (BATF-KO) were used for this experiment. At 4 weeks post-LCMV Cl13 infection, CD8+CD44+GFP+ cells, which represent polyclonal LCMV-specific CD8+ T cells, were FACS sorted to perform ATAC-seq experiments. a, Venn diagram showing overlapping and unique enhancer regions in WT, BATF-HET, and BATF-KO CD8+ T cells b, Heatmap showing enhancer regions with differential accessibility. Scale bar representing Z-Score that is generated from log2 FPKM. Each replicate was an individual mouse.
Extended Data Fig. 8 |
Extended Data Fig. 8 |. Genome track view of Pdcd1, Tcf7, Id3, Cxcr5, Cx3cr1, and Irf8.
a,b, Genome track view of the gene loci showing ATAC-seq, H3K27ac, and BATF CUT&Tag peaks in TPRO, TEXH and TEFF subsets.
Fig. 1 |
Fig. 1 |. SCENIC analysis revealed distinct transcriptional regulatory circuits for CD8+ T cell subsets during chronic viral infection.
Previously published scRNA-seq data from GP33–41+CD8+ T cells from day 30 p.i. with LCMV Cl13 (GSE129139) were analyzed using SCENIC. a, Heatmap showing binary regulon activities (black, active; white, inactive) of the 27 regulons found in at least 1% of cells that correlated (absolute Pearson correlation >0.30) with that of at least one other regulon. Columns correspond to cells; rows correspond to regulons, with the number of downstream target genes (g) coexpressed with each TF in parentheses. Cells were clustered by regulon activity. The color bar above the heatmap denotes major CD8+ subsets identified by gene expression profiles as previously described. b, t-distributed stochastic neighbor embedding projection depicting clustering of cells by regulon activity. ce, GRNs for Ly108+ TPRO cells, CX3CR1Ly108 TEXH cells and CX3CR1+ TEFF cells. Key TFs for each CD8+ T cell subset are highlighted in blue, pink and gray, respectively. Signature genes for each subset that were identified in our previously published paper are highlighted in yellow. TF–target interactions were visualized by Cytoscape.
Fig. 2 |
Fig. 2 |. Integrated analysis of single-cell transcriptomes reveals analogous CD8+ subsets arising during acute and chronic viral infections.
a, UMAP plot showing antigen-specific CD8+ T cells from day 9 p.i. with LCMV Armstrong (GSE130130) and day 30 p.i. with LCMV Cl13 (GSE129139) after integrated analysis. b, Unsupervised clustering identified three major clusters in the combined dataset. c, UMAP plots showing cells from different infection conditions. d, The fraction of cells falling into each cluster from different infection conditions. e, Individual cells were scored for enrichment of gene signatures identified in previously published papers (GSE8678, GSE84105). Min, minimum; max, maximum. f, Dot plot of conserved genes across different infection conditions. g,h, Volcano plots showing genes differentially expressed between SLECs and TEFF cells (g) and MPECs and TPRO cells (h).
Fig. 3 |
Fig. 3 |. T-bet deficiency significantly diminishes TEFF subset formation and function.
a,b,d, Representative flow plots and summary data depicting the percentage of virus-specific CD8+ T cells as well as proportions of the three CD8+ subsets in WT and Tbx21−/− BMC mice on days 21–30 p.i with LCMV Cl13. Q, quartile. c, Summary data showing the proportion of CD8+ T cells degranulating (CD107a+) and producing IFN-γ upon ex vivo stimulation with the GP33–41 peptide. e, Summary data showing the relative expression of inhibitory molecules and TFs in the three virus-specific CD8+ T cell subsets. gMFI, geometric mean fluorescence intensity. f, Summary data showing viral titers in the sera of experimental mice on day 21 p.i. b, Blood was collected from three WT and four Tbx21−/− BMC mice. Spleens were collected from seven WT and eight Tbx21−/− BMC mice. c, Data were collected from six WT and seven Tbx21−/− BMC mice. d, Data were collected from seven WT and eight Tbx21−/− BMC mice. e, Data were collected from four WT and four Tbx21−/− BMC mice. f, Data were collected from eight WT and eight Tbx21−/− BMC mice. FFU, focus-forming units. bf, Data were pooled from two independent experiments. Data are expressed as mean ± s.e.m. NS, not significant; *P < 0.05, **P < 0.01, ***P < 0.001. b,d,e, Unpaired t-test with the Benjamini and Hochberg method or the Holm–Šídák method. c,f, Two-tailed unpaired t-test.
Fig. 4 |
Fig. 4 |. Distinct H3K4me3 and H3K27me3 patterns are associated with gene expression profiles of progenitor, effector and exhausted CD8+ T cell subsets.
a, Bar plot showing the percentage of H3K4me3 or H3K27me3 peaks at promoter regions (±2 kb from the TSS), gene body regions or intergenic regions. Peak annotation was performed by HOMER. UTR, untranslated region; TTS, transcription termination site. b, Venn diagrams illustrating intersection of gene promoters that exhibited differential H3K4me3 (left) or H3K27me3 (right) signal intensities from pairwise comparisons of TPRO cells, TEFF cells and TEXH cells. c,d, Differentially expressed genes among three CD8+ subsets were identified from scRNA-seq data (with P < 0.05 and log2 (fold change) > 0.5; Wilcoxon rank-sum test was used), and their expression levels were correlated to H3K4me3 and H3K27me3 modifications at promoter regions. c, Pie chart showing the proportion of differentially expressed genes that differentially exhibited one or both H3 methylation marks among TPRO cells, TEFF cells and TEXH cells (Wald test was used for differential binding analysis in DESeq2; the significance cutoff was adjusted P value ≤ 0.05). d, Heatmap showing H3K4me3 and H3K27me3 enrichment as well as expression profiles of genes that exhibited differences in H3K4me3 or H3K27me3 enrichment in their promoter regions between TPRO cells and TEFF cells. Scale bars represent z scores that were generated from log2 (read counts). e, Genome track view of representative gene loci showing H3K4me3 (green, above the line) or H3K27me3 (red, below the line) peaks. CUT&Tag-seq data are from two independent replicates. Each replicate was pooled together from two to three mice.
Fig. 5 |
Fig. 5 |. Distinct enhancer repertoires regulate transcriptional programs of three subsets of CD8+ T cells.
a, Heatmap showing correlation analysis of enhancer profiles (ATAC-seq peaks that are >2 kb from the TSS). Shown are the three CD8 subsets from the chronic LCMV infection as well as naive CD8+ T cells, MPECs, SLECs and memory cells from the LCMV Armstrong infection (GSE150442). The scale bar represents z scores that were generated from log2 (reads per kb per million mapped reads (RPKM)) values. b, Venn diagram showing overlapping and unique enhancer regions among the three CD8+ T cell subsets. c, Top, heatmap showing enhancer regions with differential accessibility. Scale bar represents z scores that were generated from log2 (RPKM) values. Bottom, heatmap showing the enrichment of TF-binding motifs in six enhancer peak sets using HOMER motif analysis. Scale bar represents z scores that were generated from −log10 (P values). ATAC-seq data are from two independent replicates. Each replicate was pooled together from two to three mice.
Fig. 6 |
Fig. 6 |. BATF is required for TPRo cell differentiation into TEFF cells.
af, Representative flow plots and summary data showing the percentage of virus-specific CD8+ T cells as well as the proportion of three antigen-specific CD8+ T cell subsets in WT and BATF-HET mice on day 8 or day 21 p.i. with LCMV Cl13. g, Summary data showing the proportion of CD8+ T cells degranulating (CD107a+) and producing IFN-γ upon ex vivo stimulation with the GP33–41 peptide. hj, Summary data showing the relative expression of GzmB, T-bet and PD-1 in three virus-specific CD8+ T cell subsets. These subsets were all gated on CD8+CD44+GFP+ cells first, which represent polyclonal LCMV-specific CD8+ T cells. c,e, Data were collected from four WT and seven BATF-HET mice. d,f, Data were collected from six WT and four BATF-HET mice. gj, Data were collected from four WT and four BATF-HET mice. cj, Data were pooled from two independent experiments. Data are expressed as mean ± s.e.m. *P < 0.05, **P < 0.01, ***P < 0.001. c,d, Two-tailed unpaired t-test. ej, Unpaired t-test with the Benjamini and Hochberg method or the Holm–Šídák method.
Fig. 7 |
Fig. 7 |. BATF modulates enhancer accessibility to facilitate the TPRO-to-TEFF cell transition.
a,b, Comparison of global BATF CUT&Tag-seq peaks in three virus-specific CD8+ T cell subsets. a, Venn diagram demonstrating numbers of BATF CUT&Tag-seq peaks commonly or differentially present in the three CD8+ T cell subsets. b, Heatmap showing signal intensity (reads per 50 bp) of each BATF CUT&Tag-seq peak. k-means clustering in seqMINER was used to group the BATF CUT&Tag-seq peaks based on their signal intensities (linear normalization method). c, Left, dynamics of active enhancers (ATAC+H3K27ac+) during the TPRO-to-TEFF cell transition. Active enhancers were grouped into three categories based on their presence in TPRO cells and TEFF cells. Right, occupancy of BATF at these active enhancers. BATF-bound active enhancers were annotated to nearby genes using HOMER annotatePeaks. Representative genes in each group are listed on the right. d, Genome track view of the Tbx21 locus showing ATAC-seq, H3K27ac and BATF CUT&Tag peaks in TPRO cells, TEFF cells and TEXH cells. TFs with predictive binding sites at the enhancers (green shadows) are listed. For ATAC-seq data, the scale bar represents RPKM values. For BATF CUT&Tag-seq data, the scale bar represents Escherichia coli DNA–normalized read counts. BATF CUT&Tag-seq data are from three independent replicates. Each replicate was pooled together from two to three mice.

Comment in

References

    1. Wherry EJ & Kurachi M Molecular and cellular insights into T cell exhaustion. Nat. Rev. Immunol. 15, 486–499 (2015). - PMC - PubMed
    1. He R et al. Follicular CXCR5-expressing CD8+ T cells curtail chronic viral infection. Nature 537, 412–428 (2016). - PubMed
    1. Im SJ et al. Defining CD8+ T cells that provide the proliferative burst after PD-1 therapy. Nature 537, 417–421 (2016). - PMC - PubMed
    1. Utzschneider DT et al. T cell factor 1-expressing memory-like CD8+ T cells sustain the immune response to chronic viral infections. Immunity 45, 415–427 (2016). - PubMed
    1. Leong YA et al. CXCR5+ follicular cytotoxic T cells control viral infection in B cell follicles. Nat. Immunol. 17, 1187–1196 (2016). - PubMed

Publication types

MeSH terms