. 2021 Aug;22(8):983-995.
doi: 10.1038/s41590-021-00964-8. Epub 2021 Jul 19.

BATF and IRF4 cooperate to counter exhaustion in tumor-infiltrating CAR T cells

Affiliations

BATF and IRF4 cooperate to counter exhaustion in tumor-infiltrating CAR T cells

Hyungseok Seo et al. Nat Immunol. 2021 Aug.

Abstract

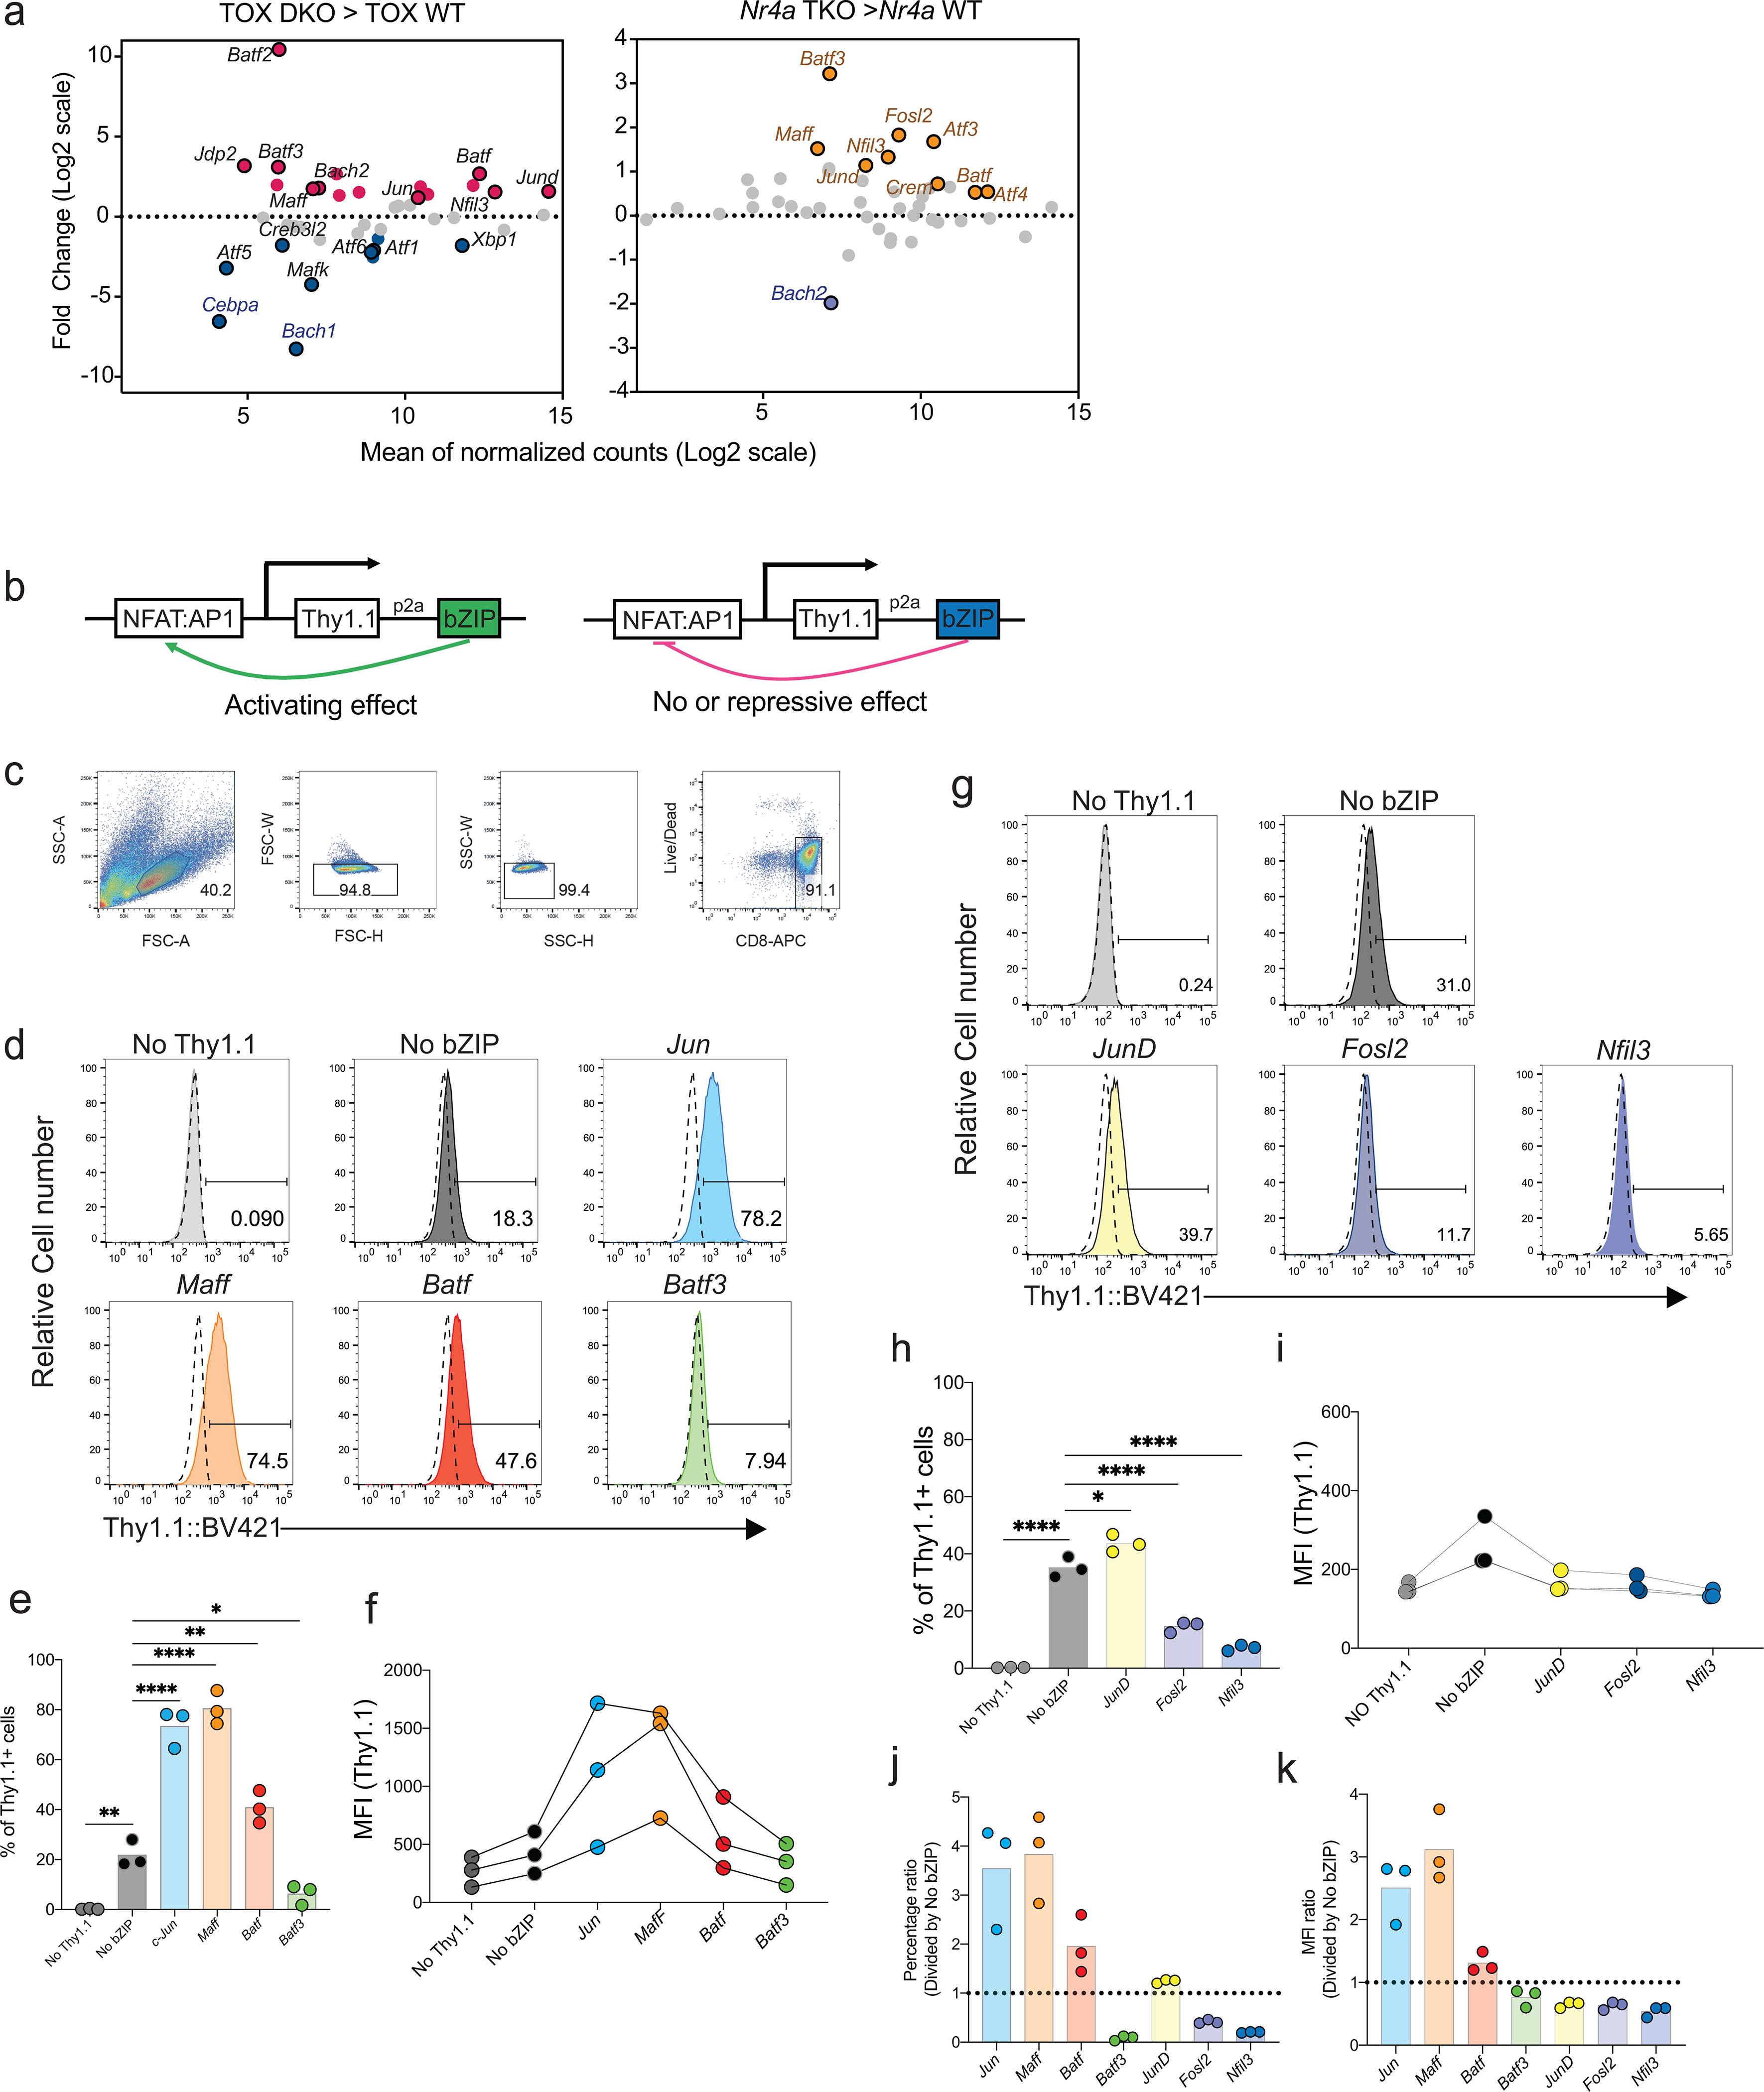
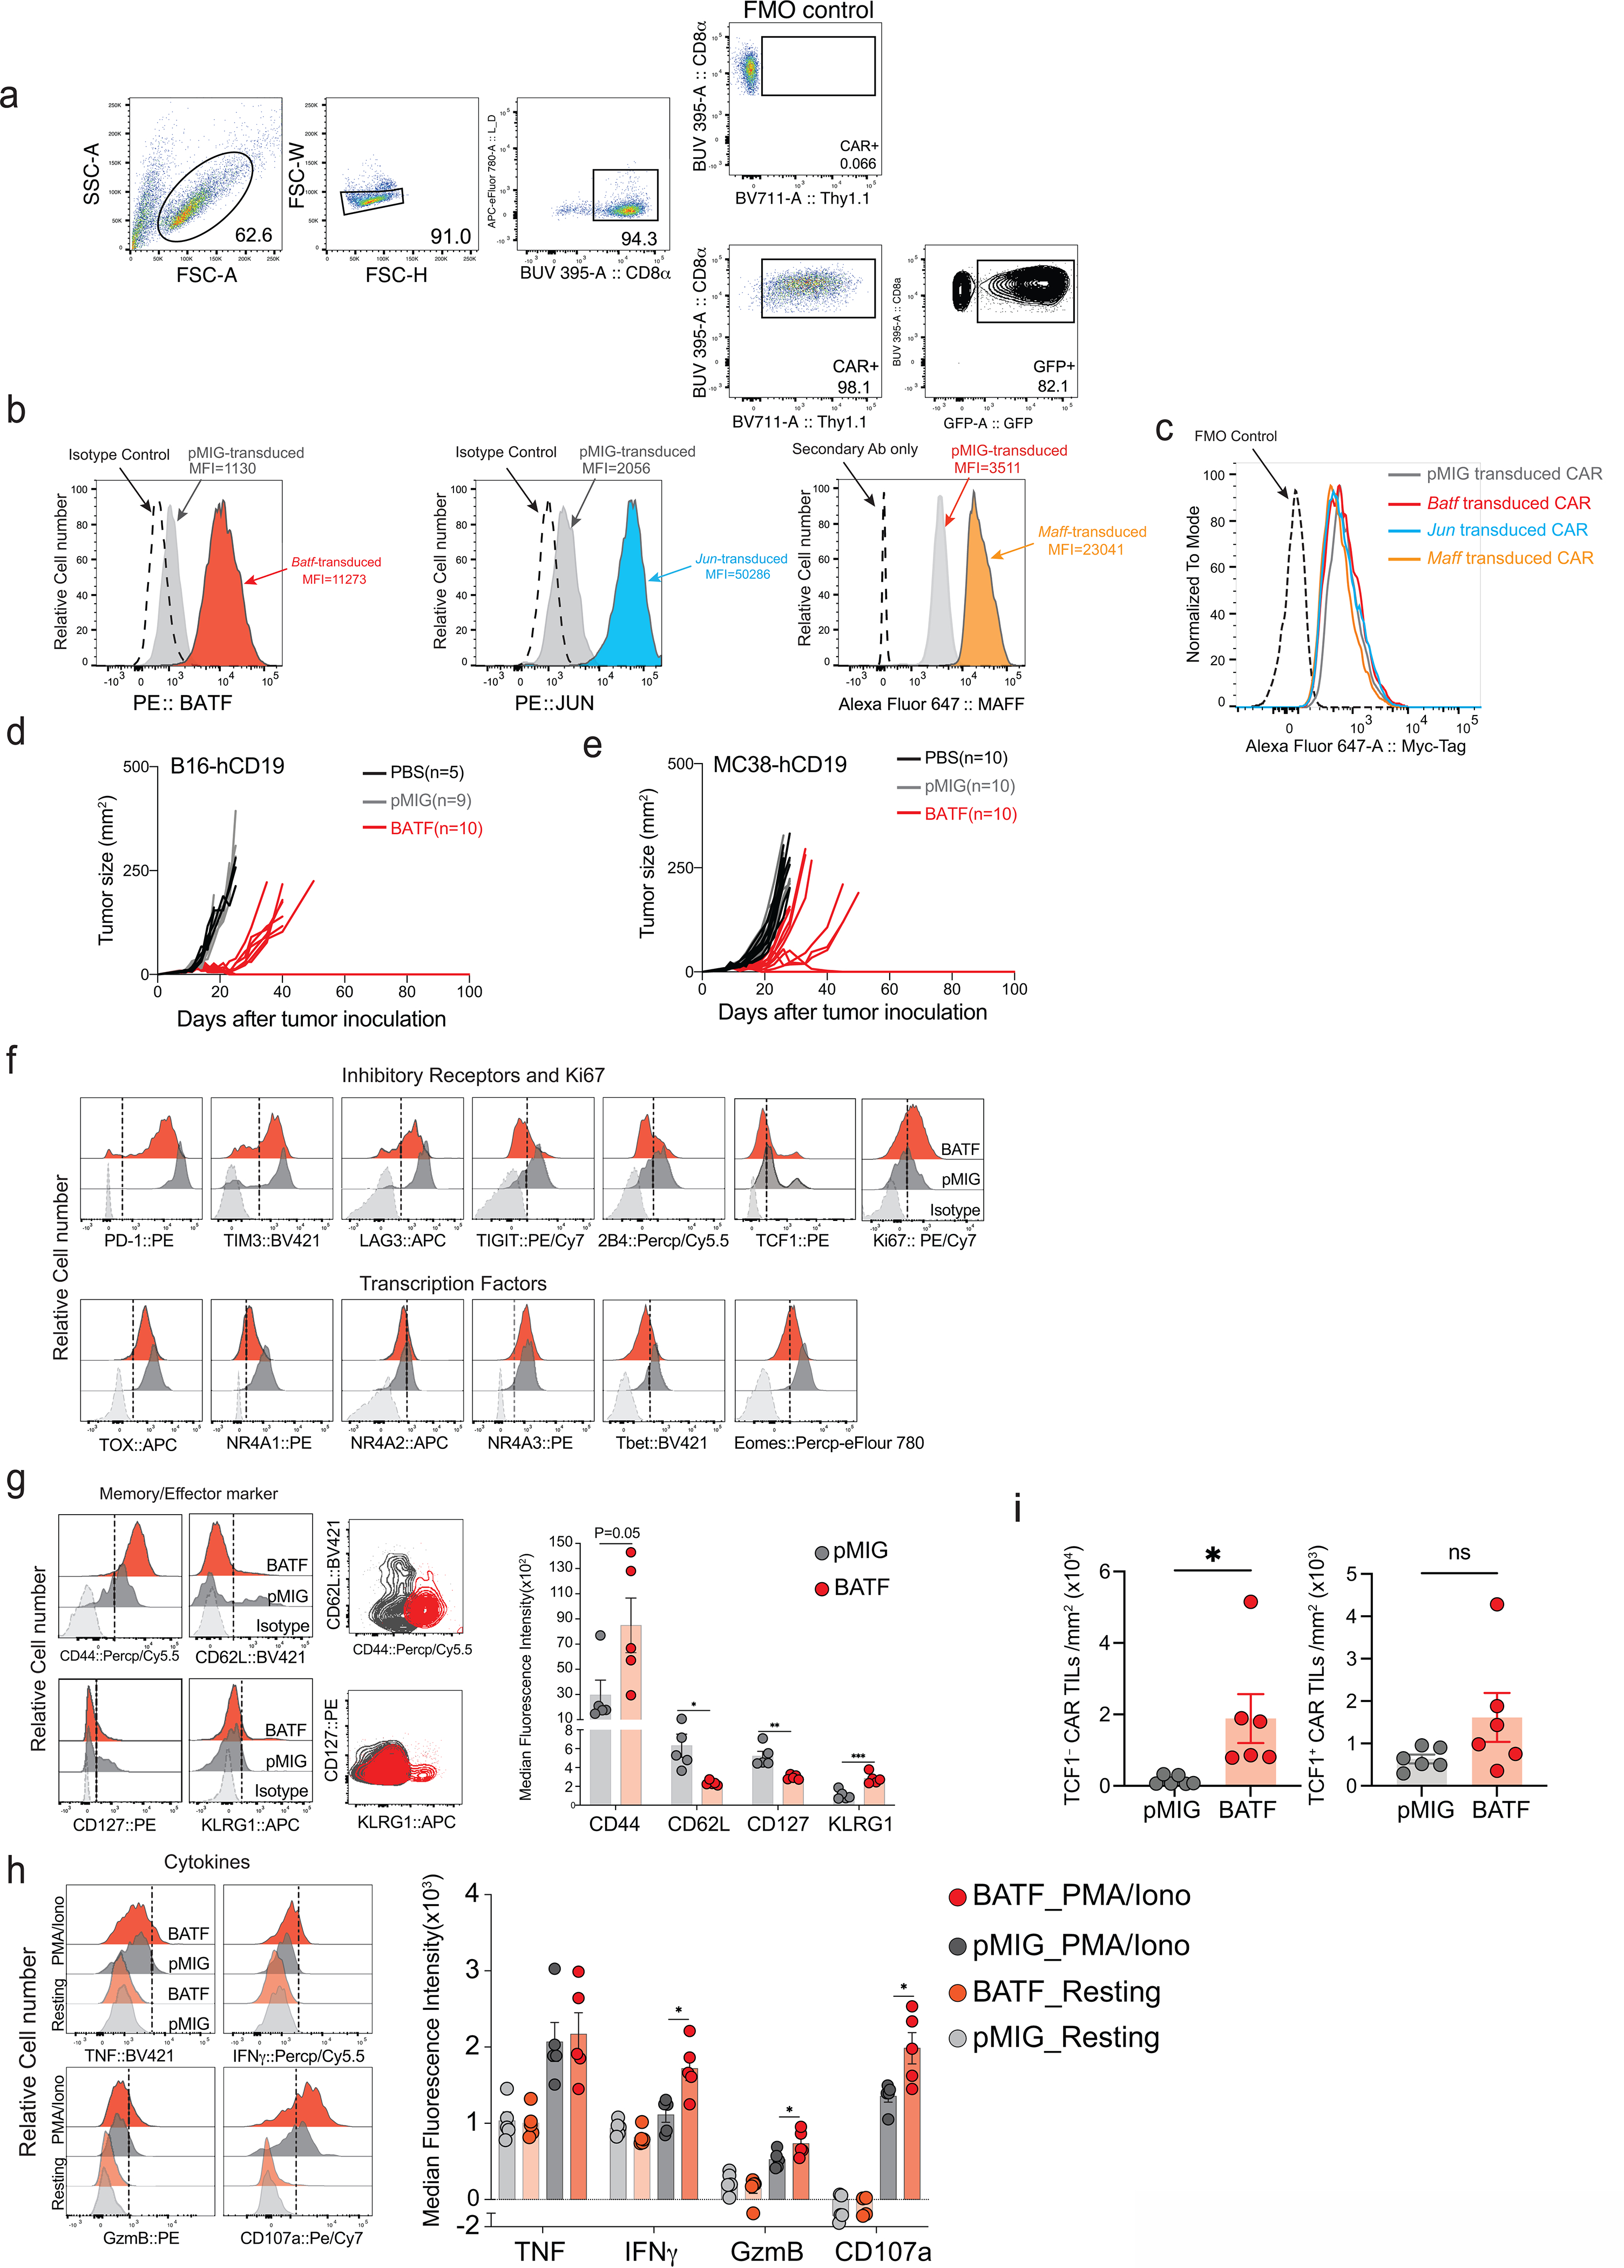
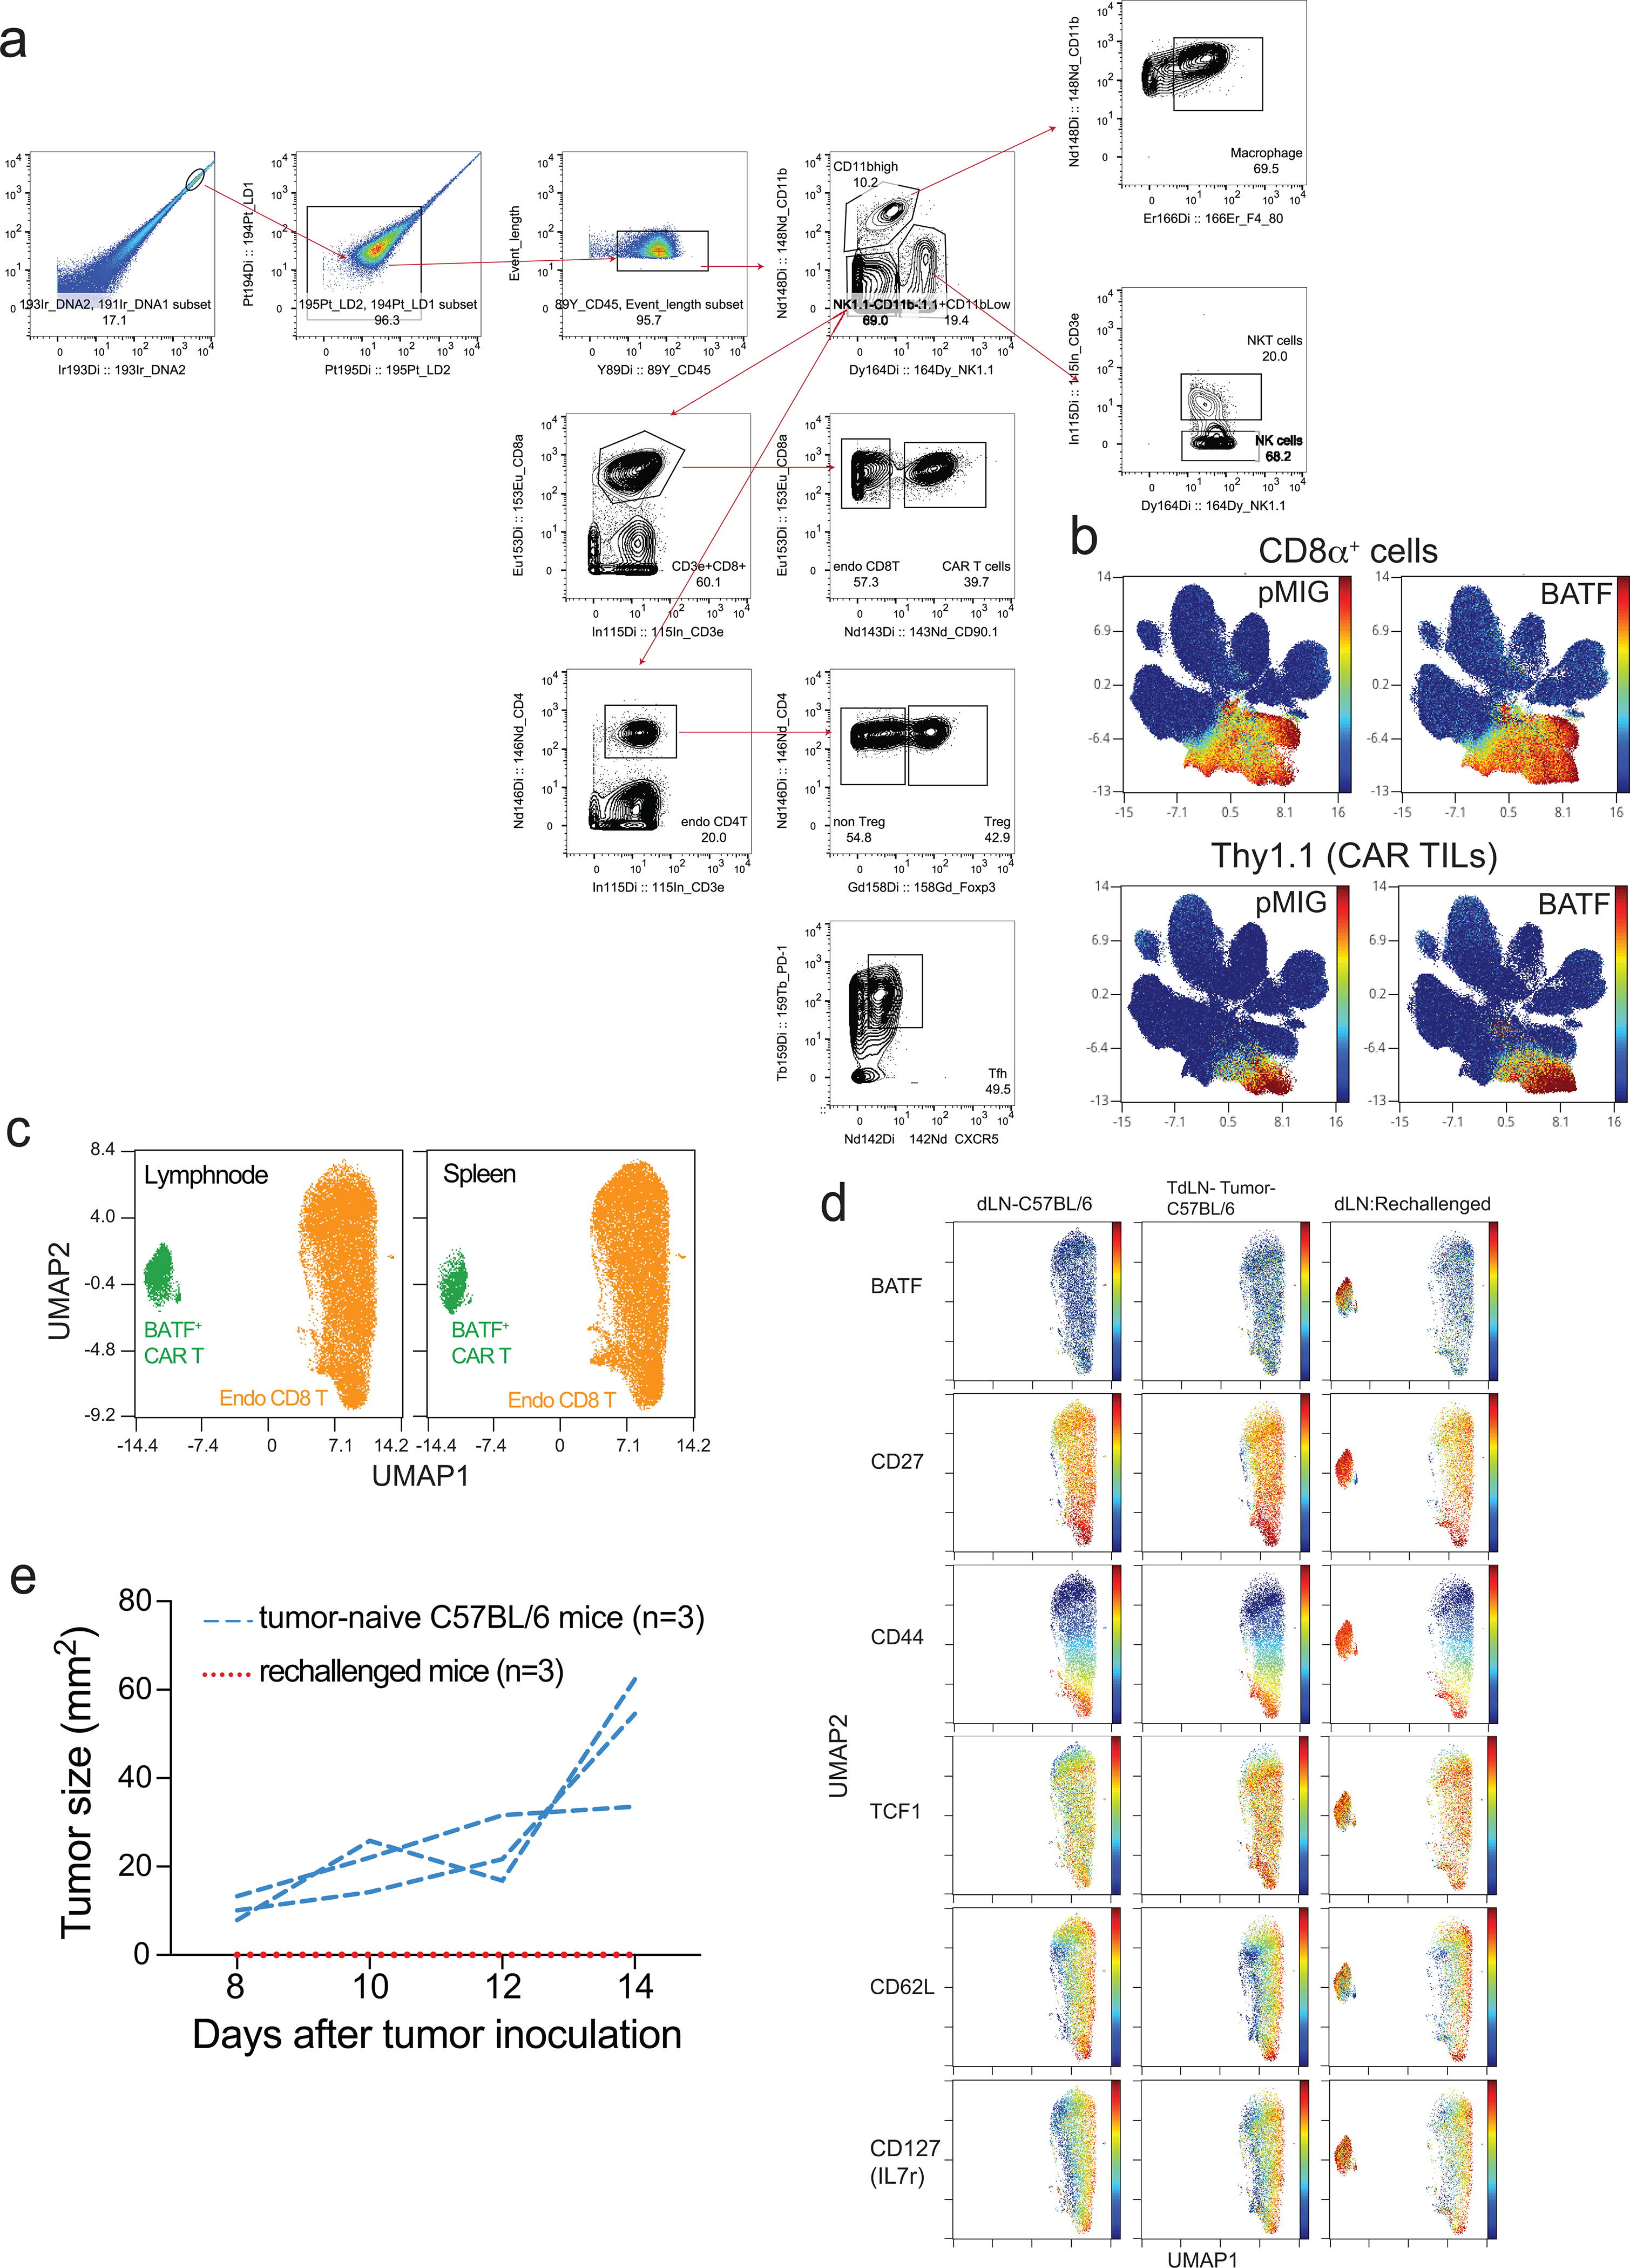
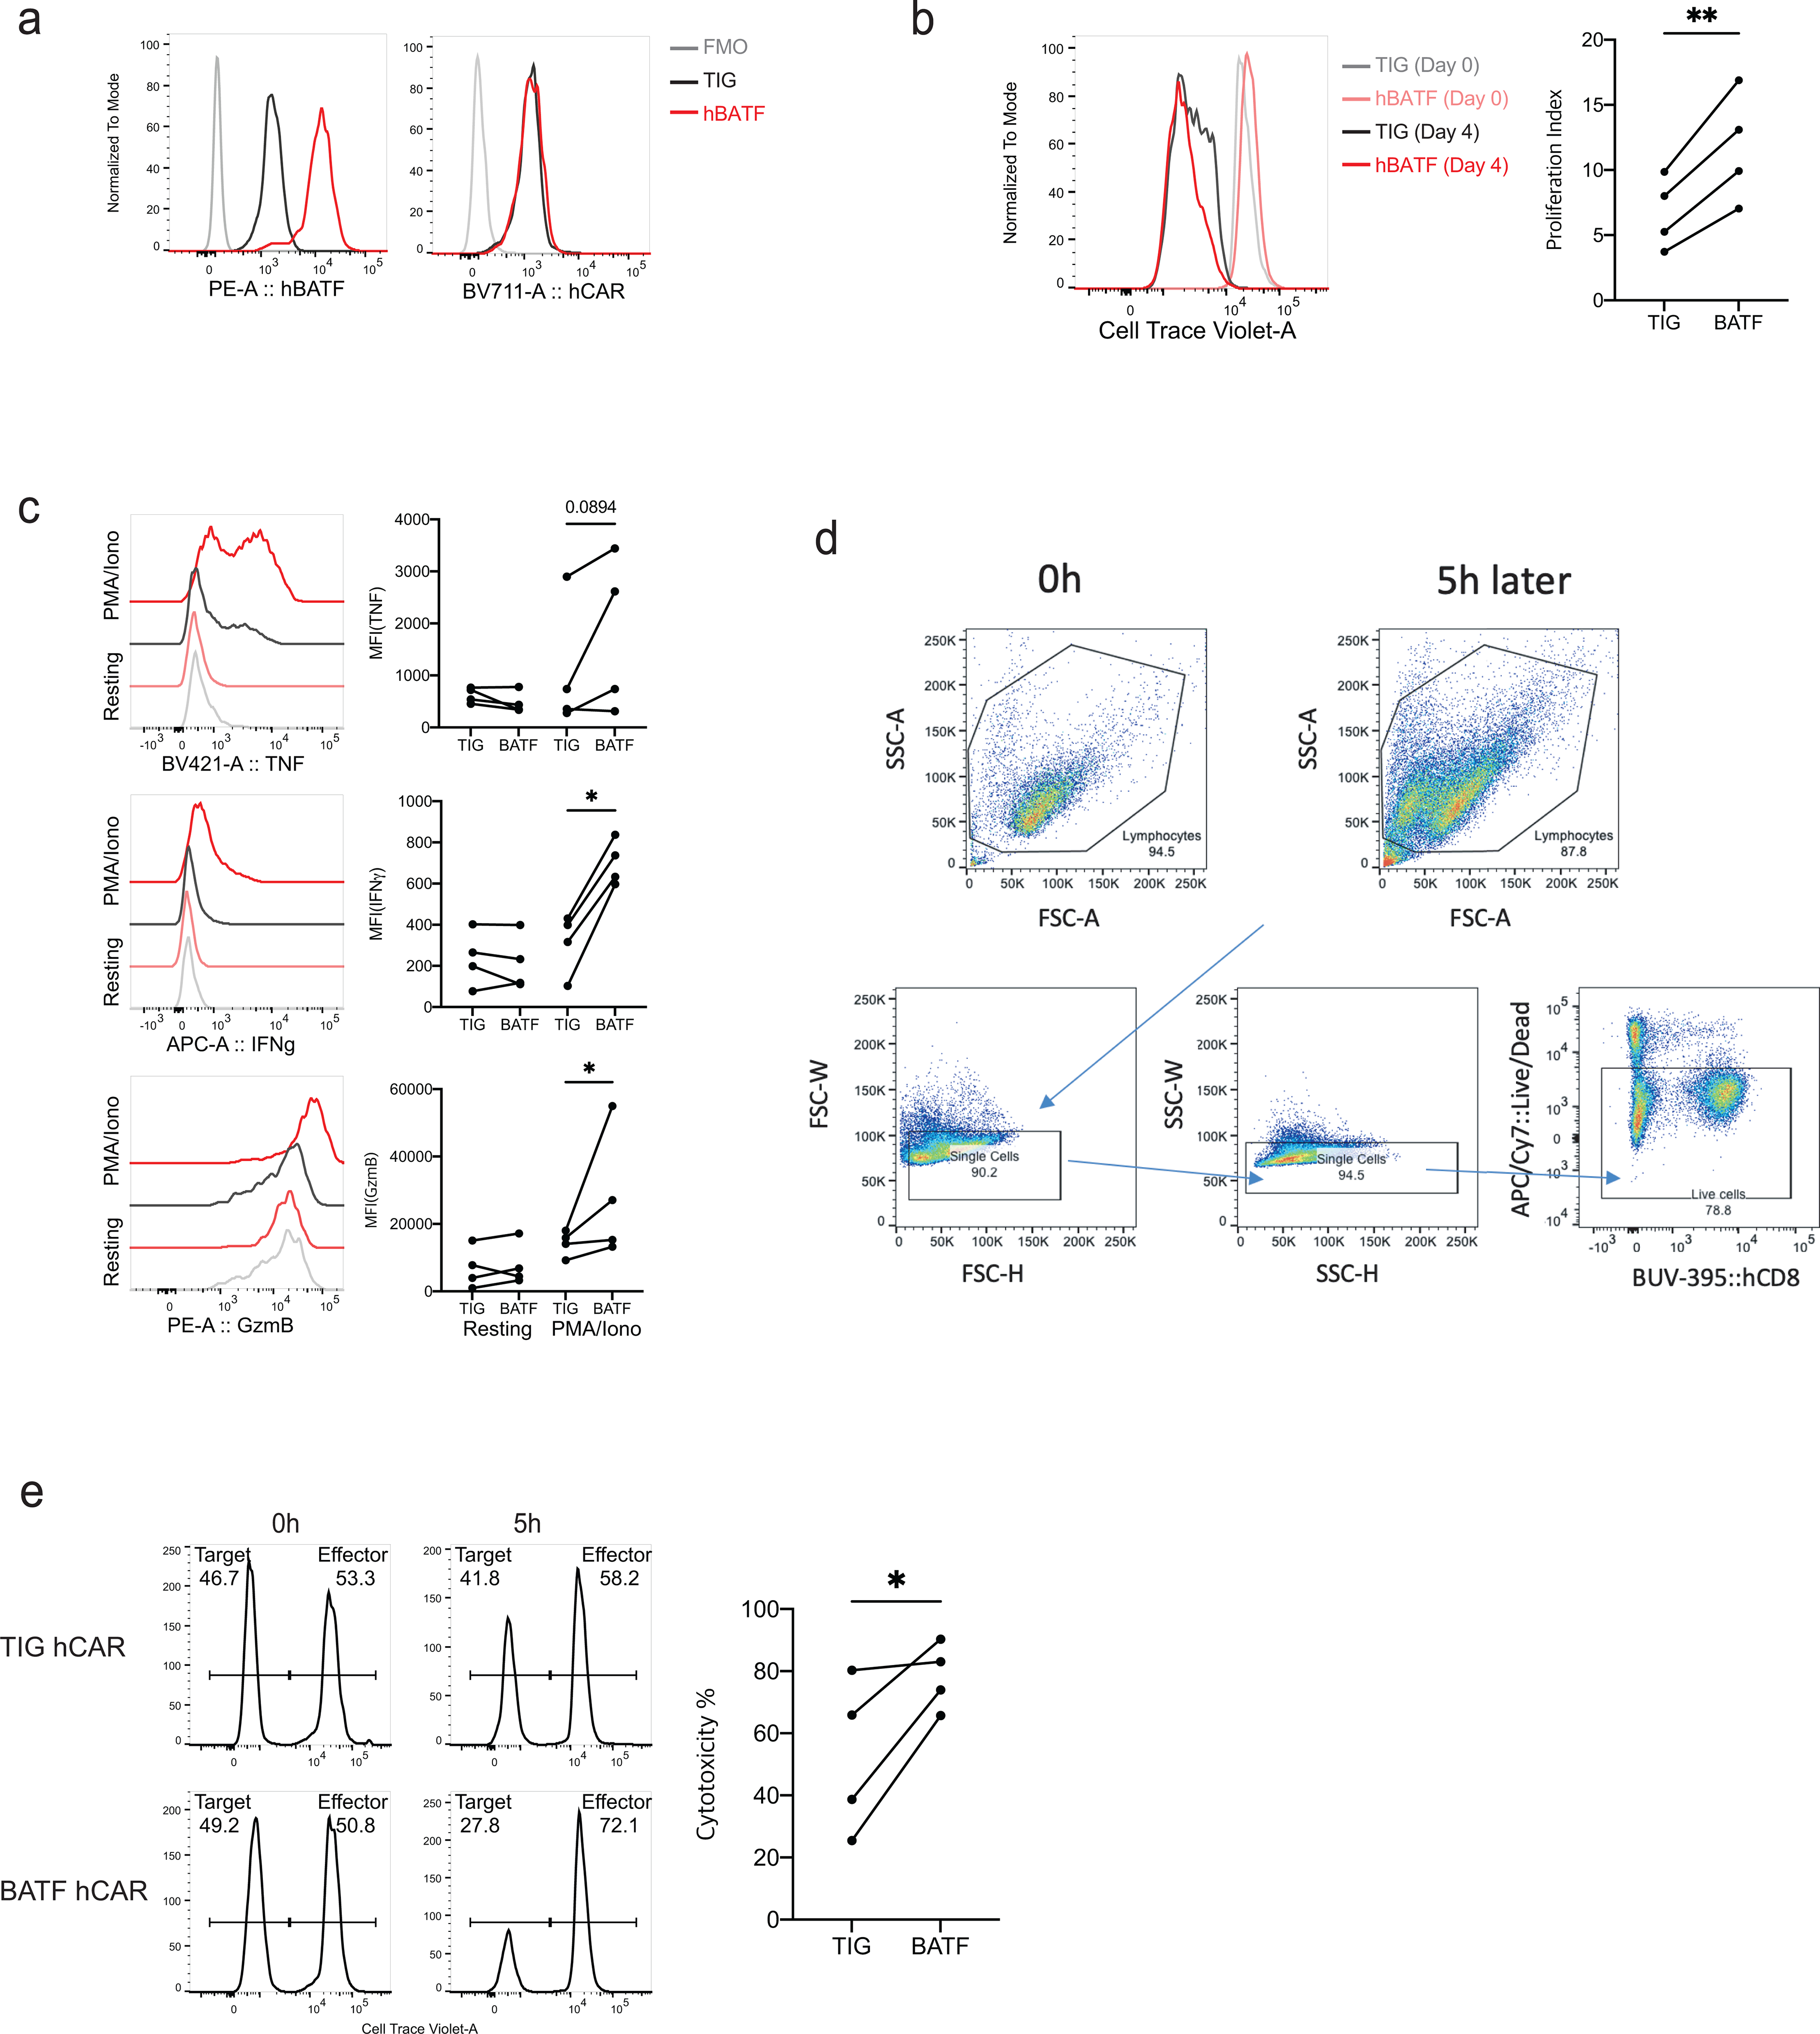
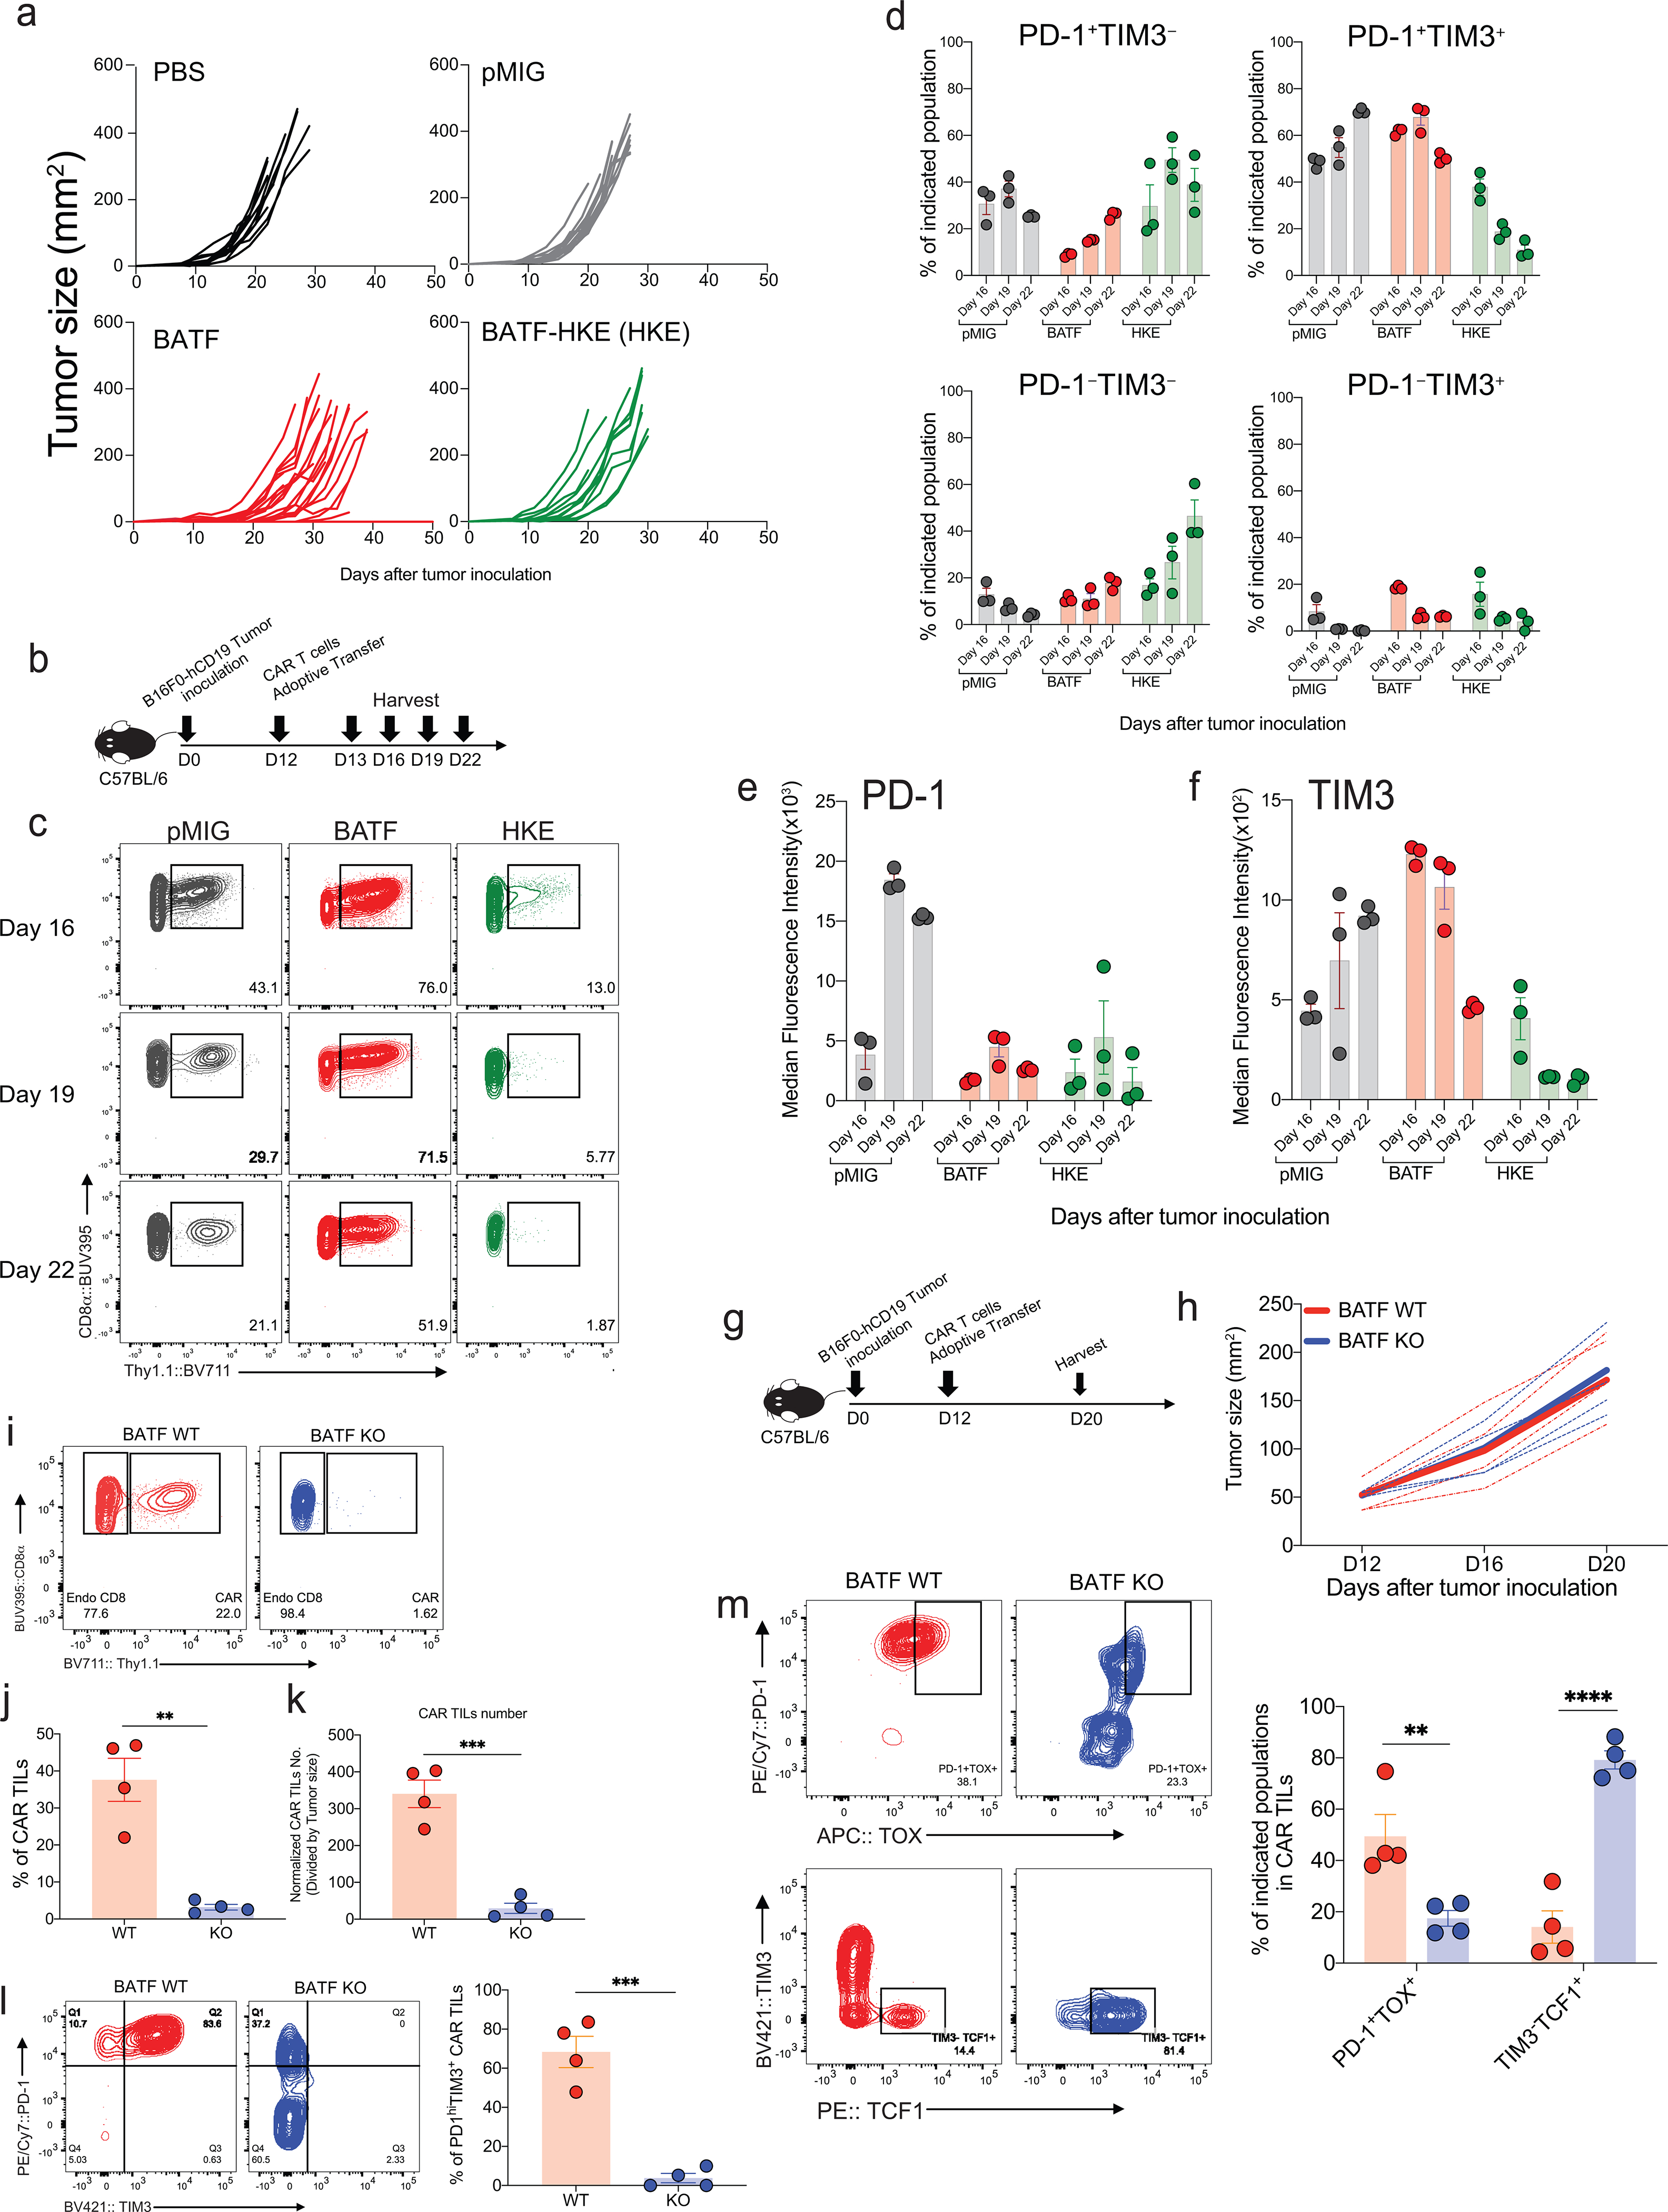
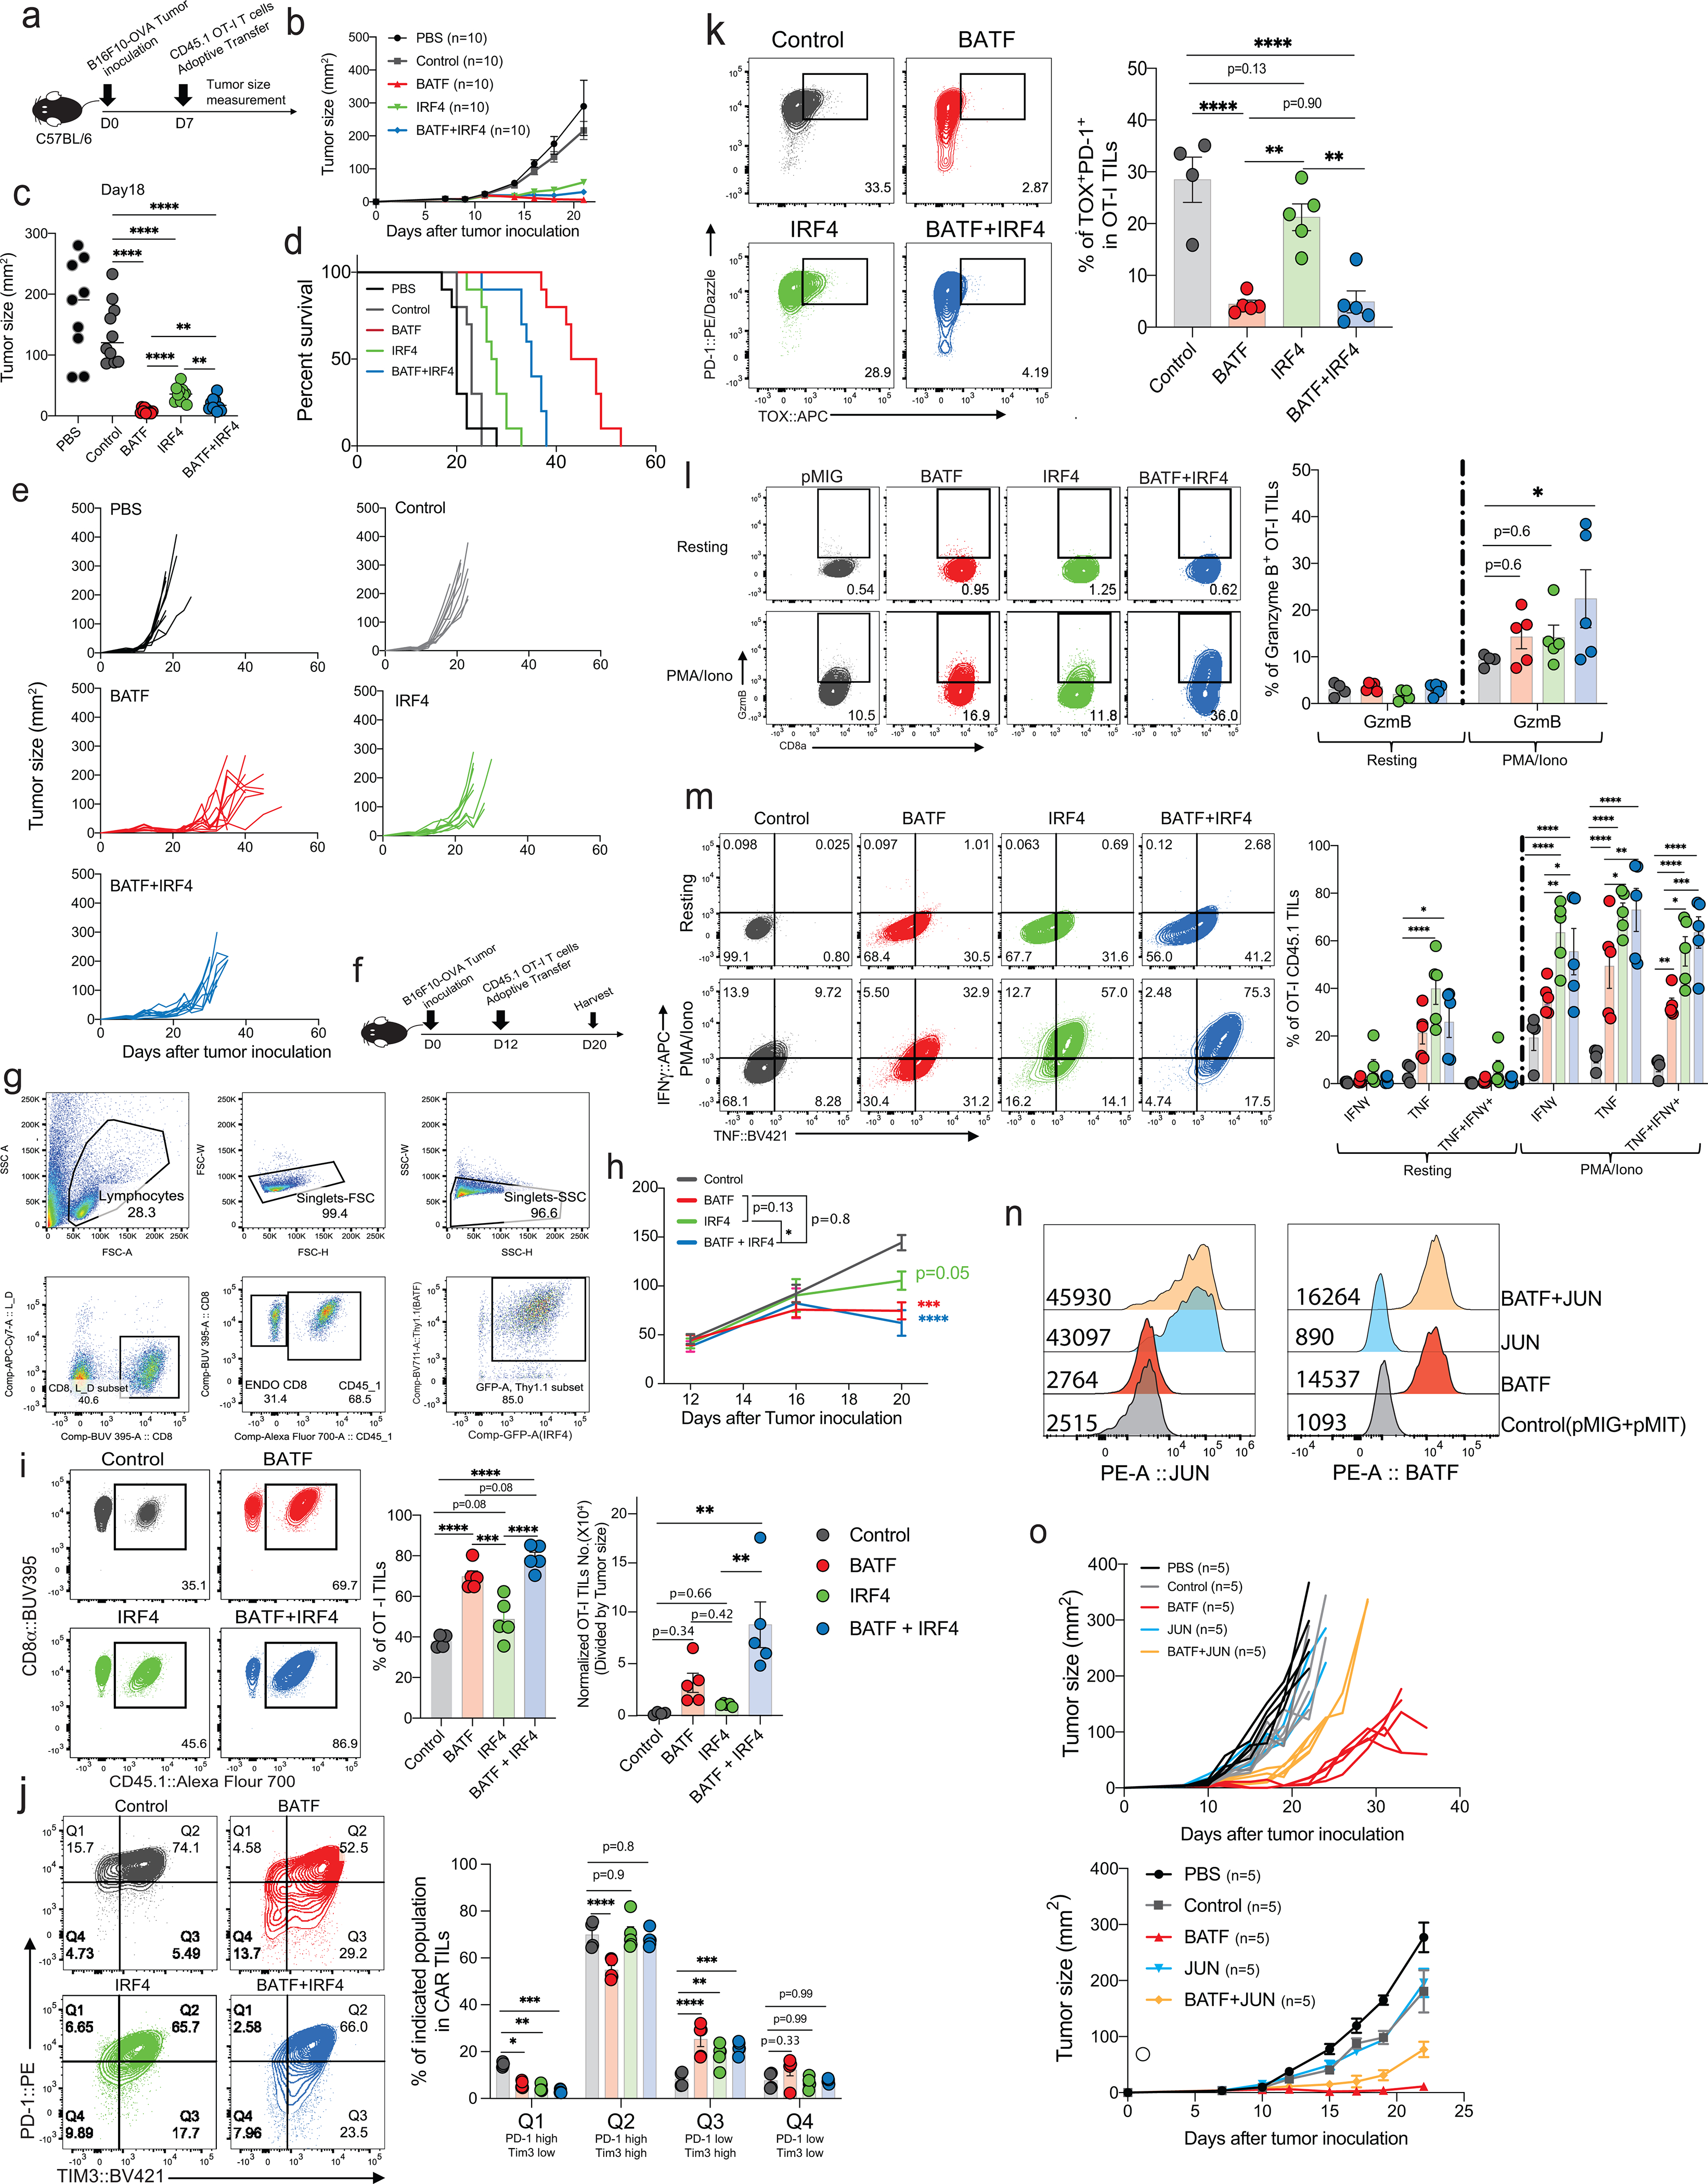
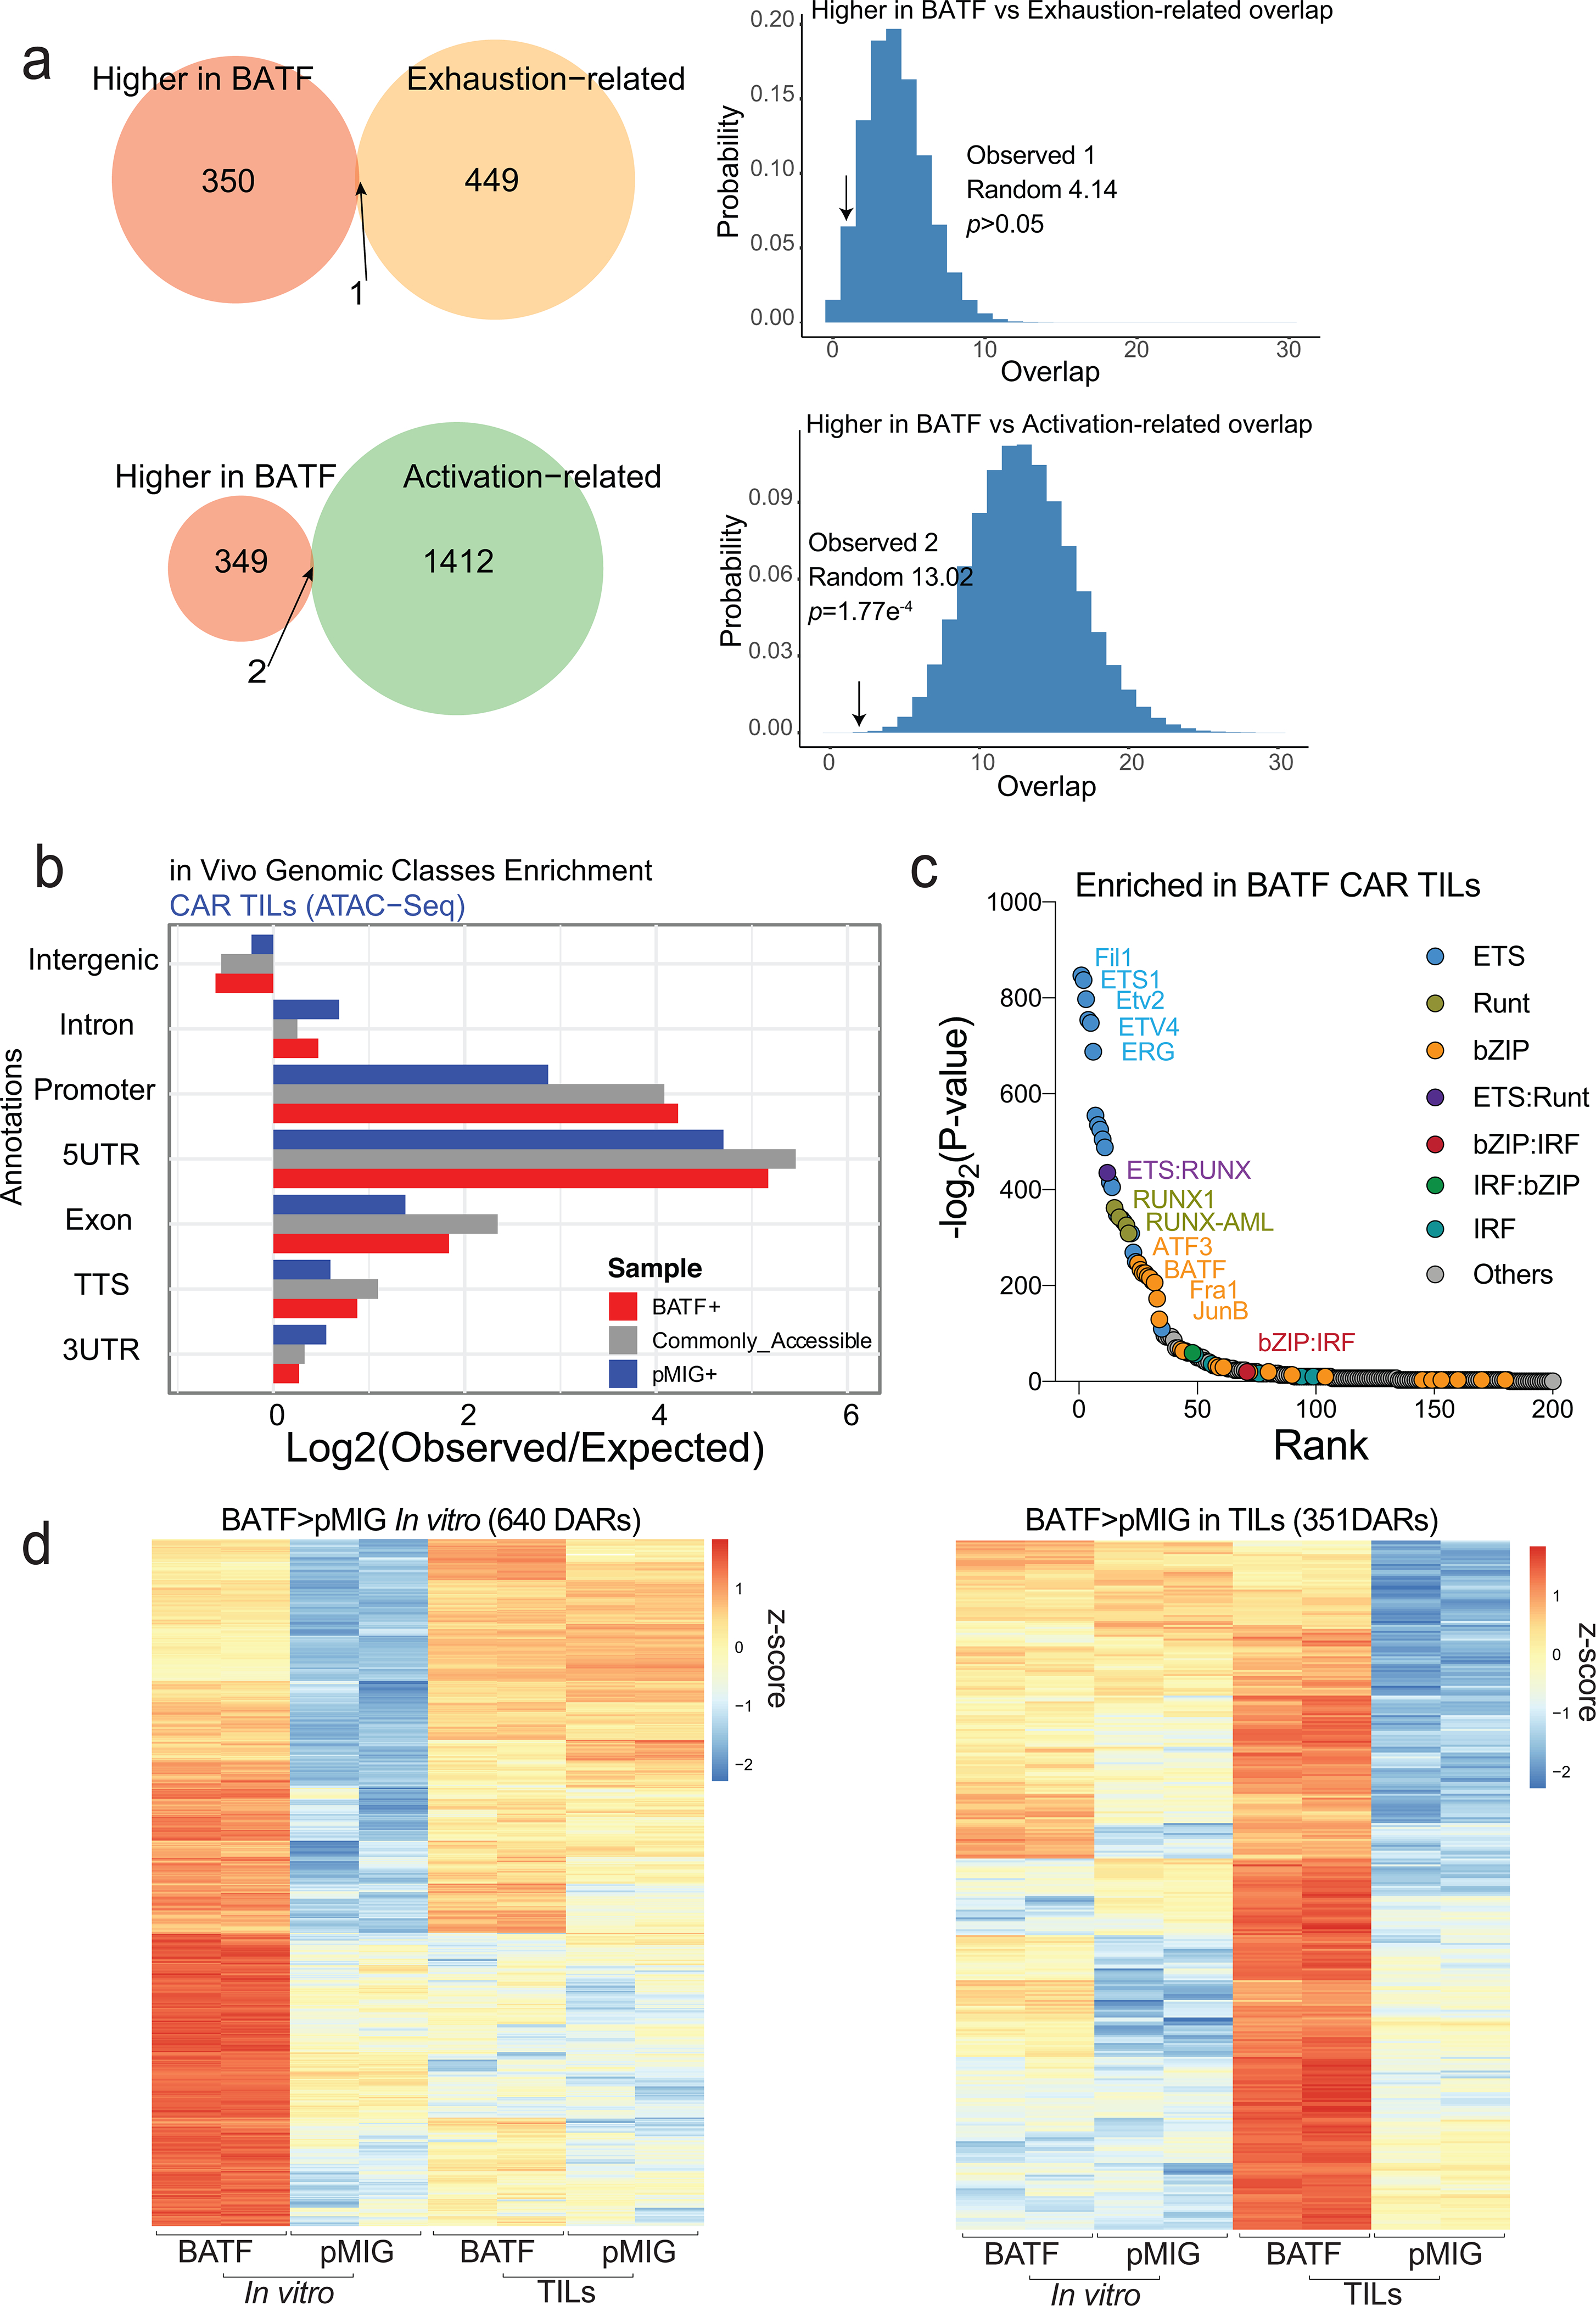
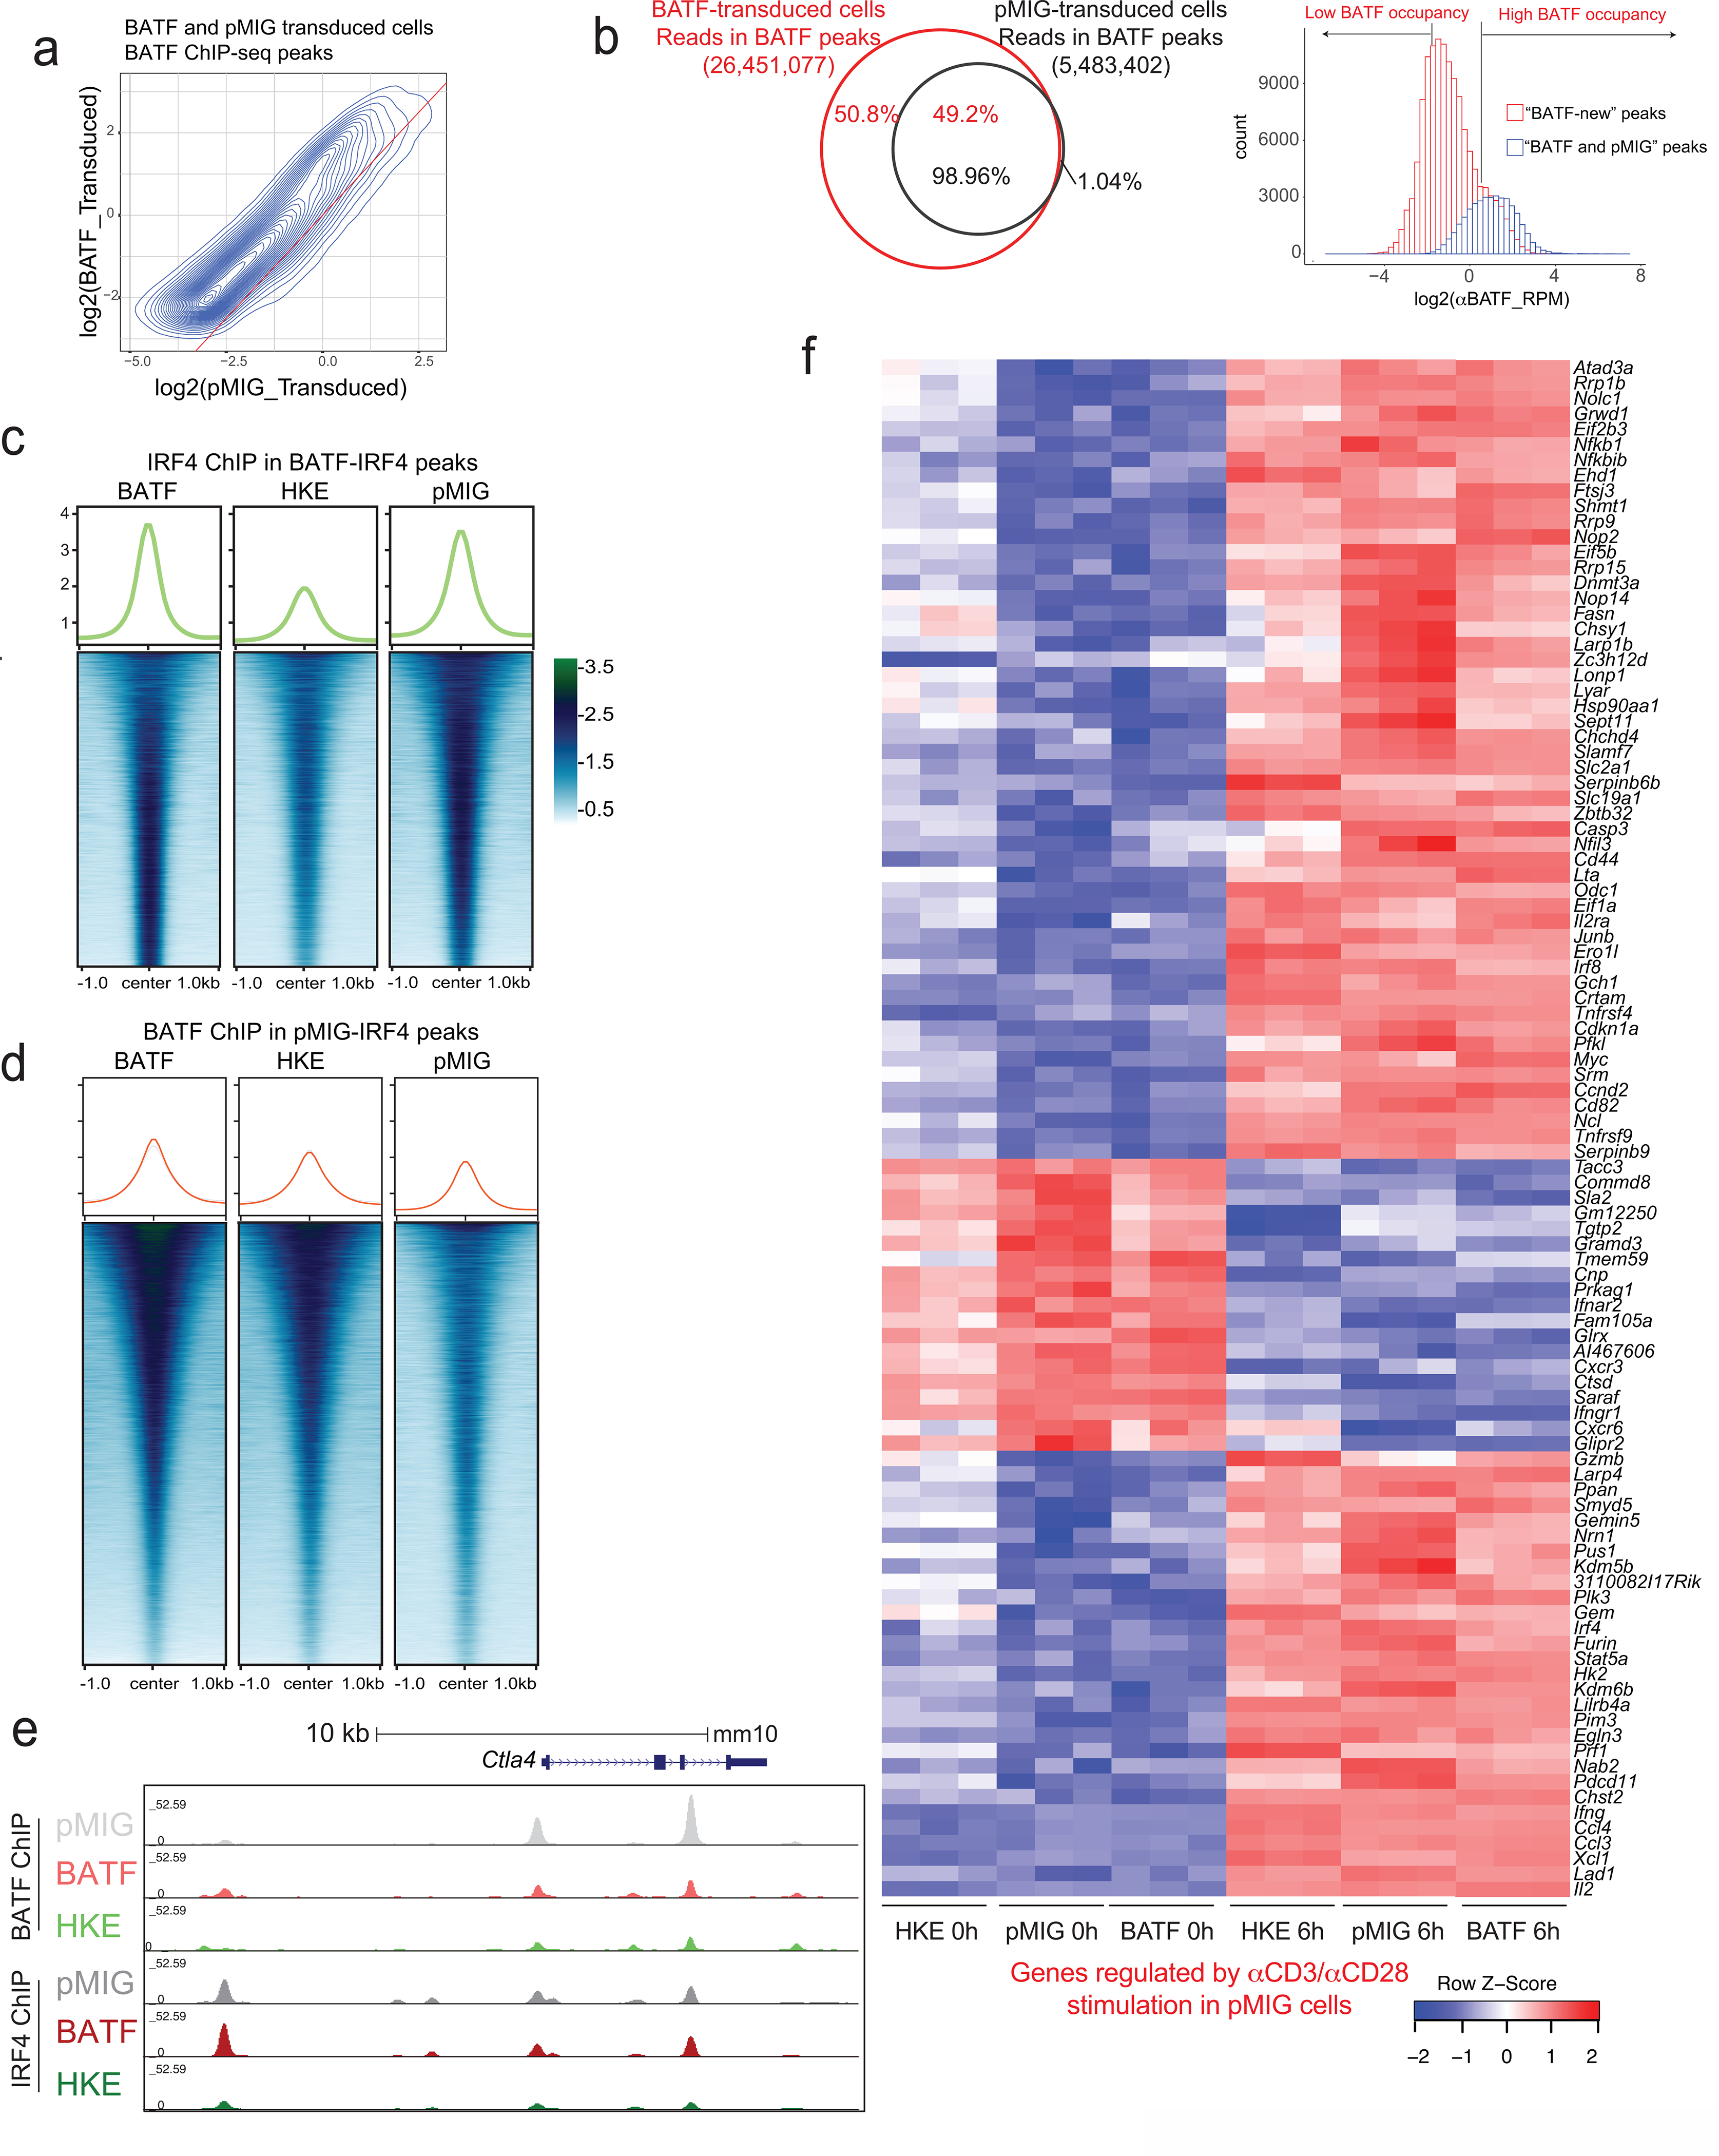
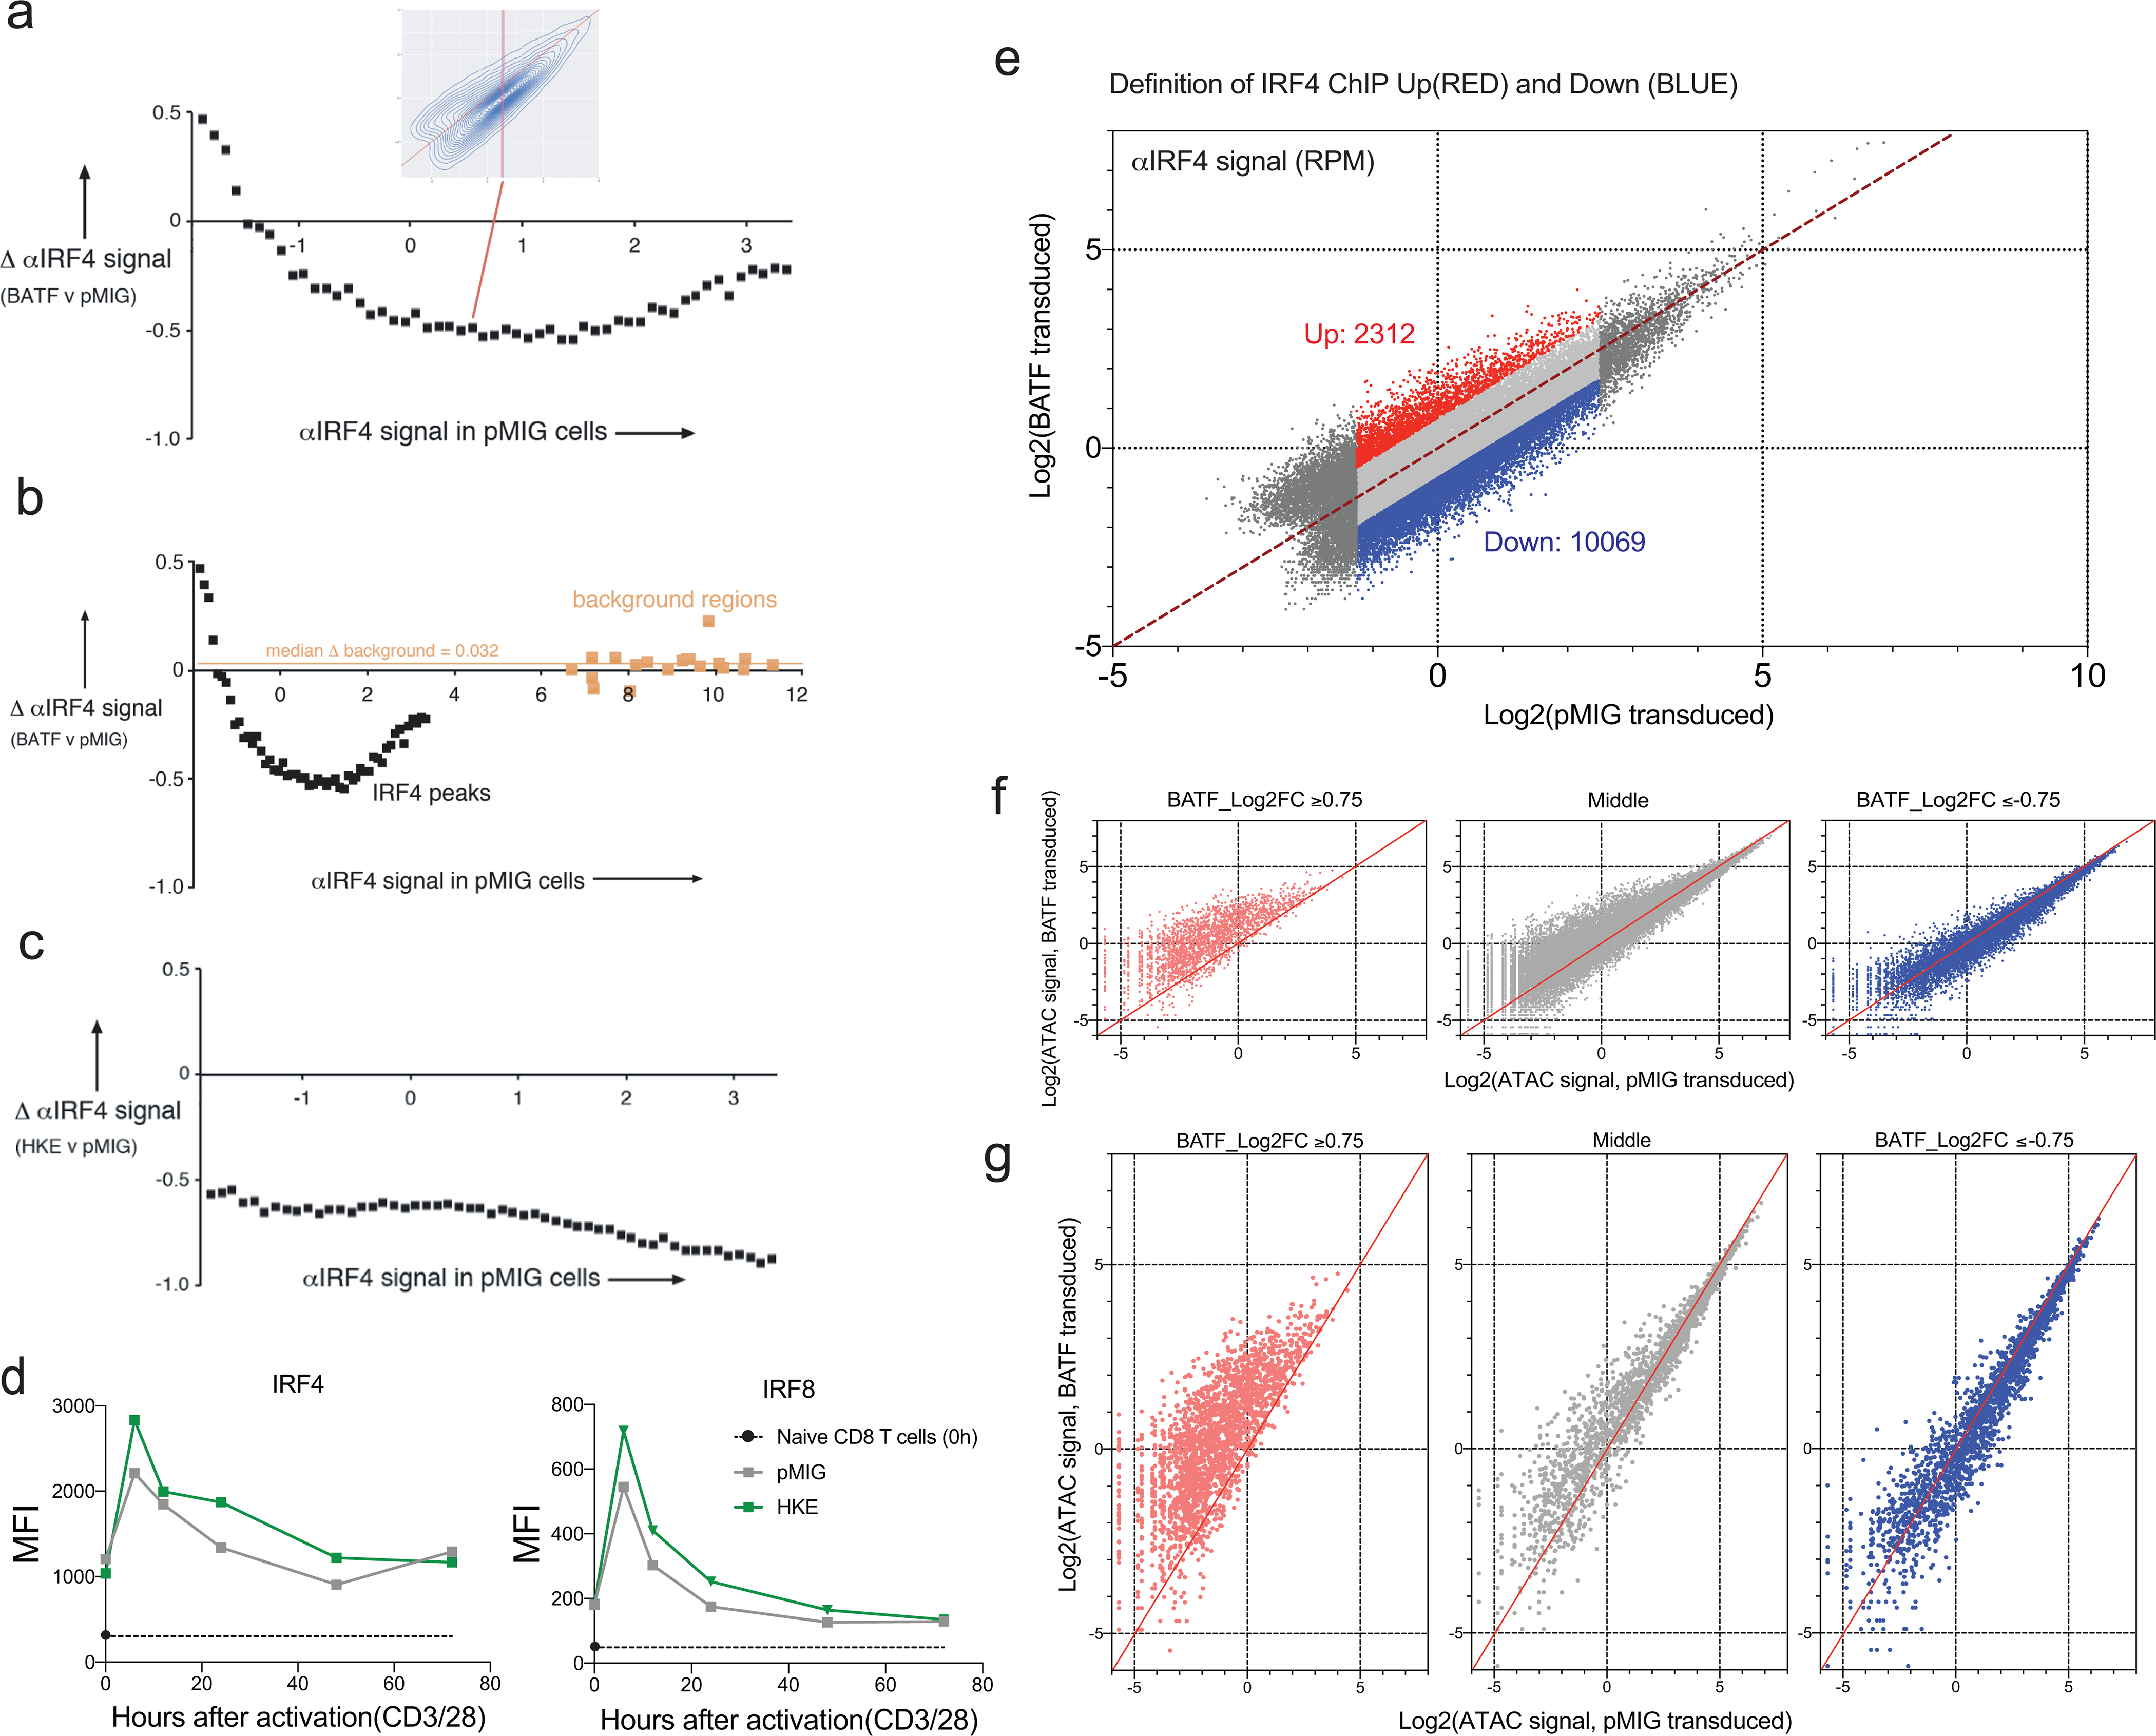
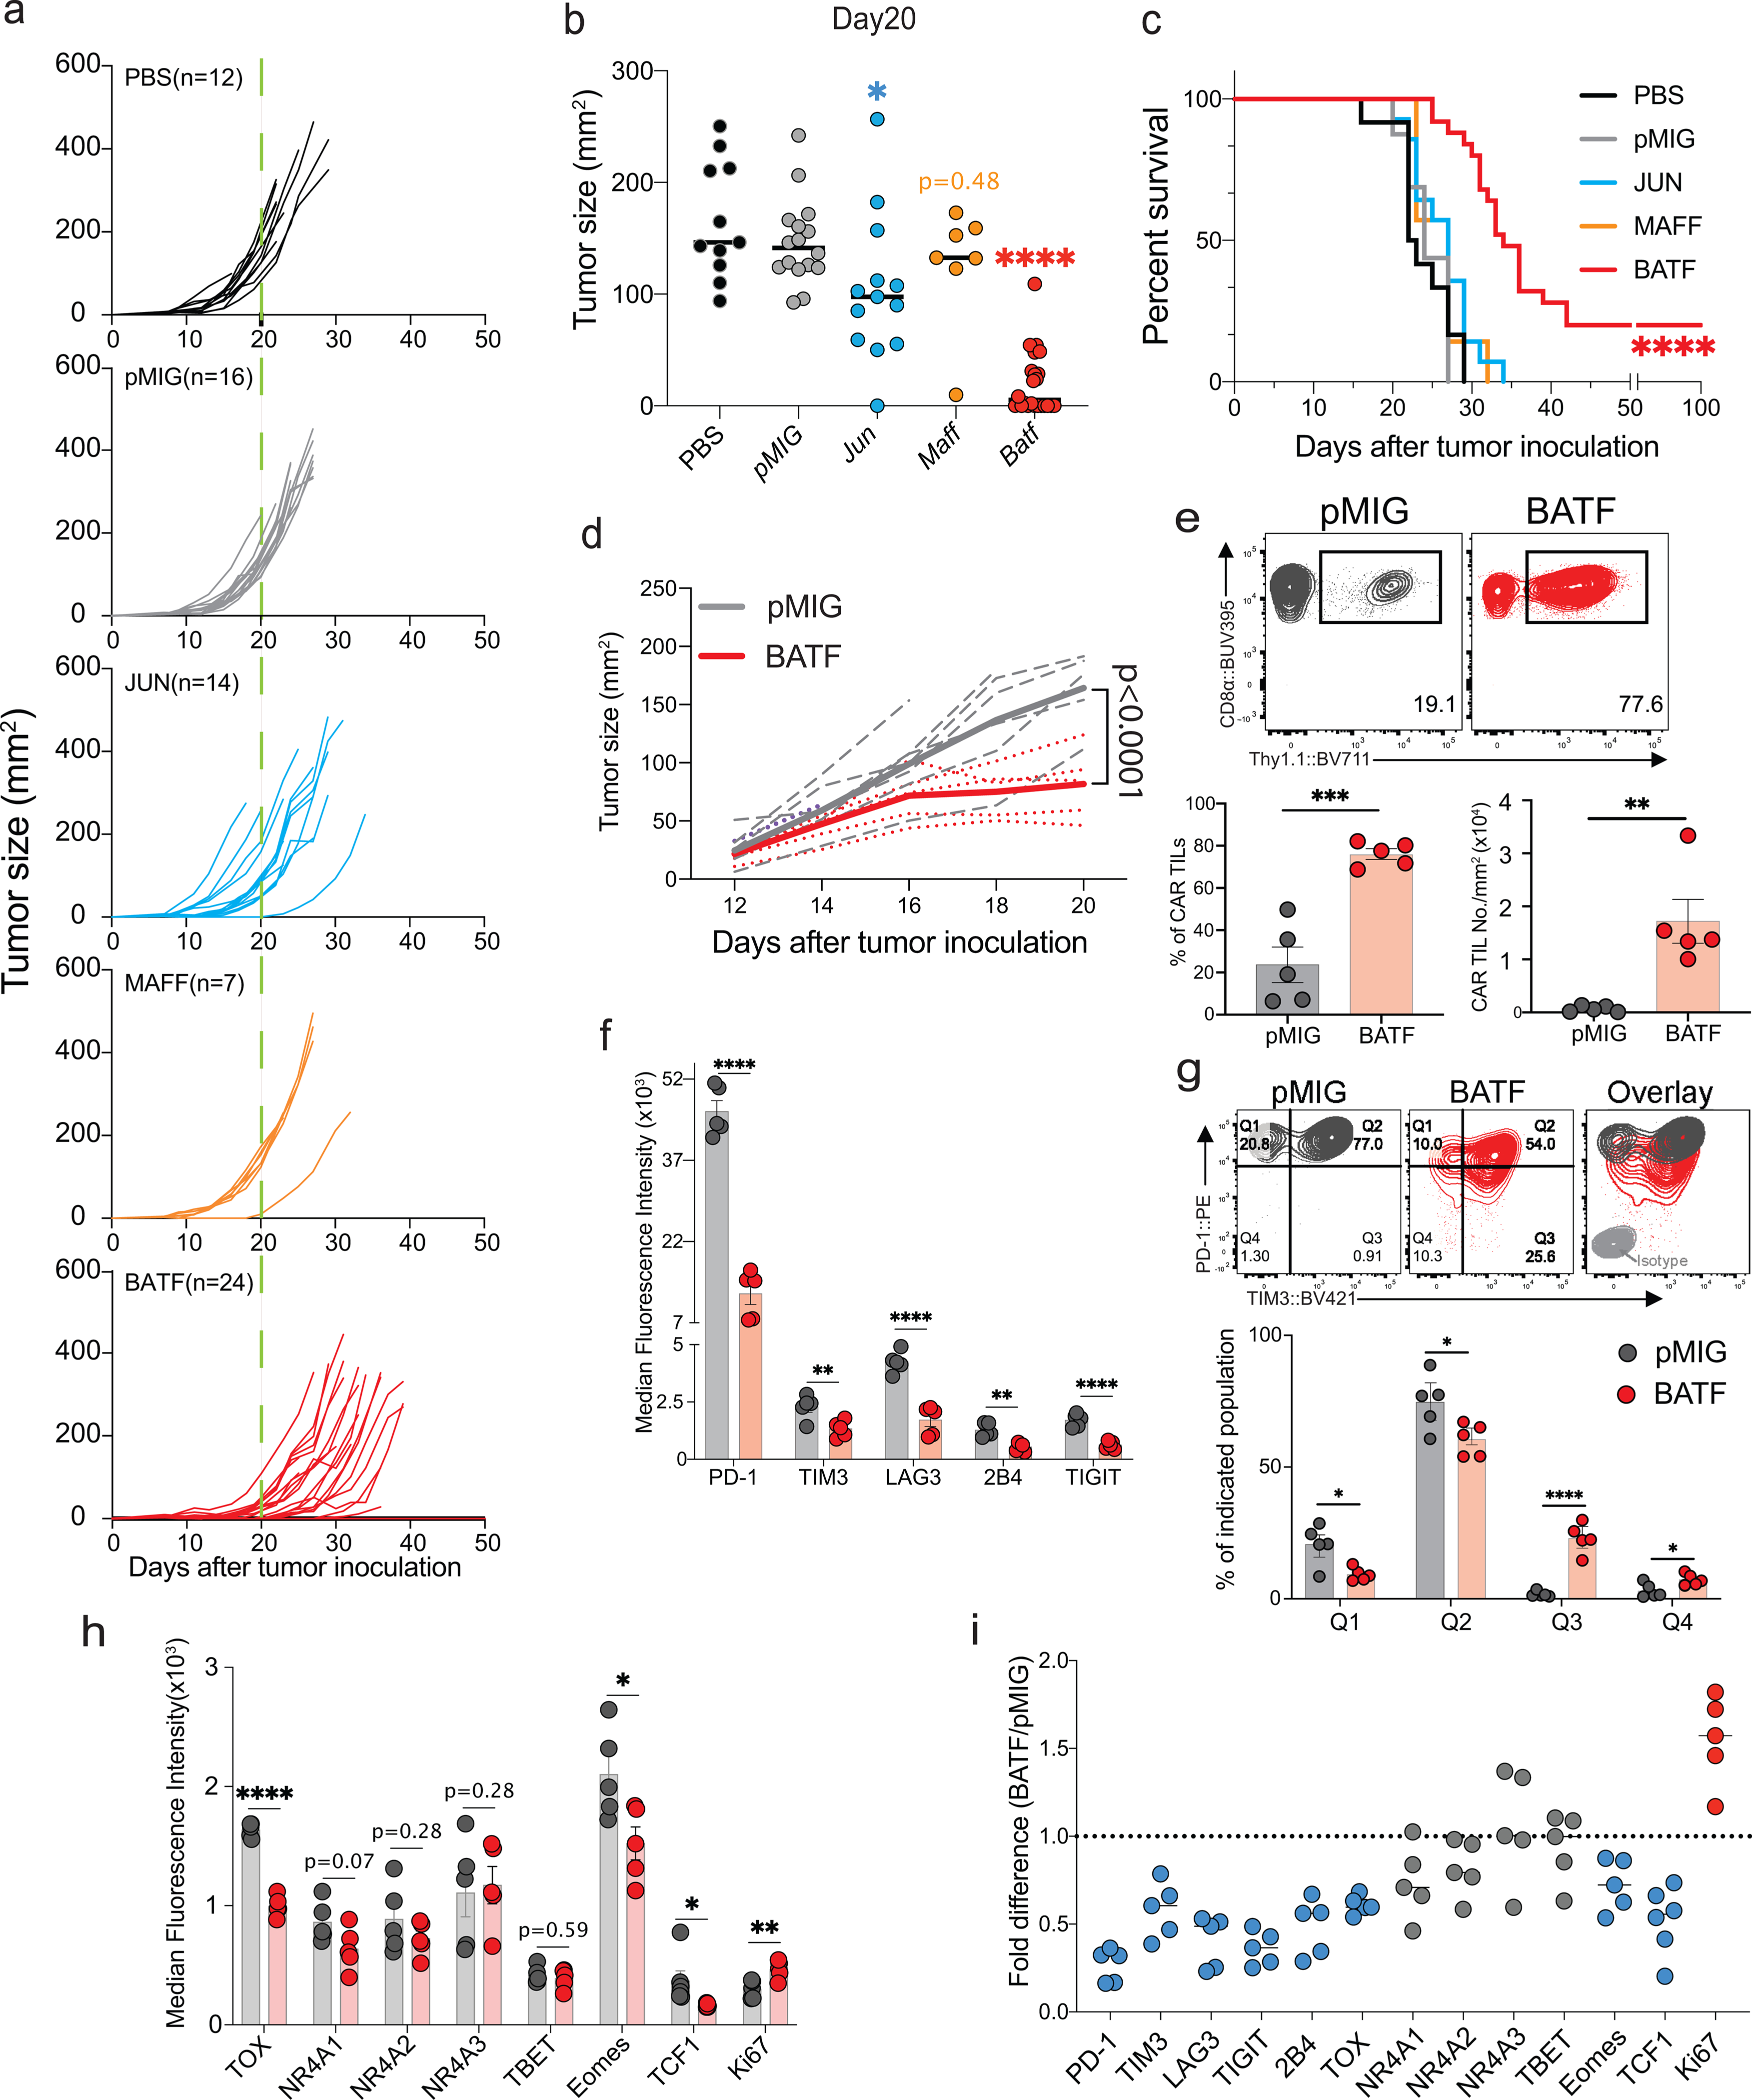
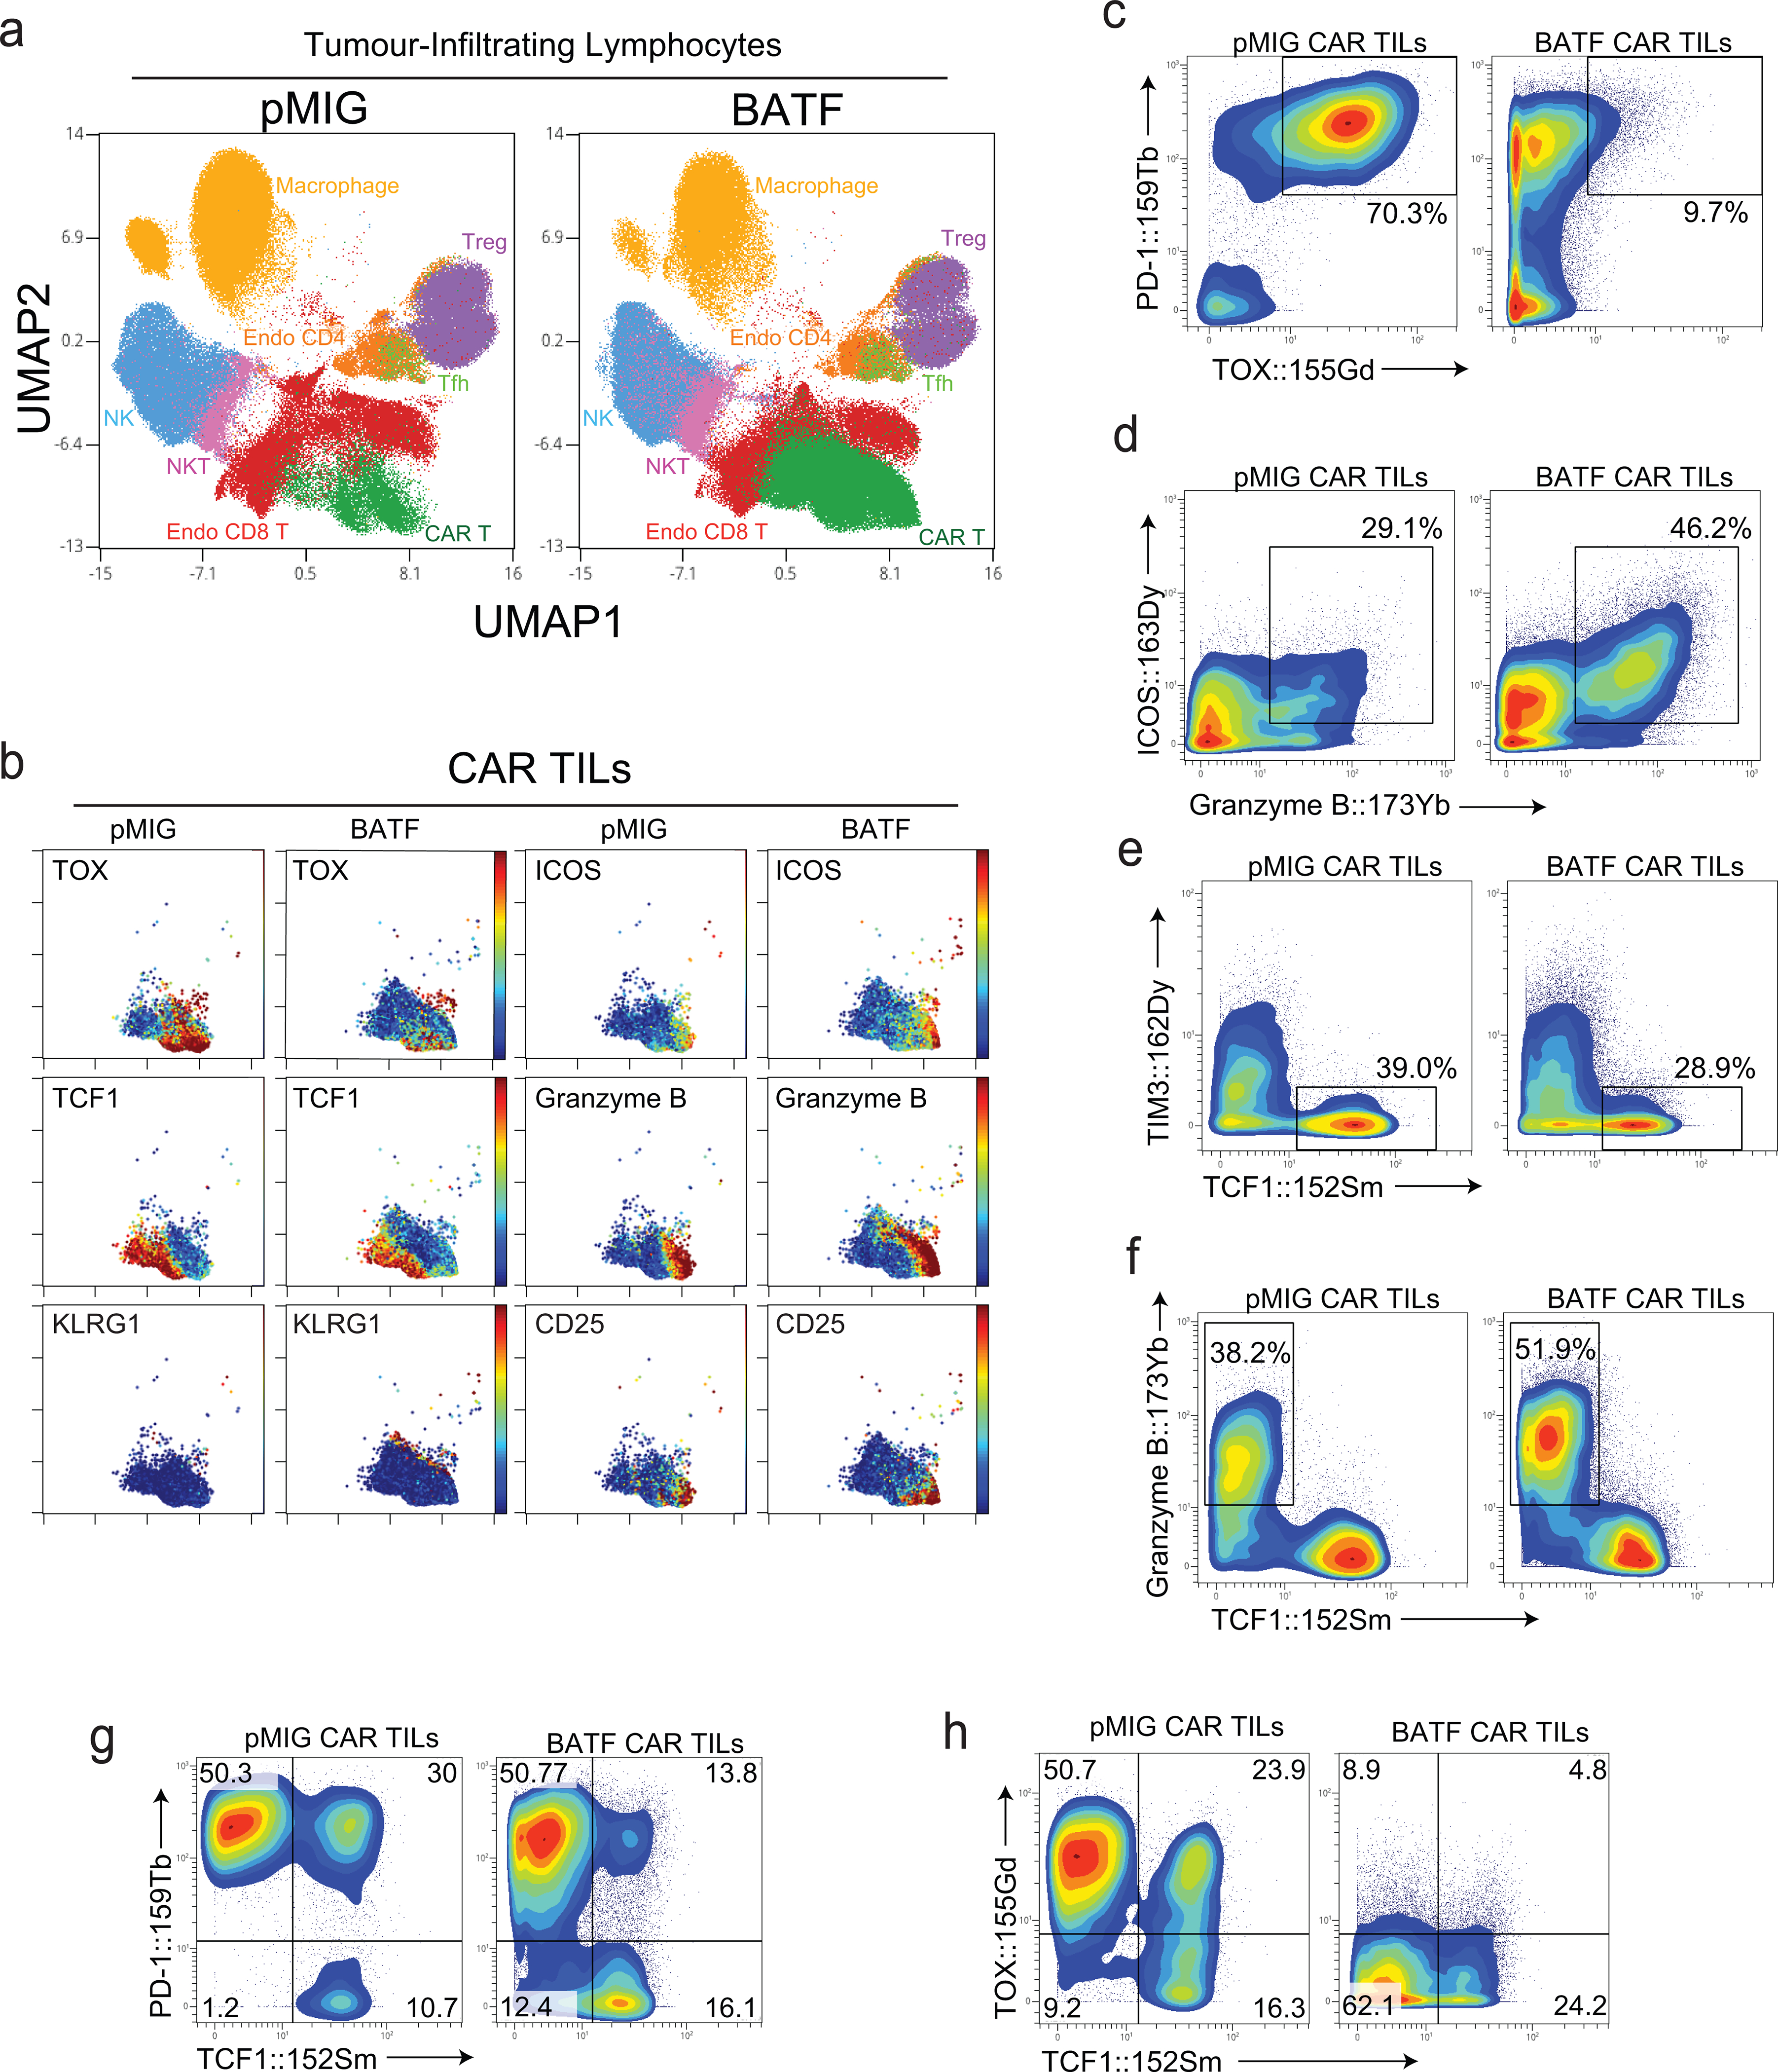
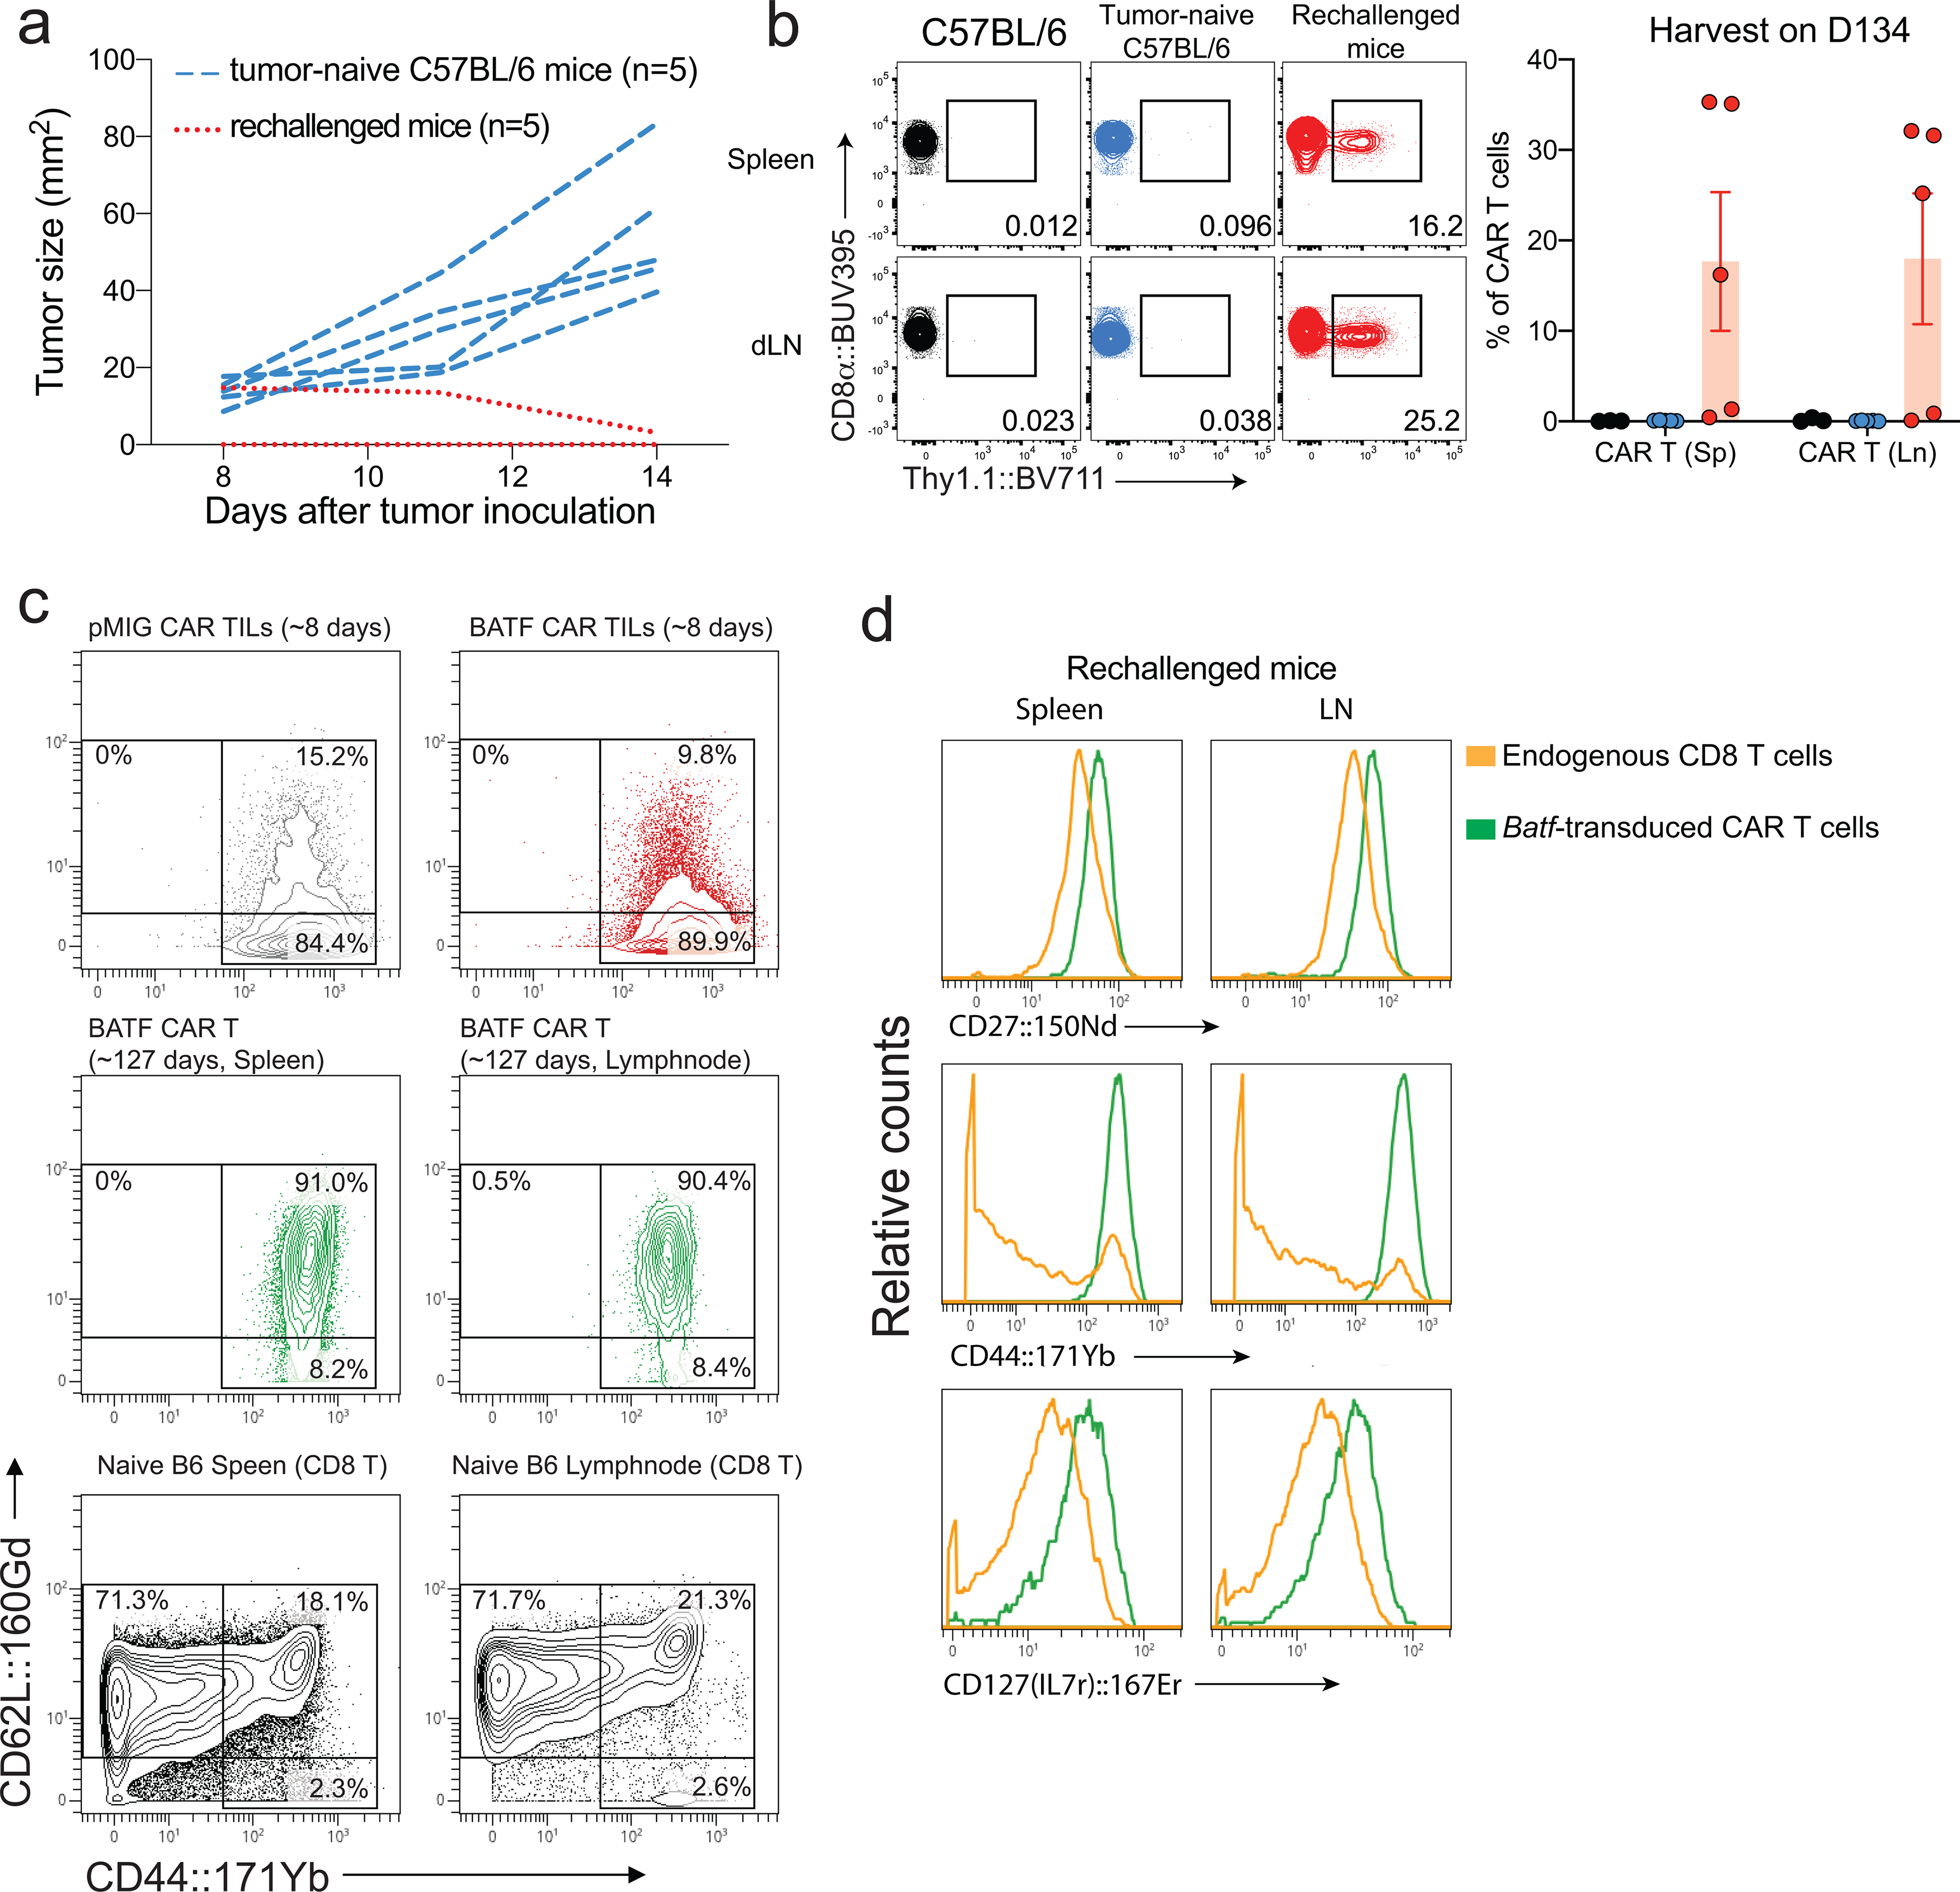
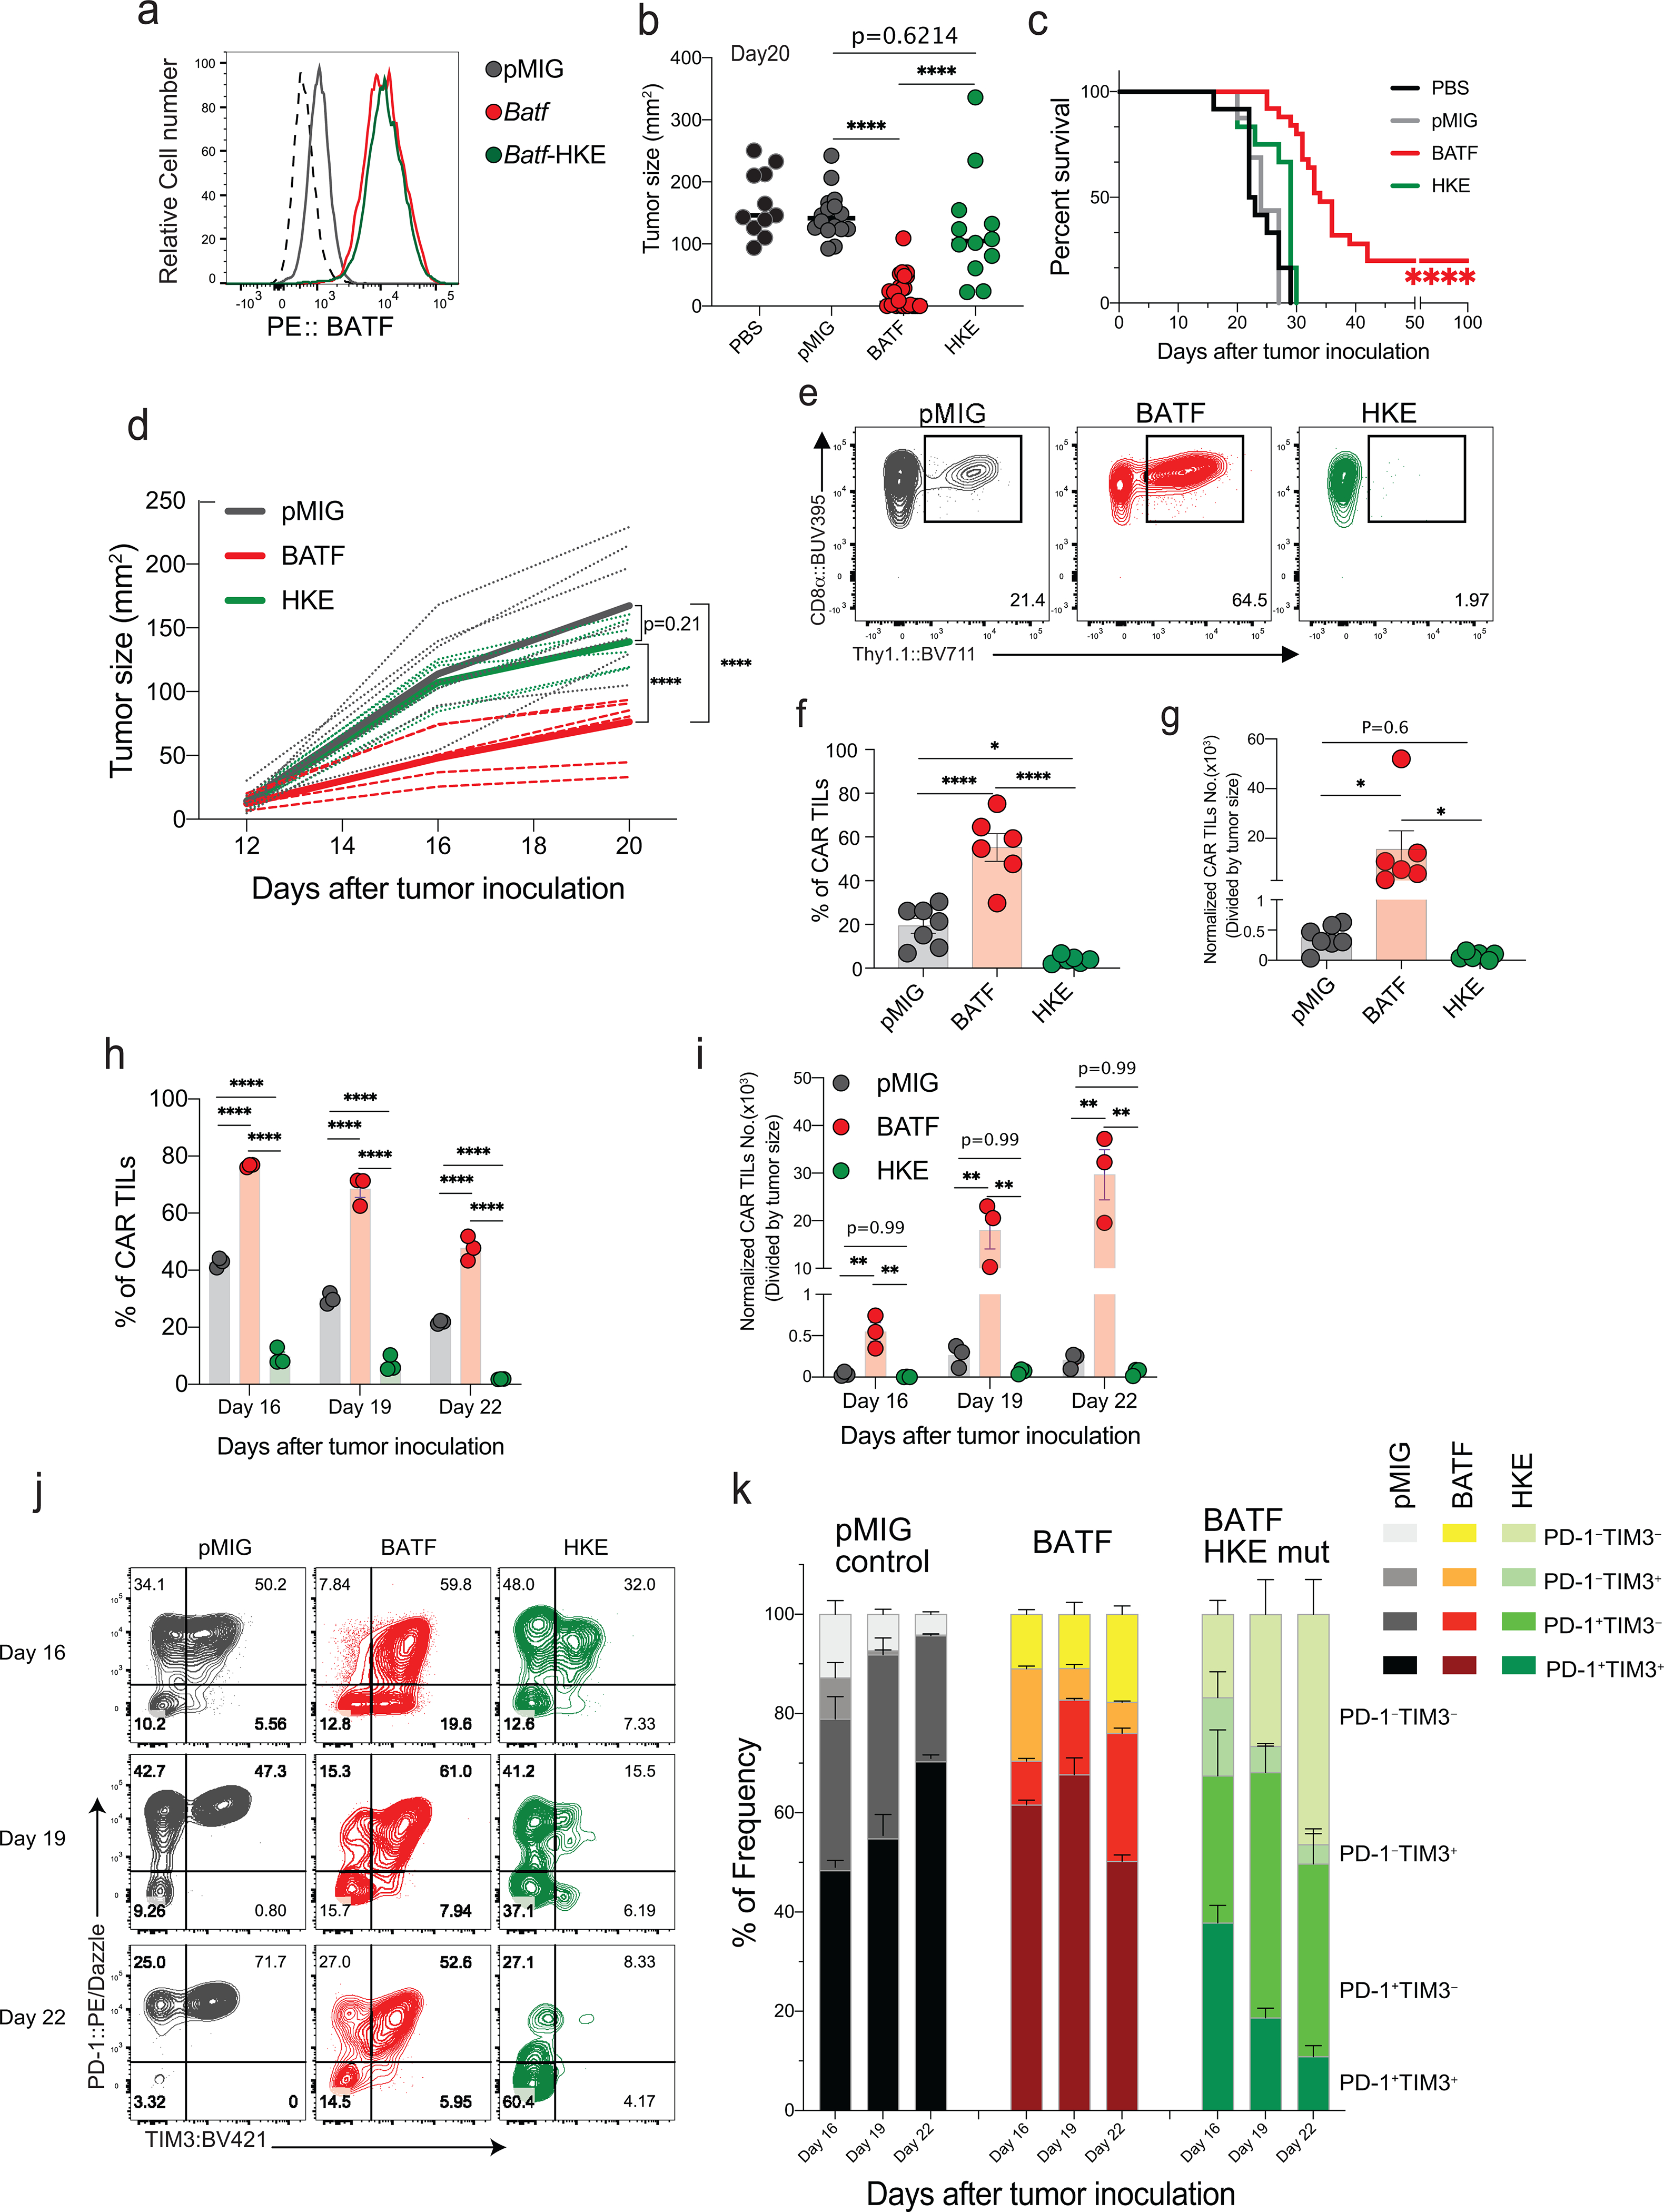
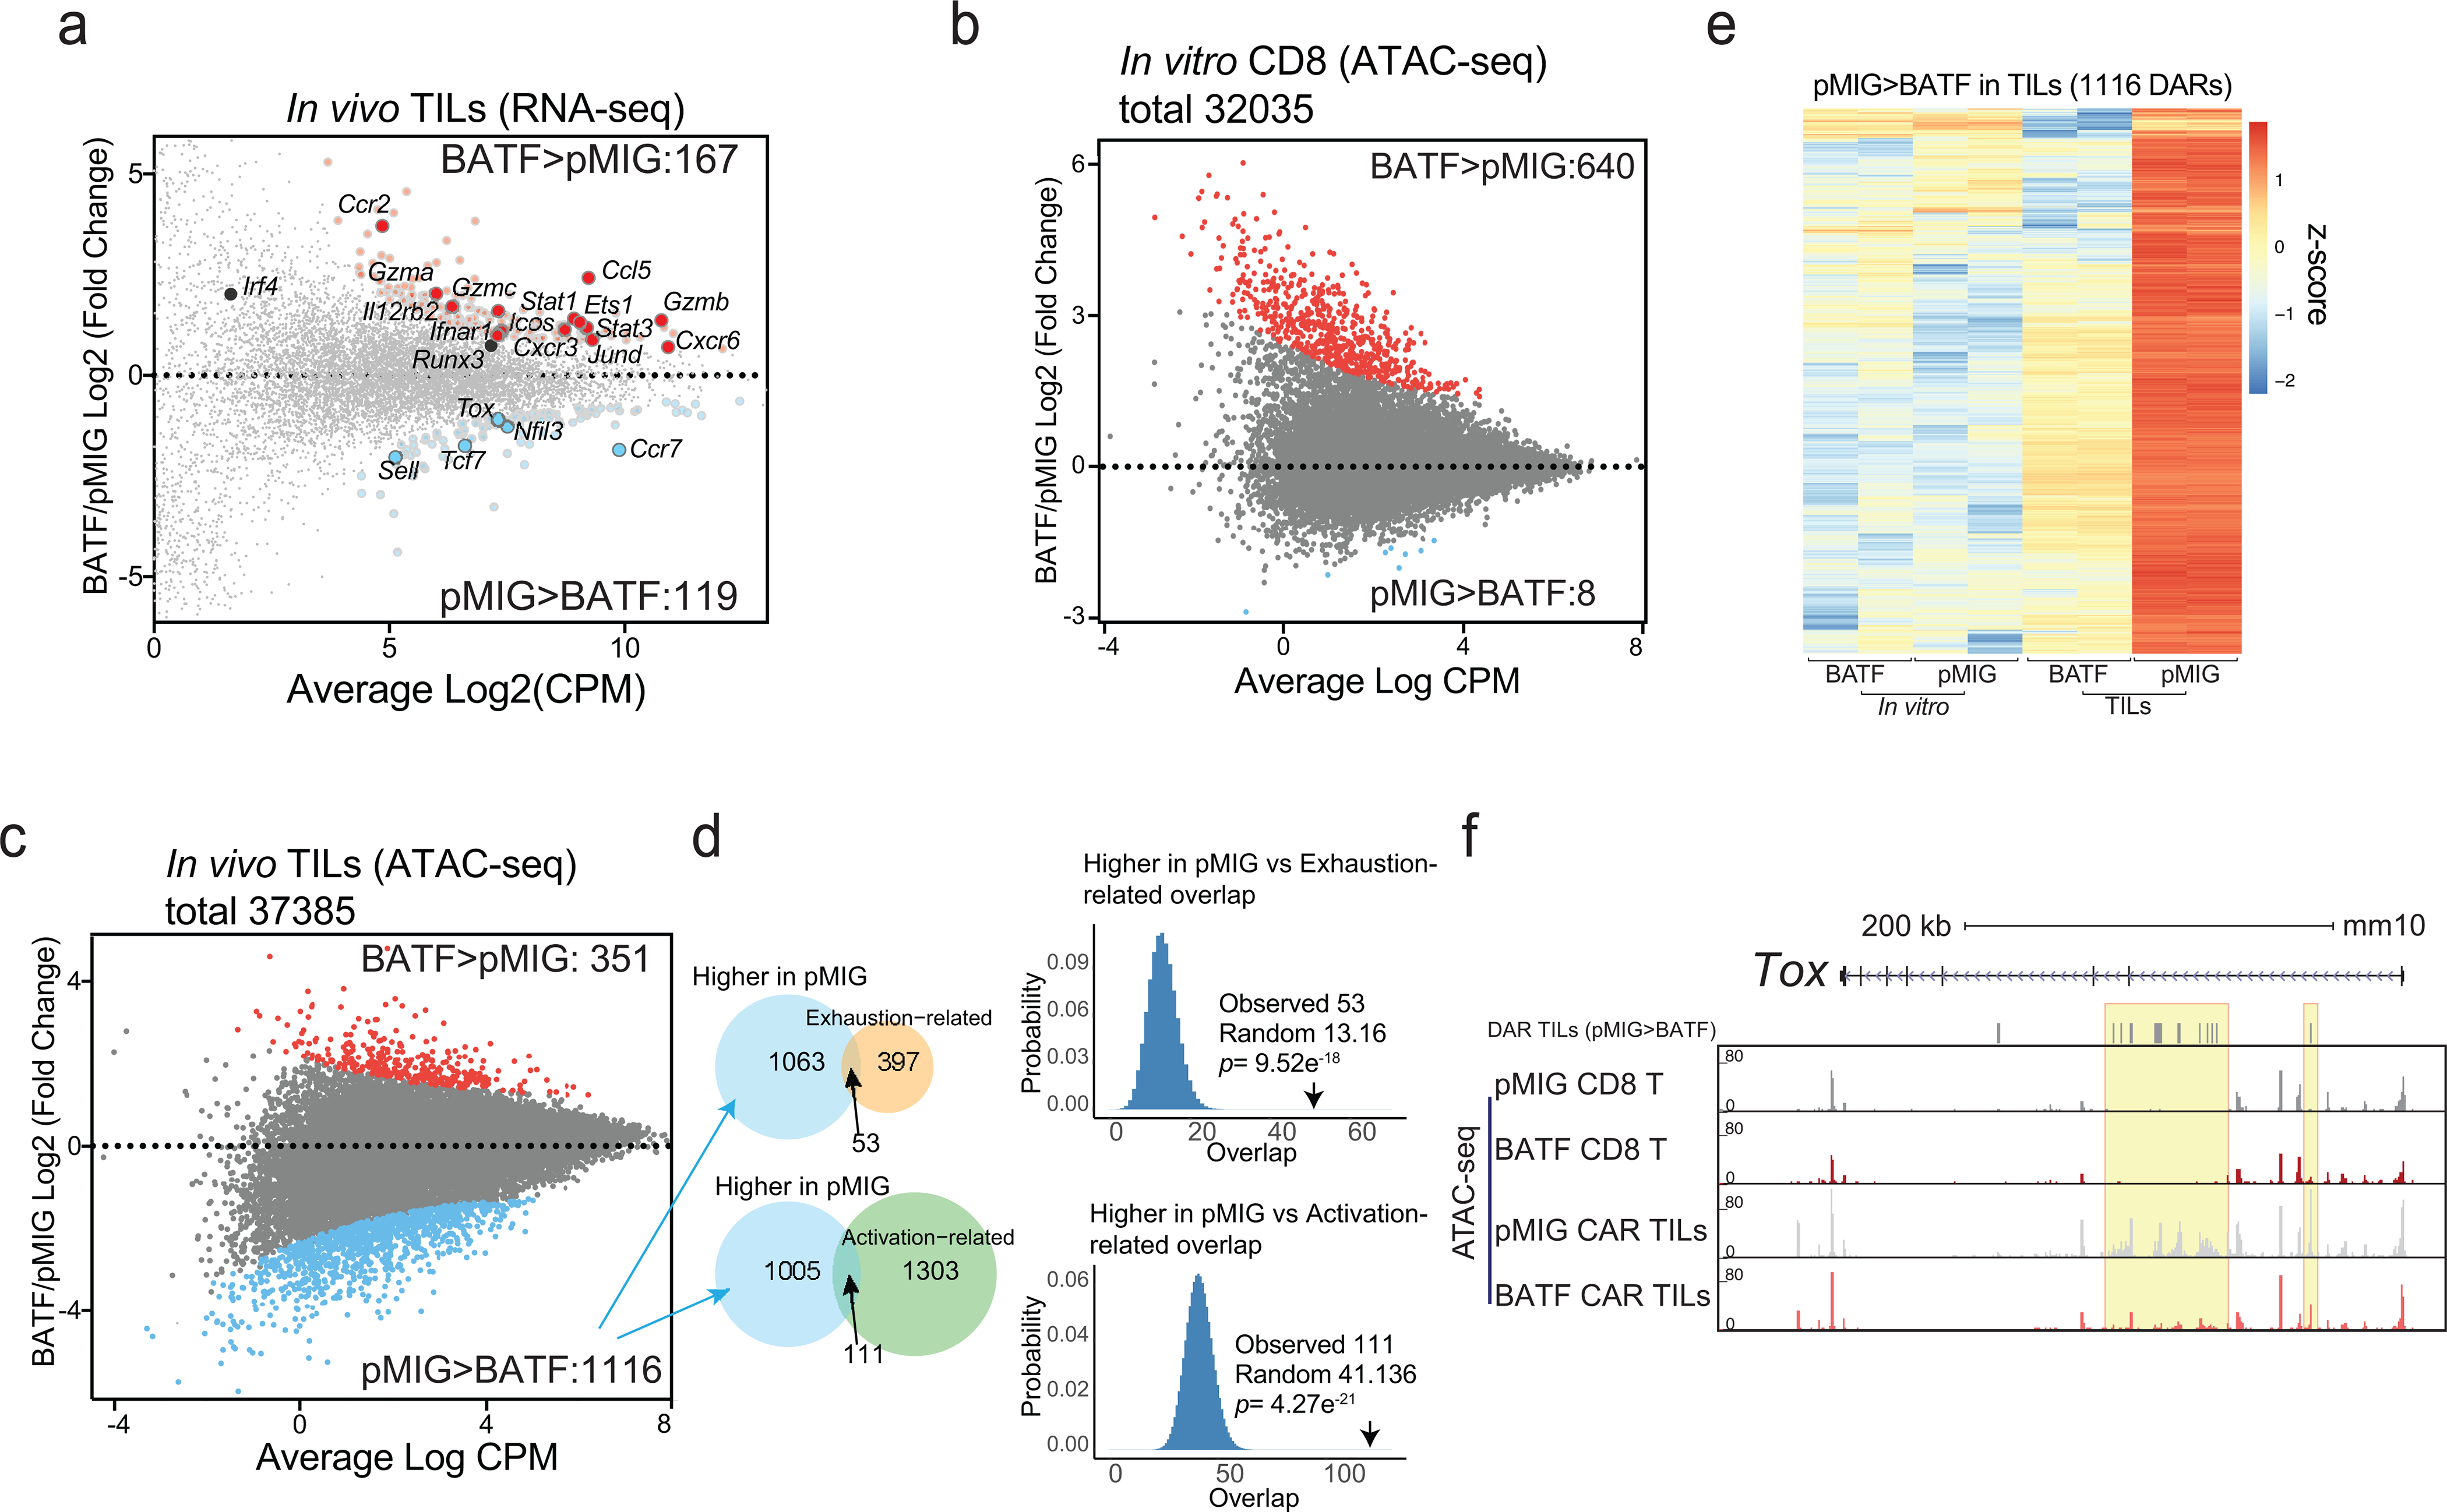
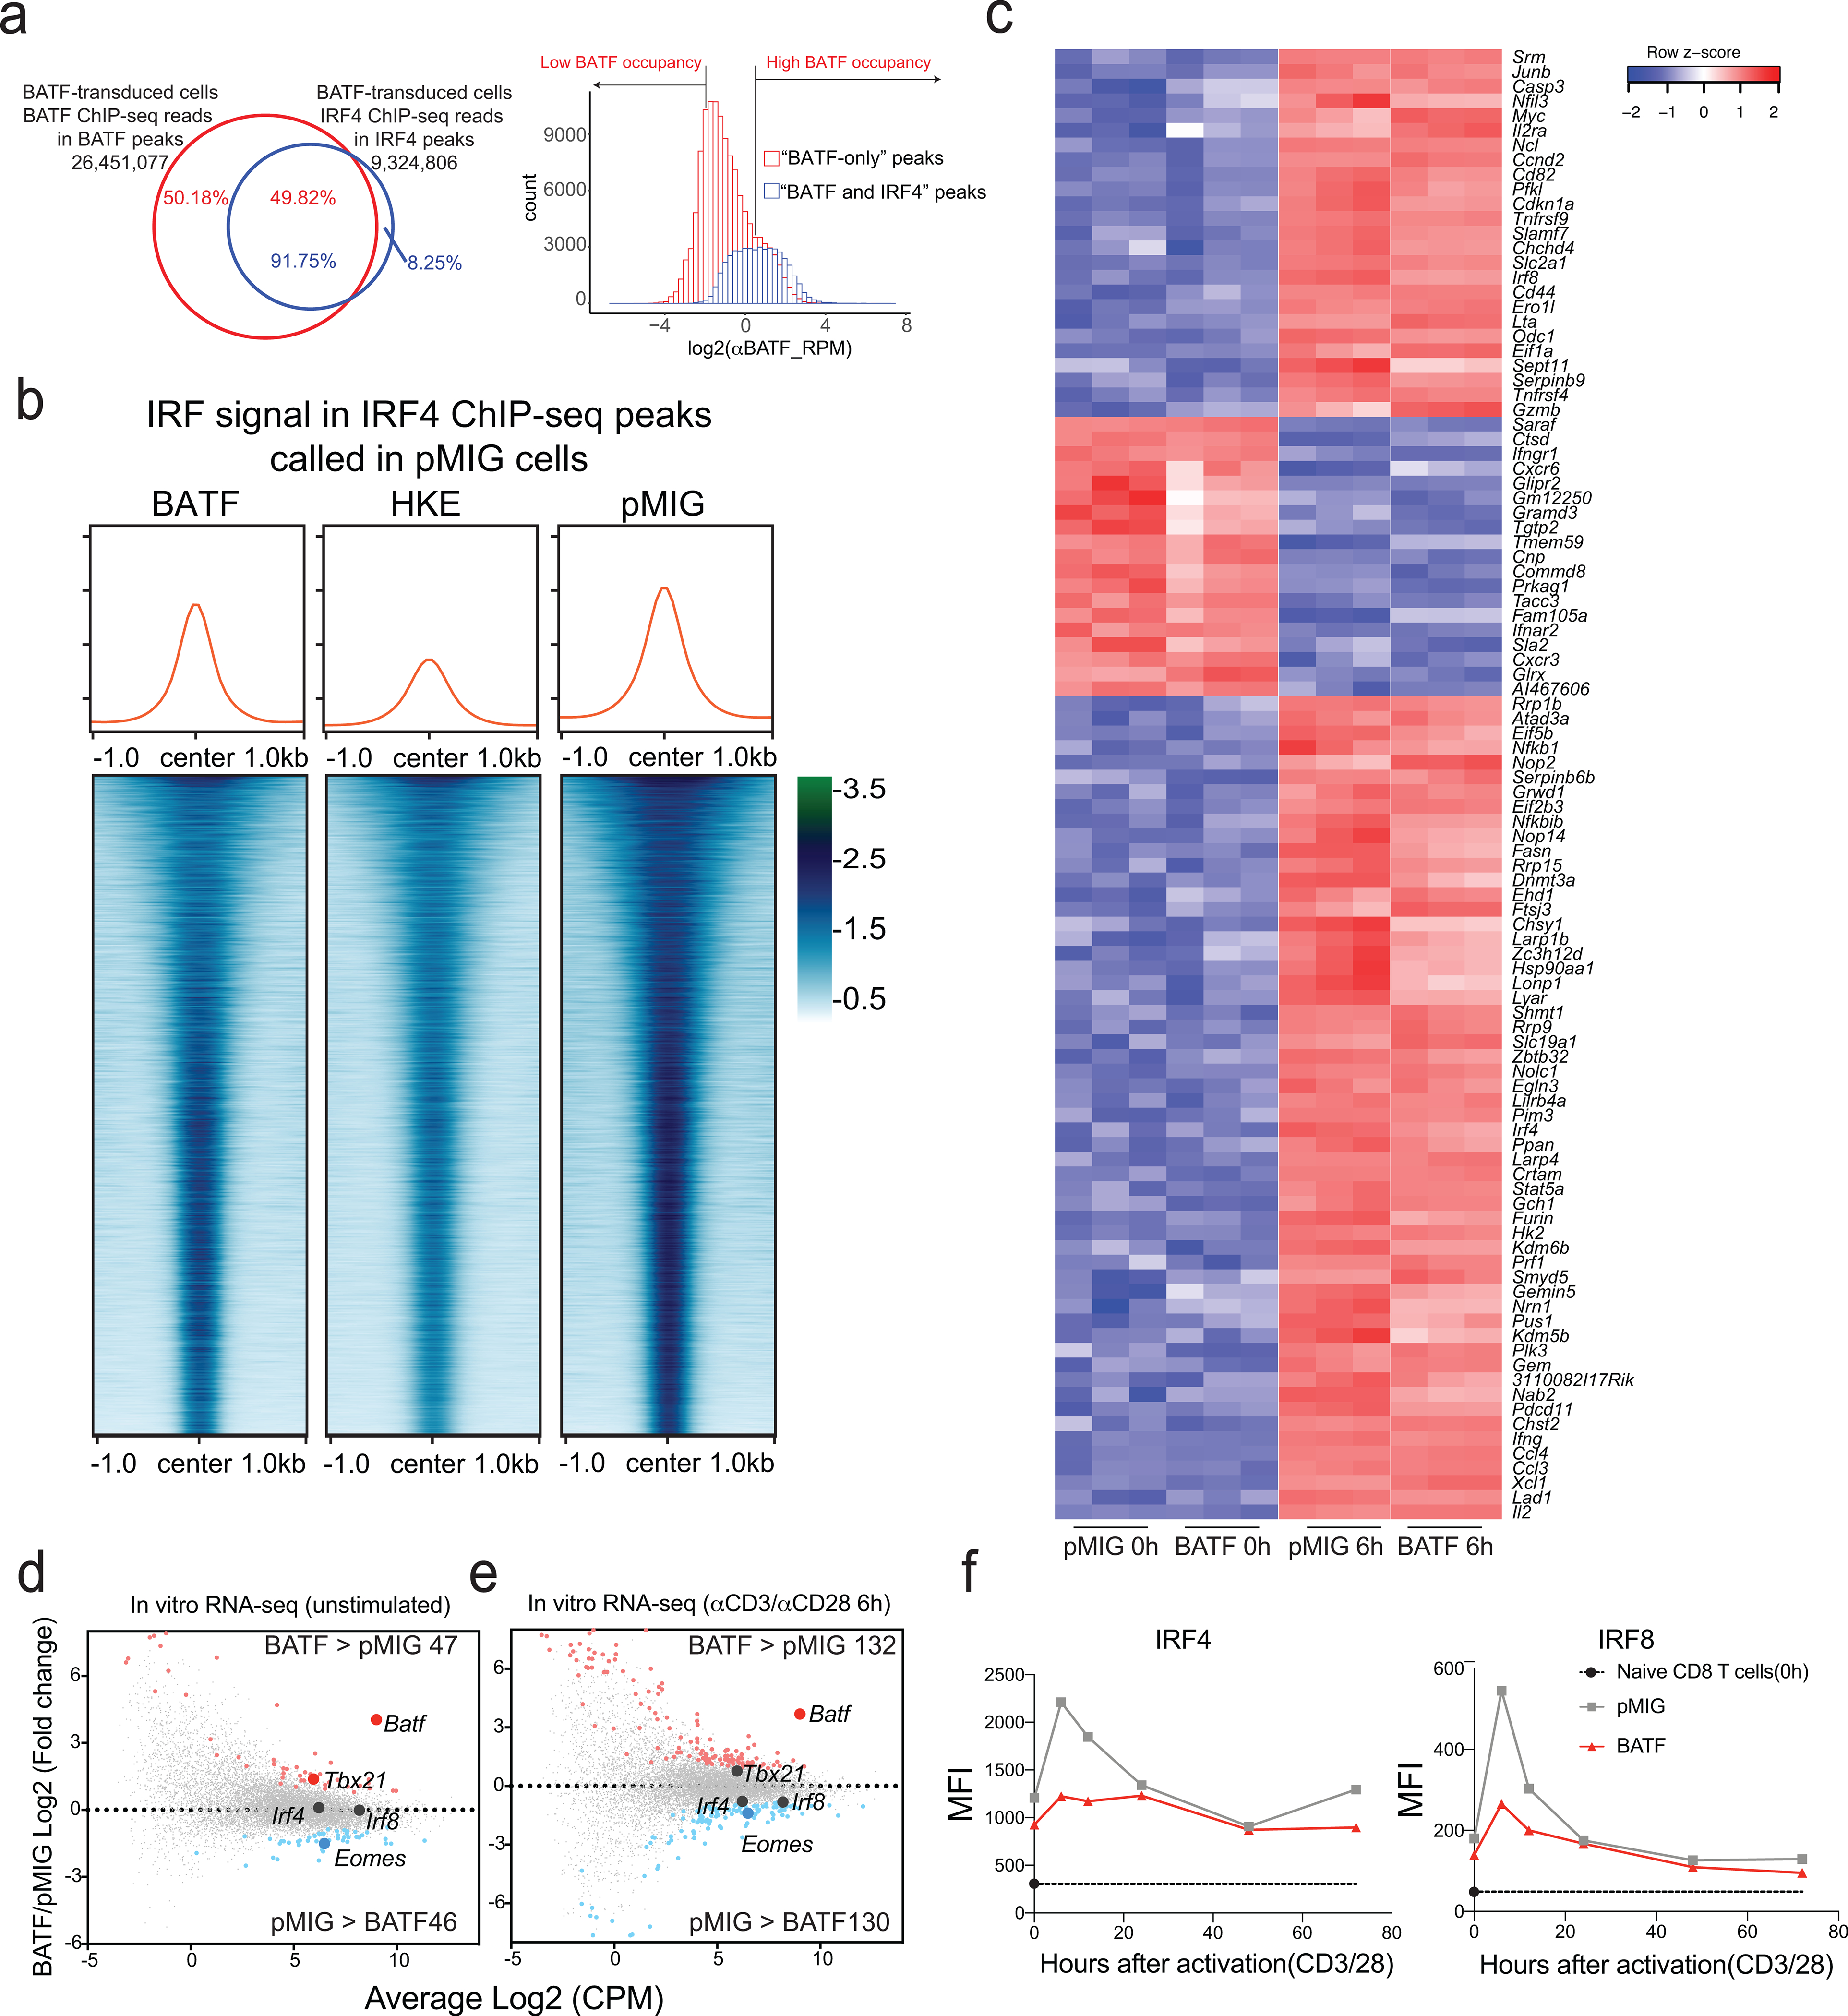
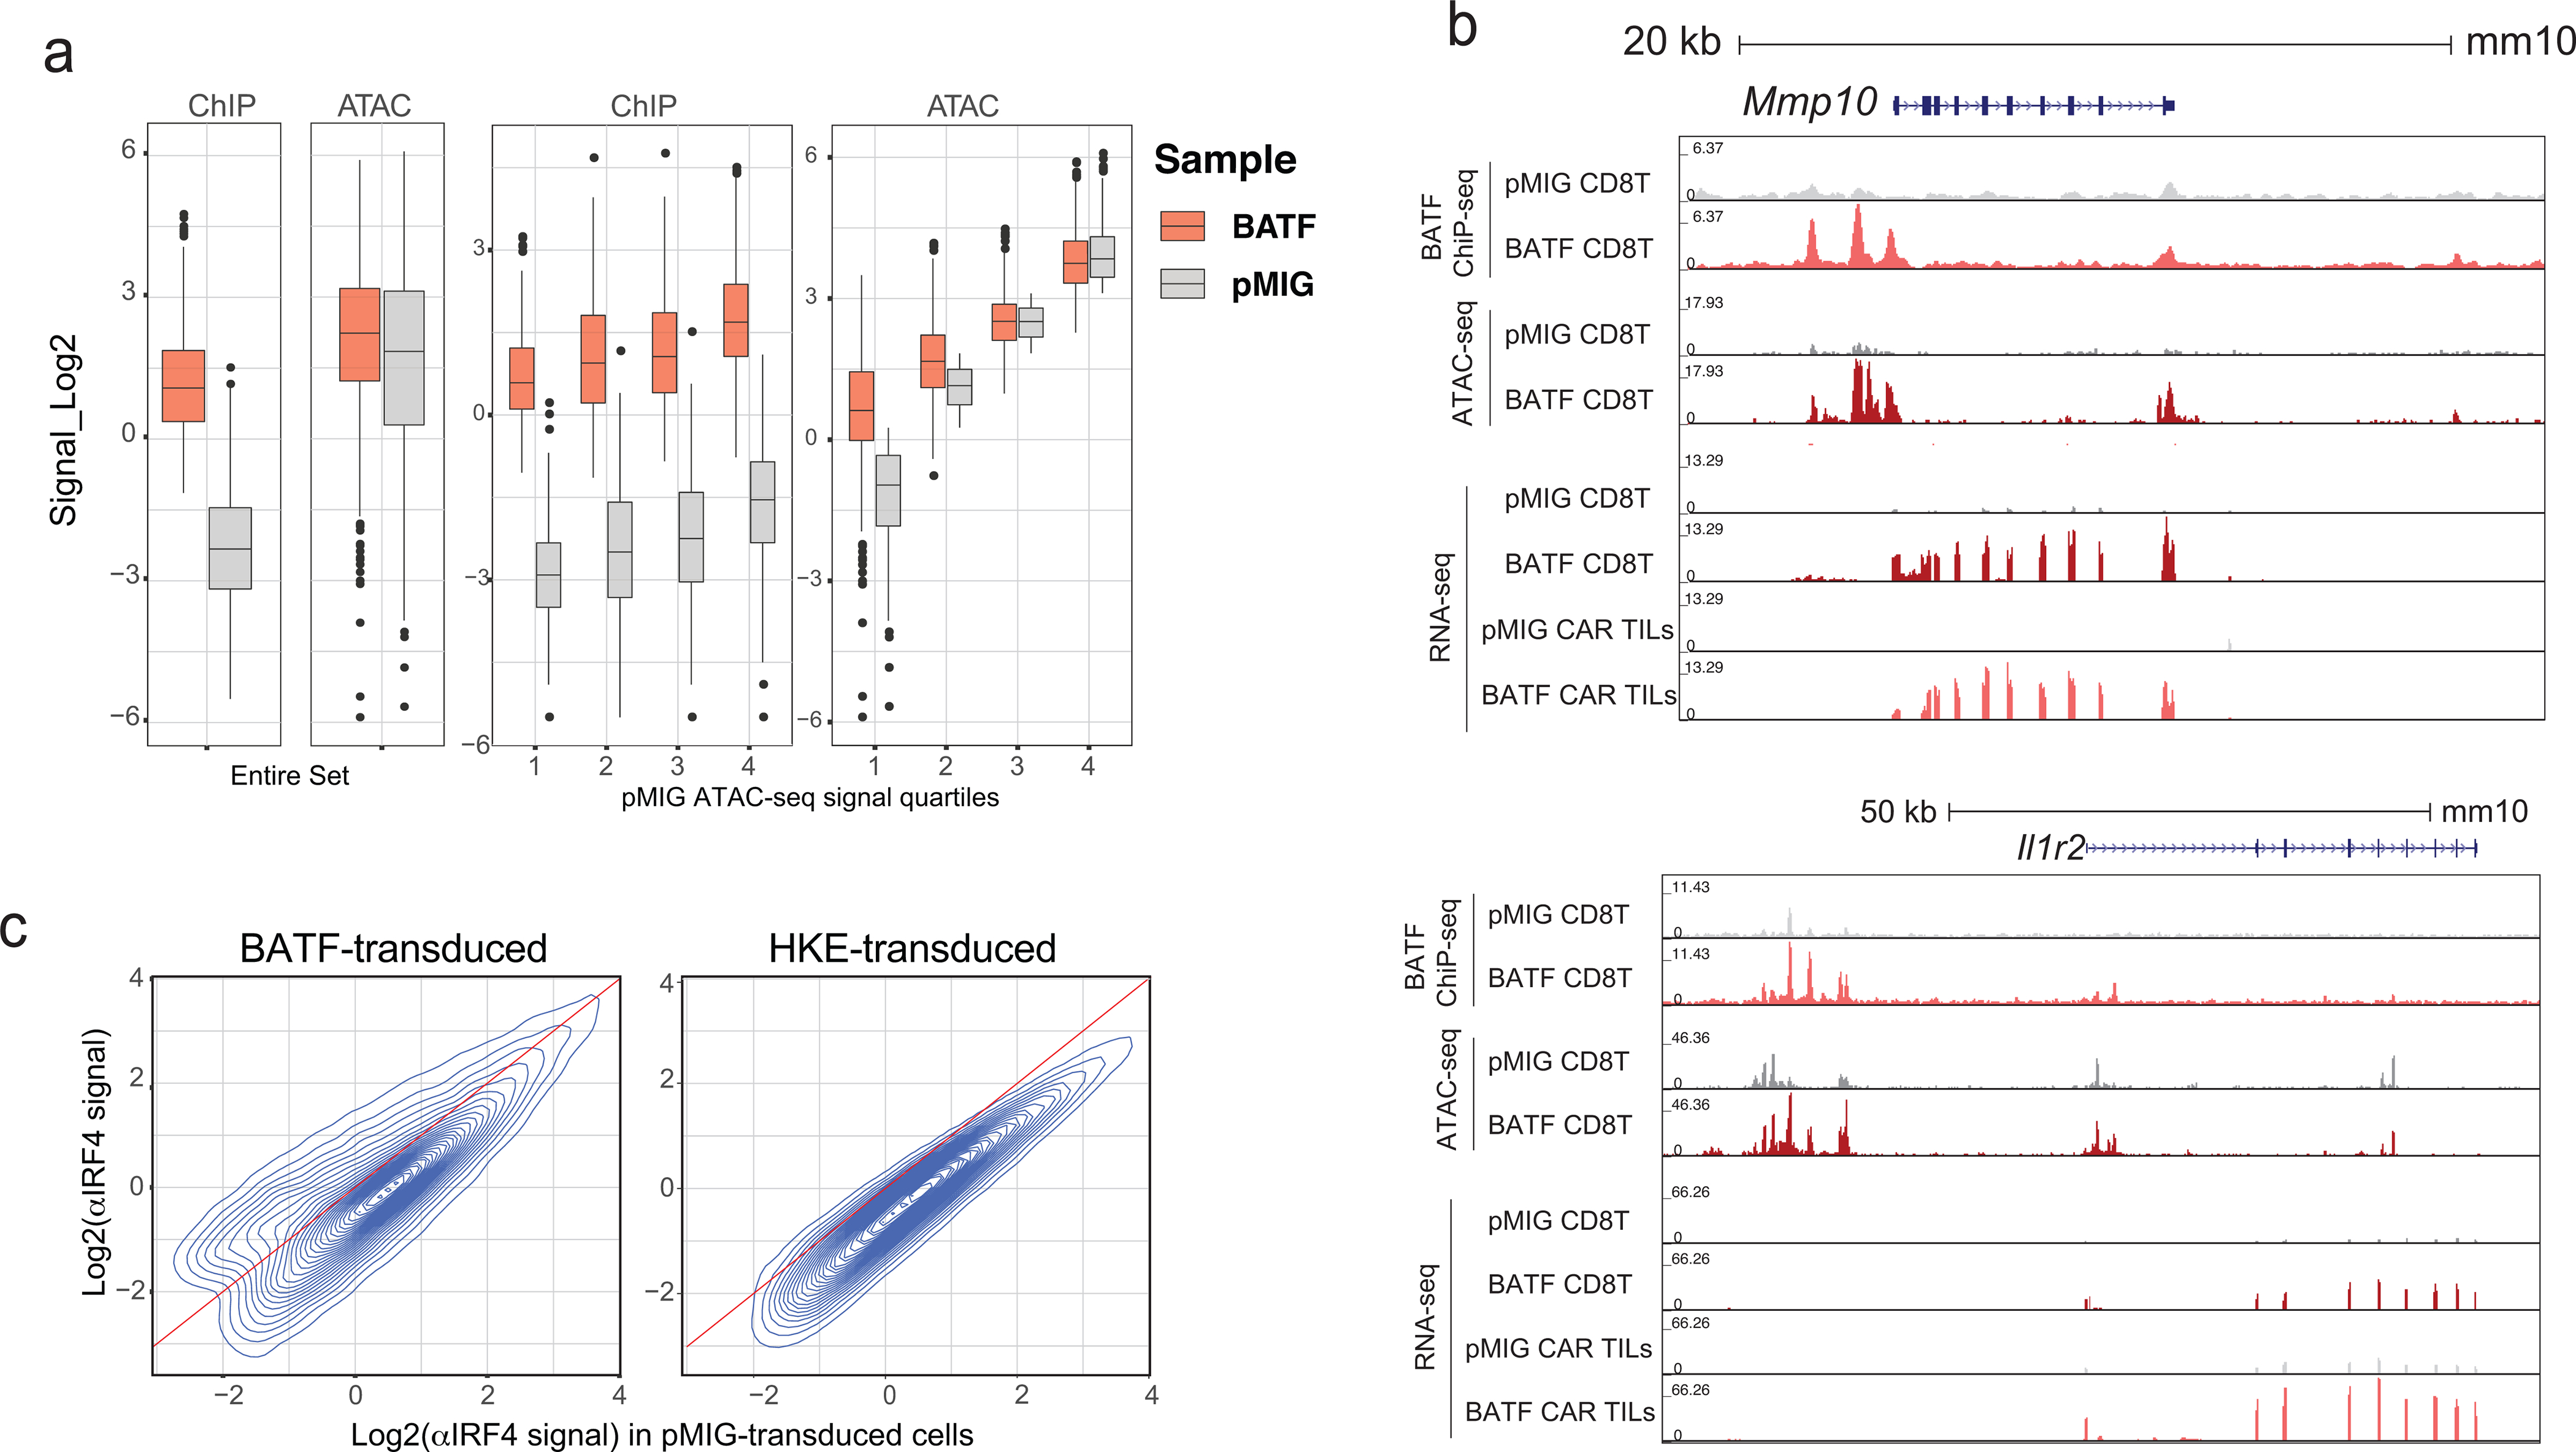
The transcription factors nuclear factor of activated T cells (NFAT) and activator protein 1 (AP-1; Fos-Jun) cooperate to promote the effector functions of T cells, but NFAT in the absence of AP-1 imposes a negative feedback program of T cell hyporesponsiveness (exhaustion). Here, we show that basic leucine zipper ATF-like transcription factor (BATF) and interferon regulatory factor 4 (IRF4) cooperate to counter T cell exhaustion in mouse tumor models. Overexpression of BATF in CD8+ T cells expressing a chimeric antigen receptor (CAR) promoted the survival and expansion of tumor-infiltrating CAR T cells, increased the production of effector cytokines, decreased the expression of inhibitory receptors and the exhaustion-associated transcription factor TOX and supported the generation of long-lived memory T cells that controlled tumor recurrence. These responses were dependent on BATF-IRF interaction, since cells expressing a BATF variant unable to interact with IRF4 did not survive in tumors and did not effectively delay tumor growth. BATF may improve the antitumor responses of CAR T cells by skewing their phenotypes and transcriptional profiles away from exhaustion and towards increased effector function.


Figures

Extended Data Fig. 1
Extended Data Fig. 1. Identification of bZIP transcription factors capable of increasing NFAT:AP-1 reporter activity
a, MA plots of basic region-leucine zipper (bZIP) transcription factor gene expression in TOX-depleted (TOX DKO, left) or NR4A-depleted (Nr4a TKO, right) CAR TILs,— which mount increased anti-tumor responses— relative to control CAR TILs. Differentially expressed genes (adjusted p-value < 0.1, log2 fold-change ≥ 0.5 or ≤ −0.5) are highlighted; selected genes are labeled. b, Basis of the experiment to identify bZIP transcription factors that activate an NFAT:AP-1 reporter through a positive feedback loop, either directly by binding adjacent to NFAT on the NFAT:AP-1 composite site or indirectly by increasing the expression or activity of NFAT or AP-1. Mouse CD8+ T cells were transduced with retroviral expression vectors encoding a Thy1.1 reporter, separated by a P2A sequence from a co-expressed bZIP transcription factor, and under the control of six tandem NFAT:AP1 sites upstream of a minimal IL-2 promoter. Transcription factors for testing were chosen based on the data analysis in a. c, Gating strategy for the experiments. d, g, Histograms of Thy1.1 expression after CD8+ T cell transduction. No Thy1.1, transduced with empty retrovirus without Thy1.1 or bZIP transcription factor; No bZIP, transduced with retroviral vector encoding Thy1.1 but no bZIP transcription factor, a condition that assesses the background induction of Thy1.1 by endogenous NFAT and AP-1; Jun, Maff, Batf, and Batf3 (d) and JunD, Fosl2, and Nfil3 (g), transduced with vector encoding the indicated bZIP transcription factor. e, h, Percentage of Thy1.1+ cells in three replicate experiments. f, i, MFI of Thy1.1 expression in these experiments. j, k, Results for each sample, normalized to those of the No bZIP control from the same experiment. Each circle in e, f, h, I, j and k represents one mouse. Data are representative of (c, d, g) or obtained from (e, f, h-k) three biological replicate experiments. Data in e and h were analyzed by one-way ANOVA. *p≤0.05; **P≤0.01; ***P≤0.001; ****P≤0.0001.
Extended Data Fig. 2
Extended Data Fig. 2. Phenotypic analyses of pMIG- and BATF-transduced CAR TILs
a, Retroviral transduction efficiencies for CAR and MSCV-IRES-eGFP retroviral expression plasmids, assessed as expression of Thy1.1 and GFP respectively. FMO, fluorescence-minus-one control. b, Histograms showing BATF (left), JUN (middle), and MAFF (right) expression after retroviral transduction of CD8+ T cells with the corresponding retroviral expression plasmids or pMIG empty-vector control, assessed by flow cytometry with antibodies to the endogenous proteins. c, Histograms showing CAR expression (assessed by staining for the Myc tag) in pMIG- (grey), BATF- (red), JUN- (sky blue) and MAFF- (orange) transduced CAR T cells. d-e, Replicate tumor growth experiments using B16F0-hCD19 (d) and MC38-hCD19 (e) tumor cells. 1×10⁵ tumor cells were injected subcutaneously into the left flank of C57BL/6 mice at day 0 (D0) in 100 μl phosphate-buffered saline (PBS); 3×10⁶ control pMIG-, JUN-, MAFF-, or BATF-transduced CAR T cells were adoptively transferred by retro-orbital injection at day 7. Tumor sizes were measured by caliper. f, Histograms showing expression of the indicated markers by each group of CAR TILs, assessed by flow cytometry. g, Left panels, Histograms showing expression of CD44, CD62L, CD127 and KLRG1. Middle panels, Overlaid contour plots of CD44 and CD62L (top) and CD127 and KLRG1 (bottom) in pMIG- (grey) and BATF- (red) transduced CAR TILs. Right panel, expression of the markers quantitated as MFI. h, Left panels, Histograms showing expression of TNF, IFNγ, granzyme B, and CD107a after resting in T cell media or after stimulation with PMA and ionomycin for 4 h. Right panel, expression of the markers quantitated as MFI. i, pMIG (n=6) and BATF (n=6). Quantitation of TCF1+ and TCF1 CAR TILs. Each circle in g, h, and i represents one mouse, and the bar graphs represent the mean ± standard error of mean (s.e.m.). Data in d-i were obtained from two independent biological experiments. Data in g, h, and i were analyzed by two-tailed unpaired Student’s t-test.
Extended Data Fig. 3
Extended Data Fig. 3. Mass cytometric analyses.
a, Gating strategy for mass cytometry of tumor-infiltrating lymphocytes (TILs). b, UMAP plots of data from TILs of tumour-bearing mice, showing expression of CD8α (top) as a marker for all CD8+ T cells (including endogenous T cells) and Thy1.1 (bottom) as a marker for adoptively transferred pMIG- or BATF-transduced CAR T cells. c, Mass cytometric analysis of CD8+ T cells from draining lymph nodes (left) and spleens (right) of mice in the tumor rechallenge experiments (Fig. 3). Endogenous CD8+ T cells and BATF-transduced CAR T cells are clearly distinguishable in the UMAP views. d, Expression of selected surface markers on lymphocytes obtained from three groups of age-matched C57BL/6 mice: inguinal lymph nodes of completely unmanipulated, non-tumor-bearing mice (left panels); draining (inguinal) lymph nodes of mice inoculated with tumors 14 days previously (middle panels), and draining (inguinal) lymph nodes of rechallenged mice. The UMAP plots show that each marker is expressed by all or by a large fraction of lymph node CAR T cells of the rechallenged mice. Each group of samples in c and d was pooled from 5 mice. The data are representative of two independent biological experiments. e, Replicate of the experiment in Fig. 3e. 1×10⁵ B16F0-hCD19 tumor cells were injected subcutaneously into the right flank of age-matched C57BL/6 mice (n=3) to yield the “tumor-naïve” control group, or into the right flank of the surviving tumor-free mice (n=3) from the experiment of Extended Data Fig. 2d. In this replicate B16-hCD19 rechallenge experiment, CAR T cells accounted for ~10% of CD8+ T cells in spleen and LN of the mice, and exhibited a memory phenotype (CD44high, CD62Lhigh, TCF1high) as in the first experiment.
Extended Data Fig. 4
Extended Data Fig. 4. BATF overexpression improves effector function in human CAR T cells
a, Histograms showing expression of human BATF (hBATF, left panel) and human CAR (hCAR [stained by Goat Anti-Armenian Hamster IgG (H+L)], right panel) in the corresponding lentivirally transduced human CD8+ T cells. FMO, fluorescence-minus-one control; TIG, control cells transduced with the empty vector. b, Left, Histograms showing CellTrace Violet (CTV) dilution in lentivirally transduced human CD8+ CAR T cells. Right, Proliferation index calculated as (Day 0 CTV MFI) / (Day 4 CTV MFI). c, Histograms showing expression of the indicated cytokines after resting in X-Vivo media or after stimulation with PMA and ionomycin for 4 h. d-e, Human CAR T cells were labeled with CellTrace Violet and co-cultured with NALM6 cells for 5 h. d, Gating strategy for in vitro cytotoxicity assay of control (TIG) or hBATF-transduced human CAR T cells. e, Histograms showing ratio between target cells (NALM6) and effector cells (human CAR T cells). Percent cytotoxicity was calculated as (1 − (R5/R0)) × 100, where R5 = (target cells as % of total at 5 h) / (effector cells as % of total at 5h), R0 = (target cells as % of total at 0 h) / (effector cells as % of total at 0 h). Each dot in b-e represents an individual donor. Data were obtained from four biological experiments and analyzed by one-tailed unpaired Student’s t-test
Extended Data Fig. 5
Extended Data Fig. 5. Tumor growth and TIL expansion/survival in mice receiving BATF-transduced, BATF-HKE-transduced, or BATF-deficient CD8+ T cells
a, Tumor growth curves for the individual mice from Fig. 4b–c (PBS (n=12), pMIG (n=16), BATF (n=25) and HKE (n=12)). b-f, 1×10⁵ B16F0-hCD19 tumor cells were subcutaneously injected into the left flank of C57BL/6 mice at day 0 (D0). 100 μl of PBS, without cells or containing 1.5×10⁶ CAR T cells transduced with retroviral expression plasmids encoding either pMIG control, BATF, or BATF HKE-mutant, were adoptively transferred into C57BL/6 recipient mice by retro-orbital injection on day 12. TILs were isolated on days 13, 16, 19, and 22. c, Expression of CAR T cell marker Thy1.1 on CD8+ TILs on the indicated days. d-f, Frequencies and MFIs of the indicated PD-1- and TIM3-expressing populations from Fig. 4j,k. g-m, 1×10⁵ B16F0-hCD19 tumor cells were injected subcutaneously into the left flank of C57BL/6 mice at day 0 (D0). 1.5×10⁶ wild-type (WT, n=4) or BATF-deficient (BATF KO, n=4) CAR T cells were adoptively transferred at day 12. Tumor-infiltrating lymphocytes were isolated at day 20. h, Tumor growth curves for individual mice (dashed lines) and average (bold lines) of all tumor growth curves in a group. i-k, Contour plots of Thy1.1 expression in CD8+ TILs (i), percentages of Thy1.1+ CAR TILs (j) and numbers of Thy1.1+ CAR TILs normalized to tumor size (k) in tumor-bearing BATF WT or BATF KO mice. l, Contour plots of PD-1 and TIM3 expression (left) and percentage of PD-1hiTIM3+ cells (right) in WT or BATF KO CAR TILs. m, Contour plots of PD-1 and TOX expression (top left), TIM3 and TCF1 expression (bottom left), and percentages of the indicated populations (right) in WT or BATF KO CAR TILs. Data in a were obtained from three independent experiments. Each circle in d-f and j-m represents one mouse, and the bar graphs represent the mean ± standard error of mean (s.e.m.). Data in d-m are representative of two independent experiments. Data in j-m were analyzed by two-tailed unpaired Student’s t-test.
Extended Data Fig. 6
Extended Data Fig. 6. Tumor growth rates, survival curves, and phenotypic analysis of CAR TILs
a-e, 2.5×10⁵ B16F10-OVA tumor cells were injected subcutaneously into the left flank of C57BL/6 mice at day 0 (D0). 100 μl of PBS (n=10), without cells or containing 3×10⁶ OT-I T cells transduced with retroviral expression plasmids encoding pMIG control (n=10), BATF(n=10), IRF4(n=10), or BATF+IRF4(n=10), were adoptively transferred by retro-orbital injection at day 7. b, Averaged tumor growth curves for all mice in the indicated groups. c, Tumor sizes measured in individual mice at day 18. d, Mouse survival curves. e, Tumor growth curves in individual mice. f-m, 2.5×10⁵ B16F10-OVA tumor cells were injected subcutaneously into the left flank of C57BL/6 mice at day 0. 1×10⁶ pMIG control (n=4)-, BATF(n=5)-, IRF4(n=5)-, or BATF+IRF4(n=5)-transduced OT-I cells were adoptively transferred at day 12. TILs were isolated at day 20. g, Gating strategy for flow cytometric analysis of OT-I TILs. h, Averaged tumor growth curves for all mice in the indicated groups. i, Left, Contour plots of CD8α and CD45.1 expression in OT-I TILs. Middle, Percentage of OT-I TILs in CD8+ TILs. Right, Number of OT-I TILs normalized to tumor size. j, Left, Contour plots of PD-1 and TIM3 expression in each group of OT-I TILs. Right, Percentages of the indicated PD-1- and TIM3-expressing cell populations. k, Left, Contour plots of PD-1 and TOX expression in the indicated OT-I TILs. Right, Percentage of PD-1+TOX+ cells in OT-I TILs. l, m, Left, Contour plots of expression of granzyme B (l) and the indicated cytokines (m) under resting conditions or after PMA/ionomycin stimulation for 4 h. Right, Percentages of OT-I TILs expressing granzyme B (l) or the indicated cytokines (m) under resting conditions or after PMA/ionomycin stimulation for 4 h. Data obtained from two biological experiments n, Histograms showing JUN and BATF expression in the indicated groups of transduced OT-I T cells. o, Tumor growth curves for individual mice given pMIG control-, BATF-, JUN-, or BATF+JUN-transduced OT-1 cells (top) and averaged tumor growth curves for all mice in each group (bottom). Experimental scheme as in a. Each circle in i, j, k, l, and m represents one mouse, and the bar graphs represent the mean ± standard error of mean (s.e.m.). Data were obtained from two independent biological experiments. Data in h, j, l, and m were analyzed by two-way ANOVA test; data from i and k, by one-way ANOVA test. *p≤0.05; **p≤0.01; ***p≤0.001; ****p≤0.0001.
Extended Data Fig. 7
Extended Data Fig. 7. Differentially accessible regions in BATF compared to pMIG-transduced CAR TILs
a, Left, Venn diagrams showing the overlap of the 351 regions more accessible in BATF- versus pMIG-transduced TILs (Fig. 5c) with the exhaustion-related (top) or activation-related (bottom) regions from Mognol et al. Right, Histograms illustrate the significance calculation by one-tailed Fisher’s exact test. b, Genomic annotation of the commonly and differentially accessible regions in CAR TILs. c, Enrichment for transcription factor binding motifs in regions differentially accessible in BATF CAR TILs. d, Heatmap of ATAC-seq signal (z-score) from BATF- and pMIG-transduced CD8+ T cells or CAR TILs, in the 640 regions more accessible in BATF-transduced compared to pMIG-transduced CD8+ T cells (left; see Fig. 5b) and in the 351 regions more accessible in BATF-transduced compared to pMIG CAR TILs (right; see Fig. 5c). Each column represents a biological replicate. Data obtained from two biological experiments
Extended Data Fig. 8
Extended Data Fig. 8. BATF and IRF4 binding and gene expression changes in pMIG-, HKE-, and BATF-transduced cells
a, Contour plot relating BATF ChIP-seq signals (log2(CPM)) in BATF-transduced CD8+ T cells to signals from the corresponding peaks in pMIG-transduced cells. b, Left, Distribution of BATF ChIP-seq reads in peaks in BATF-transduced cells (red) versus pMIG-transduced cells (black). Right, BATF ChIP-seq signal distribution in the “BATF and pMIG” peaks common to the two conditions (blue) and in “BATF-new” peaks observed only in BATF-transduced cells (red). The BATF-new peaks defined here are largely the same as the BATF-only peaks in Fig. 6a. c, Heatmaps of the IRF4 ChIP-seq signal in BATF-transduced, BATF-HKE-transduced, and pMIG-transduced cells, at IRF4 peak locations called in BATF-transduced cells. Curves at the top show the average signal taken over all peaks in the respective heatmap. d, Heatmaps of the BATF ChIP-seq signal in BATF-transduced, BATF-HKE-transduced and pMIG-transduced cells, at IRF4 peak locations called in pMIG-transduced cells. Curves at the top show the average signal taken over all peaks in the respective heatmap. e, Genome browser view of Ctla4 gene locus showing BATF and IRF4 ChIP-seq signals from pMIG-, BATF-, and HKE-transduced CD8+ T cells. f, Heatmap of normalized RNA-seq reads (as z-scores) under the indicated conditions, for the top 100 genes differentially expressed after αCD3/αCD28 stimulation of pMIG-transduced cells. Data obtained from two or three biological experiments.
Extended Data Fig. 9
Extended Data Fig. 9. Redistribution of IRF4 binding in BATF-overexpressing cells
a, The redistribution of the normalized IRF4 ChIP-seq signal in BATF-overexpressing cells is most evident when the median deviation of the y-coordinate (αIRF4 ChIP-seq signal in BATF-overexpressing cells) from the diagonal in Fig. 7c, left, is plotted as a function of position on the x-axis (αIRF4 ChIP-seq signal in control cells). The median for all peaks in each slice of 0.1 log2(CPM) units on the x-axis was determined. The inset replicates Fig. 7c, left, with a red rectangle indicating the slice between log2(CPM)=0.5 and log2(CPM)=0.6 on the x-axis. b, Spurious “αIRF4” ChIP-seq regions (as defined in Methods), incorporated into the graph of panel a. c, IRF4 does not redistribute in BATF-HKE-overexpressing cells. The median deviation of the y-coordinate (αIRF4 ChIP-seq signal in HKE-overexpressing cells) from the diagonal in Fig. 7c, right, is plotted as a function of position on the x-axis (αIRF4 ChIP-seq signal in control cells), as in a. d, IRF4 (left) and IRF8 (right) expression detected by flow cytometry (MFI) in pMIG- and HKE-transduced CD8+ T cells that had been expanded in vitro, at the indicated times after restimulation with αCD3/αCD28. The black symbol on the y-axis shows expression in naïve CD8+ T cells. Values for pMIG-transduced and naïve CD8+ T cells were obtained in the same experiments and are replotted from Fig. 6f. Overexpression of BATF-HKE did not attenuate IRF4 or IRF8 induction. e, Similar to Fig. 8a. Dot plot highlighting regions of the IRF4 ChIP-seq data from Fig. 7c where IRF4 binding increases (log2FC ≥ 0.75, red dots), does not change substantially (light grey dots), or decreases (log2FC ≤ −0.75, blue dots) in BATF-overexpressing relative to pMIG-transduced cells. Peaks with very low (log2(signal) < −1.25) or high (log2(signal) > 2.5) IRF4 binding in pMIG cells were judged unlikely to be informative and were omitted from the analysis. f, ATAC-seq signal (CPM) in peaks in each of the three categories defined in e. g, Similar to b, but downsampling the subsets to match the 2312 regions with increased IRF4 binding in BATF-transfected cells, for clearer visualization. Data were obtained from (a-c, e-g), or are representative of (d), two independent biological experiments.
Figure 1.
Figure 1.. Anti-tumor effects of CAR T cells ectopically expressing bZIP transcription factors
a-c,1×105 B16F0-human CD19 (B16F0-hCD19) tumor cells were injected subcutaneously into the left flank of C57BL/6 mice at day 0 (D0) in 100 μl phosphate-buffered saline (PBS, n=12); 3×10⁶ control pMIG(n=16)-, JUN(n=14)-, MAFF(n=7)- or BATF(n=24)-transduced CAR T cells were adoptively transferred by retro-orbital injection at day 7. a, b, Tumor growth rates (a) and tumour sizes (b) at day 20 for individual mice. c, Mouse survival curves up to 100 days after tumor inoculations. d-i. 1×10⁵ B16F0-hCD19 tumor cells were subcutaneously injected into the left flank of C57BL/6 mice at day 0 (D0); 1.5×10⁶ pMIG(n=5)- or BATF(n=5)-transduced CAR T cells were adoptively transferred at day 12. Tumor-infiltrating lymphocytes were isolated at day 20. d, Tumor growth curves for individual mice (dashed lines) and average of all tumor growth curves in a group (bold lines). e, Top, Contour plot of flow cytometry data for the CAR TILs. Bottom, Percentage of CAR TILs relative to total CD8+ TILs in the tumor (left); normalized number of CAR TILs per tumour, obtained by dividing the absolute number of CAR TILs by the tumor area (right). f, Median fluorescence intensity (MFI) of the entire flow plot for the indicated inhibitory receptors from each group of CAR TILs. g, Top, Representative contour plots of PD-1 and Tim3 expression on CAR TILs. Bottom, percentage of cells in each of the indicated quadrants (Q1=PD-1highTIM3low, Q2=PD-1highTIM3high, Q3=PD-1intTIM3high and Q4=PD-1intTIM3low). h, MFI for expression of indicated TFs from each group of CAR TILs. i, MFI fold change between pMIG- and BATF-transduced CAR TILs. Each circle in b, e, f, g, h and i represents one mouse, and the bar graphs represent the mean ± standard error of mean (s.e.m.). Data in a-c and d-i were obtained from three and two independent experiments respectively. Data in b were analyzed by one-way ANOVA test; data in c, using a log-rank Mantel-Cox test; data in d, by two-way ANOVA test; and data in e, f, g, and h, by two-tailed unpaired Student’s t-test. *p≤0.05; **p≤0.01; ***p≤0.001; ****p≤0.0001.
Figure 2.
Figure 2.. High-dimensional single-cell characterization of pMIG- and BATF-transduced CAR TILs by mass cytometry (CyTOF)
a-h, 1×10⁵ B16F0-hCD19 tumor cells were injected subcutaneously into the left flank of C57BL/6 mice at day 0 (D0). 1.5×10⁶ pMIG- or BATF-transduced CAR T cells were adoptively transferred at day 12. TILs were isolated at day 20 and stained with metal-conjugated antibodies for mass cytometry, performed at day 21 using a CyTOF mass spectrometer. The gating strategy is detailed in Extended Data Fig. 3a. a, Plots show UMAP views that provide comprehensive single-cell analysis and distinguish TIL subpopulations. b, Detection of indicated markers on pMIG or BATF CAR TILs is visualized by UMAP. c-h, Contour plot of indicated markers on pMIG or BATF CAR TILs. Data are representative of two biological experiments. Each group of samples was pooled from 10 mice.
Figure 3.
Figure 3.. BATF-transduced CAR T cells confer a memory response against tumor rechallenge and exhibit a memory phenotype
a-d, 1×10⁵ B16F0-hCD19 tumor cells were injected subcutaneously into the right flank of C57BL/6 mice (n=5) to yield the “tumor-naïve” control group, or into tumor-free mice from the experiment in Fig. 1c (n=5) that had rejected an initial B16F0-hCD19 tumor and had survived until day 120 after the first tumor injection (rechallenged group). Spleens and draining lymph nodes were harvested 14 days after tumor inoculation or tumor rechallenge. a, Tumor growth curves for individual mice (tumor-naïve C57BL/6 mice, blue dashed lines; rechallenged mice, red dotted lines). No tumor growth was detected in four of the rechallenged mice. b, Left, Representative contour plots showing frequencies of CAR T cells in splenocytes and draining lymph node cells from a fresh control C57BL/6 mouse that did not receive tumor cells, a tumor-bearing C57BL/6 mouse (“tumor-naïve” control group), and a rechallenged mouse. Right, Percentage of CAR TILs relative to total CD8+ TILs in the tumor. The mouse with the lowest frequency of CAR T cells was the one in which the rechallenge tumor had been present initially but then regressed. c, Contour plots for CD62L (y-axis) and CD44 (x-axis) expression. Top, CD8+ T cells from BATF- and pMIG-transduced CAR TILs 8 days after transfer of CAR T cells from the CyTOF experiment of Fig. 2 and Extended Data Fig. 3; middle, BATF-transduced CAR T cells from spleen and draining lymph nodes of rechallenged mice, ~127 days after CAR T cell adoptive transfer; bottom, splenocytes and lymphocytes from draining lymph nodes of fresh control C57BL/6 mice. d, Histogram plotting CyTOF signals of the indicated markers in endogenous CD8+ T cells and in BATF-transduced CAR T cells from rechallenged mice. Each circle in b represents one mouse, and the bar graph represents the mean ± standard error of mean (s.e.m.). Data in b are representative of two biological experiments (see Extended Data Fig. 3e). Samples for each group analyzed in c and d were pooled from 5 mice.
Figure 4.
Figure 4.. The BATF-IRF interaction is required for CAR T cell survival, expansion, and anti-tumor responses
a, Expression of endogenous BATF in pMIG-transduced cells, and of BATF and BATF-HKE in retrovirally transduced CD8+ T cells. b-c, Experimental protocol as in Fig. 1a–c. b, Tumor sizes in individual mice at day 20. c, Survival curves. Data for PBS, pMIG, and BATF are replotted from Fig. 1c, since the BATF-HKE mutant (n=12) was analyzed in the same experimental series. d-g, Experimental protocol as in Fig. 1d–i, except with pMIG(n=7)-, BATF(n=6)-, or BATF-HKE(n=6)-transduced CAR T cells. d, Tumor growth curves for individual mice (dashed lines) and the averages for all mice in a group (bold lines). e, Representative contour plots of CD8α and Thy1.1 expression in the isolated TILs. The Thy1.1 reporter marks CAR T cells. f, Percentage of CAR TILs among CD8+ T cells. g, Number of CAR TILs normalized to tumor size. h-k, 1×10⁵ B16F0-hCD19 tumor cells were injected subcutaneously into the left flank of C57BL/6 mice at day 0 (D0), and indicated CAR T cells were adoptively transferred by retro-orbital injection on day 12. TILs were isolated on Days 13, 16, 19, and 22. No CAR TILs were observed on day 13, one day after adoptive transfer. h,i, Percentages of CAR TILs (h) and normalized numbers of CAR TILs (i) on the indicated days. j, Representative contour plots of PD-1 and TIM3 expression on the CAR TILs, assessed by flow cytometry. k, Frequencies of the indicated PD-1- and TIM3-expressing populations. Each circle in b, f, g, h, and i represents one mouse, and the bar graphs represent the mean ± standard error of mean (s.e.m.). Data in a and h-k are representative of two independent experiments. Data in b and c were obtained from three, and data in d-g from two, independent biological experiments. Data in b, f, and g were analyzed by one-way ANOVA test; data in c, using a log-rank Mantel-Cox test; and data in d, h, and i, by two-way ANOVA test. *p≤0.05; **p≤0.01; ***p≤0.001; ****p≤0.0001.
Figure 5.
Figure 5.. Genome-wide analysis of differences in transcription and chromatin accessibility between pMIG and BATF-transduced cells
a, MA plot of genes differentially expressed in BATF-transduced versus pMIG-transduced CAR TILs. Differentially expressed genes (adjusted p-value < 0.1, log2(fold-change) ≥ 0.5 or ≤ −0.5) are highlighted; selected genes are labelled. b, MA plot of ATAC-seq data from CD8+ T cells in vitro. Differentially accessible regions (DARs, log2(fold-change) ≥ 2 and adjusted p-value ≤ 0.05) are shown as red and blue dots for regions more accessible in BATF- or pMIG-transduced CD8+ T cells, respectively. 551 of the 640 regions that were more accessible in BATF-overexpressing cells overlapped a BATF ChIP-seq peak. c, MA plot of ATAC-seq data from BATF-transduced versus pMIG-transduced CAR TILs. Differentially accessible regions (log2(fold-change) ≥ 2 and adjusted p-value ≤ 0.05) are shown as red and blue dots for regions more accessible in BATF-transduced and pMIG-transduced TILs, respectively. d, Left, Venn diagrams showing the overlap of the 1116 regions more accessible in pMIG- versus BATF-transduced TILs with the exhaustion-related (top) or activation-related (bottom) regions from Mognol et al. Right, Histograms illustrate the significance calculation by one-tailed Fisher’s exact test. e, Heatmap (z-score) of ATAC-seq signals from BATF- and pMIG-transduced CD8+ T cells or CAR TILs, for the 1116 regions more accessible in pMIG TILs compared to BATF TILs. Each column represents a biological replicate. f, Tox locus with normalized ATAC-seq signals for CD8+ T cells and CAR TILs. The top track marks DARs (pMIG>BATF) in the TILs. Yellow highlights call attention to peaks that differ most strikingly between pMIG and BATF TILs. Data in a-c, e, and f were obtained from two independent biological experiments.
Figure 6.
Figure 6.. BATF and IRF4 binding and gene expression changes in pMIG- and BATF-transduced cells
a, Left, Distribution of BATF (red) and IRF4 (blue) ChIP-seq reads in peaks from BATF-transduced cells. Almost all IRF4 reads are located in BATF ChIP-seq peaks, whereas half of BATF reads map to regions that do not coincide with IRF4 peaks. Right, BATF ChIP-seq signal distribution in the shared “BATF and IRF4” peaks (blue) and in “BATF-only” peaks (red). Regions in the histogram corresponding to the peaks of high BATF occupancy (Log2(αBATF_RPM) > 0.5) and low BATF occupancy (Log2(αBATF_RPM) < −2), as discussed in the text, are indicated. b, Heatmaps of the IRF4 ChIP-seq signal in BATF-transduced, BATF-HKE-transduced, and pMIG-transduced cells, at IRF4 peak locations called in pMIG-transduced cells. Curves at the top show the average signal taken over all peaks in the respective heatmap. The average signal is modestly decreased in BATF-overexpressing cells compared to pMIG control cells, and substantially reduced in BATF-HKE-overexpressing cells. c, Heatmap of normalized RNA-seq reads (as z-scores) under the indicated conditions, for the top 100 genes differentially expressed in pMIG-transduced cells after αCD3/αCD28 stimulation. d, MA plot of RNA-seq data from BATF-transduced versus pMIG-transduced CD8+ T cells expanded in vitro as for adoptive transfer, without restimulation. Differentially expressed genes more highly expressed in BATF-transduced cells (red dots) or in pMIG-transduced cells (blue dots) are indicated. Selected genes are labelled. e, MA plot of RNA-seq data from BATF-transduced versus pMIG-transduced CD8+ T cells expanded in vitro, and restimulated with αCD3/αCD28 for 6 h. Differentially expressed genes more highly expressed in BATF-transduced cells (red dots) or in pMIG-transduced cells (blue dots) are indicated. Selected genes are labelled. f, IRF4 (left) and IRF8 (right) expression detected by flow cytometry (MFI) in pMIG- and BATF-transduced CD8+ T cells that had been expanded in vitro, at the indicated times after restimulation with αCD3/αCD28. The black symbol on the y-axis shows expression in naïve CD8+ T cells. Data in a and b were obtained from two, and data in c-e from three, independent biological experiments. Data in f are representative of two independent biological experiments.
Figure 7.
Figure 7.. Relation of BATF binding to chromatin accessibility and gene expression in BATF-transduced cells
a, Box-and-whisker plots showing the distribution of CPM-normalized ATAC-seq and BATF ChIP-seq signals in the collection of BATF ChIP-seq peaks (2504 peak regions) with a substantial increase in signal (log2FC ≥ 3) in BATF- compared to pMIG-transduced cells. Left, for the entire set; right, subdivided into quartiles based on the ATAC-seq signals from pMIG-transduced cells. The box plots represent the minimum, 1st quartile, median, 3rd quartile, and maximum of their respective samples, excluding outliers b, Examples of gene loci where increased BATF binding and increased chromatin accessibility correlate with increased gene expression. Genome browser views of the Mmp10 (top) and Il1r2 (bottom) loci, showing BATF ChIP-seq, ATAC-seq, and RNA-seq signals from pMIG- and BATF-transduced CD8+ T cells expanded in vitro, as well as RNA-seq signals from pMIG- and BATF-transduced CAR TILs. c, Contour plots relating the IRF4 ChIP-seq signals (log2(CPM)) in BATF-transduced (left) or BATF-HKE-transduced (right) CD8+ T cells to the signals from the corresponding peaks in pMIG-transduced cells. Data in a-c were obtained from two or three independent biological experiments.
Figure 8.
Figure 8.. Regions of high IRF4 binding in BATF-overexpressing cells are enriched in strong consensus AP1-IRF (AICE) and AICE2 motifs
a, Dot plot highlighting regions of the IRF4 ChIP-seq data from Fig. 7c, left, where IRF4 binding increases (log2FC ≥ 0.75, red dots) or decreases (log2FC ≤ −0.75, blue dots) in BATF-overexpressing relative to pMIG-transduced cells. Peaks with very low (log2(signal) < −1.25) or high (log2(signal) > 2.5) IRF4 binding in pMIG cells were judged unlikely to be informative and were omitted from the analysis. b, Top enriched known motifs reported by HOMER for IRF4 peak regions with increased binding (red dots in a), using as background the peak regions with decreased binding (blue dots in a). c, Top enriched de novo motifs reported by HOMER in the same comparison. d, Exact matches to strong AICE2 sequences in peaks from the highlighted regions, using the consensus AICE2 sequence or a novel, specialized, AICE2 sequence from Iwata et al. e, Examples of gene loci where increased IRF4 binding in BATF-overexpressing cells correlates with increased gene expression. Left, Genome browser views of Alcam (top) and Ezh2 (bottom) loci, showing BATF ChIP-seq, IRF4 ChIP-seq, and RNA-seq signals from pMIG- and BATF-transduced CD8+ T cells. Right, Quantification of RNA-seq data for Alcam (top) and Ezh2 (bottom) shows expression changes in opposite directions after stimulation with αCD3/αCD28. Data in a were obtained from two independent biological experiments. Each circle in e, right panel, represents cells expanded in vitro from one mouse. Data in e were analyzed by two-tailed unpaired Student’s t-test. **p≤0.01; ***p≤0.001.

Comment in

Similar articles

Cited by

References

    1. Blank CU et al. Defining ‘T cell exhaustion.’ Nat Rev Immunol 19, 665–674 (2019). - PMC - PubMed
    1. McLane LM, Abdel-Hakeem MS & Wherry EJ CD8 T Cell Exhaustion During Chronic Viral Infection and Cancer. Annu Rev Immunol 37, 457–495 (2015). - PubMed
    1. Pereira RM, Hogan PG, Rao A & Martinez GJ Transcriptional and epigenetic regulation of T cell hyporesponsiveness. J Leukocyte Biol 102, 601–615 (2017). - PMC - PubMed
    1. Liu X et al. Genome-wide analysis identifies NR4A1 as a key mediator of T cell dysfunction. Nature 567, 525–529 (2019). - PMC - PubMed
    1. Chen J et al. NR4A transcription factors limit CAR T cell function in solid tumours. Nature 567, 530–534 (2019). - PMC - PubMed

Publication types

MeSH terms

Substances