. 2021 Jul;3(7):940-953.
doi: 10.1038/s42255-021-00427-2. Epub 2021 Jul 19.

Transcriptional regulation of N6-methyladenosine orchestrates sex-dimorphic metabolic traits

Affiliations

Transcriptional regulation of N6-methyladenosine orchestrates sex-dimorphic metabolic traits

David A Salisbury et al. Nat Metab. 2021 Jul.

Erratum in

Abstract

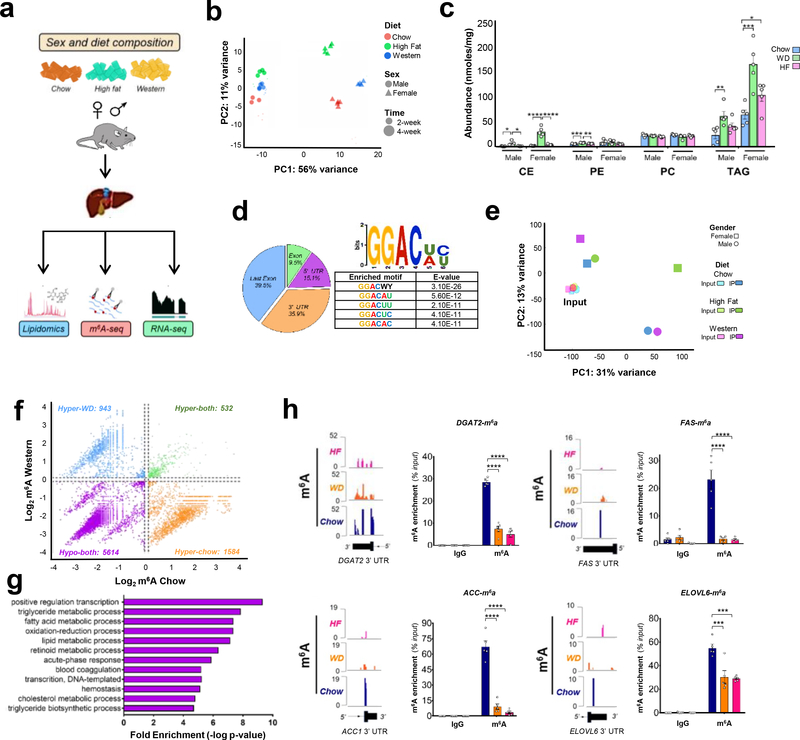
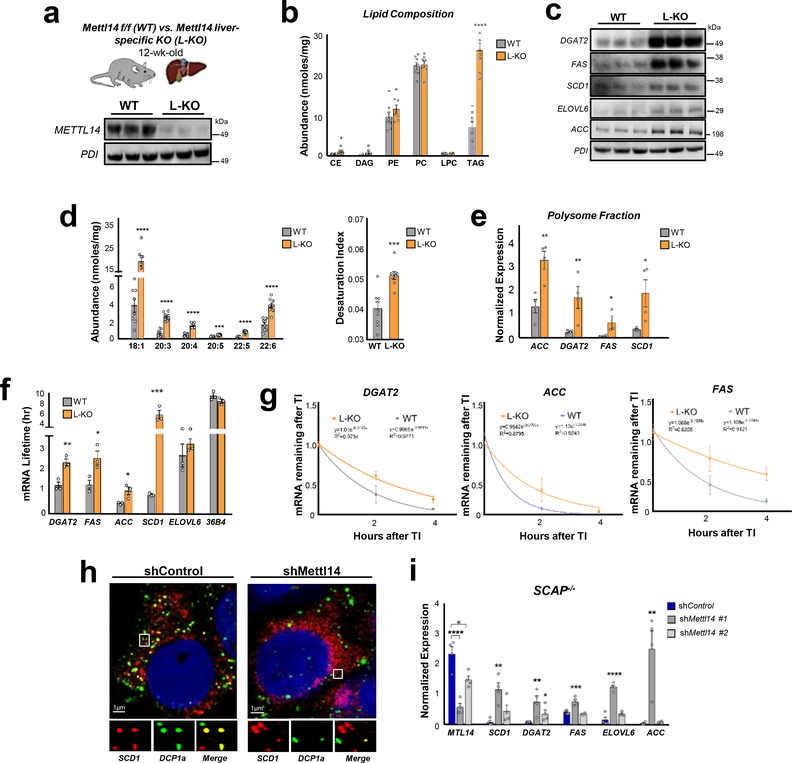
Males and females exhibit striking differences in the prevalence of metabolic traits including hepatic steatosis, a key driver of cardiometabolic morbidity and mortality. RNA methylation is a widespread regulatory mechanism of transcript turnover. Here, we show that presence of the RNA modification N6-methyladenosine (m6A) triages lipogenic transcripts for degradation and guards against hepatic triglyceride accumulation. In male but not female mice, this protective checkpoint stalls under lipid-rich conditions. Loss of m6A control in male livers increases hepatic triglyceride stores, leading to a more 'feminized' hepatic lipid composition. Crucially, liver-specific deletion of the m6A complex protein Mettl14 from male and female mice significantly diminishes sex-specific differences in steatosis. We further surmise that the m6A installing machinery is subject to transcriptional control by the sex-responsive BCL6-STAT5 axis in response to dietary conditions. These data show that m6A is essential for precise and synchronized control of lipogenic enzyme activity and provide insights into the molecular basis for the existence of sex-specific differences in hepatic lipid traits.


Conflict of interest statement

Competing Interests:

J.C. is a scientific founder of Genovel Biotech Corp. and holds equities with the company, and is also a Scientific Advisor for Race Oncology. A patent related to this work is issued to T.S. The other authors declare no competing conflict of interest.

Figures

Extended Data Fig. 1
Extended Data Fig. 1. Effect of sex and diet composition on lipid metabolism.
a, Fat mass measured by MRI for male and female mice in 2week cohort (n=5 per group). b, Body weight of male and female mice in 2-week cohort (n=5 per group). c, Quantification of serum cholesterol levels of male and female mice in 2-week cohort (n=5 per group). d, Quantification of total serum triglycerides of male and female mice in 2-week cohort (n=5 per group). e, Fat mass measured by MRI for male and female mice in 4-week cohort (n=5 per group). f, Body weight of male and female mice in 4-week cohort (n=5 per group). g, Quantification of serum cholesterol levels of male and female mice in 4-week cohort (n=5 per group). h, Quantification of total serum triglycerides of male and female mice in 4-week cohort (n=5 per group). i, Quantification of total serum NEFA from male and female mice in 4-week cohort (n=5 per group). Mice were fed indicated diet for 4 weeks and fasted for 4-hrs. prior to sacrifice. Values are mean ± s.e.m. of 5 independent biological replicates (a-i). P values were calculated using one-way analysis of variance (ANOVA) with multi-group comparison (Fisher’s) in a-i. *P<0.05; ** P<0.01; *** P<0.001; **** P<0.0001. The precise n, P values, and details of the statistical testing are provided in the source data file.
Extended Data Fig. 2
Extended Data Fig. 2. Lipogenic genes are highly enriched for m6A under chow diet.
a, Lipidomics PCA plot for 4-week cohort (n=5 per group). b, Quantification of major lipid species identified in lipidomics analysis of male and female mouse liver for 2-week cohort (n=5 per group). c, Lipidomics heatmap for 4-week cohort (n=5 per group). d, Quantification of major lipid species identified in lipidomics analysis of mouse liver for 4-week cohort (n=5 per group). e, Comparison of number of differentially expressed genes (>2fold) in WD or HF versus chow-fed male livers determined by RNA-seq and m6A-seq. f, Nucleotide sequences containing the m6A motifs on lipogenic transcripts and relative position of each motif on full-length mRNA. g, Rank order table of genes with greatest fold-change in m6A in male livers (Chow vs. Western diet). h, UCSC browser screenshot showing changes in m6A enrichment for DGAT2 in chow and HF diet-fed male livers. Mice were fed indicated diet for 4 weeks and fasted for 4-hrs. prior to sacrifice. Values are mean ± s.e.m. of 5 independent biological replicates (b,d). P values were calculated using one-way analysis of variance (ANOVA) with multi-group comparison (Fisher’s) in b and d. *P<0.05; ** P<0.01; *** P<0.001; **** P<0.0001. The precise n, P values, and details of the statistical testing are provided in the source data file.
Extended Data Fig. 3
Extended Data Fig. 3. Loss of the m6A methylase METTL14 increases lipogenesis and hepatic triglyceride accumulation.
a, Western blot of Mettl14 in other tissues from WT and Mettl14 L-KO chow-fed males. Equal amounts of protein were pooled from four animals per group and run in triplicate. b, Lipidomics heatmap comparing hepatic lipidome of WT versus Mettl14 L-KO chow-fed males. (n=8 per group). c, Quantification of various lipid species from lipidomics analysis of chow-fed male livers (n = 8). Statistical analysis was performed using unpaired two-tailed t-test. Values are mean ± SEM. d, Quantification of total food intake for chow-fed male WT and Mettl14 L-KO mice (n=8 per group). e, Body weight and percent fat measured by MRI for chow-fed male WT and Mettl14 L-KO mice (n = 8 WT mice, n = 7 L-KO mice). f, Quantification of cellular respiratory rate in livers of chow-fed WT and Mettl14 L-KO mice using NADH as the acceptor (n=5 per group). g, qPCR analysis of fatty acid oxidation gene expression from chow-fed WT and Mettl14 L-KO livers (n=5). The experiment was repeated two times with similar results. h, Quantification of serum triglyceride levels from chow-fed male WT and Mettl14 L-KO mice (n=8 per group). i, qPCR analysis of gene expression from liver of WT and Mettl14 L-KO mice (n=4 per group). The experiment was repeated two times with similar results. j, Western blot of lipogenic protein levels in a second independent cohort of chow-fed male mice. Equal amounts of protein were pooled from eight animals per group and run in triplicate. The experiment was repeated three times with similar results. k, Western blot comparing levels of lipogenic proteins in the setting of chronic Mettl14 deficiency (albumin-cre transgenics or control). Equal amounts of protein were pooled from five animals per group and run in triplicate. The experiment was repeated two times with similar results. l, Quantification of hepatic triglyceride concentrations from livers of albumin-cre transgenic or control mice (n = 4 Cre-N mice, n = 5 Cre-P mice). m, Quantification of lipogenic transcript m6A abundance in WT and Mettl14 L-KO chow-fed livers measured by m6A-IP-qPCR analysis (n = 4). The relative enrichment of m6A in each sample was determined by normalizing to ten-fold input. The experiment was repeated two times with similar results. n, Quantification of lipogenic transcript m6A abundance in WT and Mettl14 L-KO chow-fed livers measured by m6A-IP-qPCR analysis (n=4). The relative enrichment of m6A in each sample was determined by normalizing to GAPDH. The experiment was repeated two times with similar results. Mice were fed chow diet for 4 weeks and fasted for 4-hrs. prior to sacrifice. Values are mean ± s.e.m. of 4 (I,l-n), 5 (f,g), 6 (d), or 8 (c,e,h) independent biological replicates. P values were calculated using unpaired two-tailed t-test. (c-i,l-n). *P<0.05; ** P<0.01; *** P<0.001; **** P<0.0001. The precise n, P values, and details of the statistical testing are provided in the source data file.
Extended Data Fig. 4
Extended Data Fig. 4. m6A regulates the stability and cytoplasmic distribution of lipogenic transcripts.
a, qPCR analysis of lipogenic gene expression in livers of WT and Mettl14 L-KO chow-fed male mice (n=6 per group). The experiment was repeated three times with similar results. b, qPCR analysis of lipogenic pre-mRNA expression using primers that amplify intronic regions from livers of WT and Mettl14 LKO chow-fed male mice (n=4 per group). The experiment was repeated three times with similar results. c, Western blot of SREBP-1c from nuclear fraction (mature SREBP-1 [mSREBP1c]). mSREBP-1c levels in livers of re-fed (4 hr.) mice are shown as reference. Equal amounts of protein were pooled from five animals per group and run in triplicate. The experiment was repeated two times with similar results d, qPCR analysis of lipogenic transcript levels in WT or Mettl14 LKO livers at 72 hrs. after Mettl14 deletion (n=4). e, Polysome profiling curve depicting three major cytoplasmic mRNA pools. f, qPCR analysis quantifying amount of lipogenic mRNAs in ribosome-bound fractions in livers of Mettl14 L-KO chow-fed males compared to WT (n=3 per group). g, mRNA stability assay for SCD1 mRNA in primary hepatocytes harvested from WT and Mettl14 L-KO chow-fed male mice (n = 3 per group). h, qPCR analysis of Mettl14 expression in AML cells used for single-molecule RNA FISH. (n = 5 per group). i, Quantification of hepatic triglyceride content in WD-fed male mice injected with AAV_m6A writers (Mettl14+Mettl3+WTAP) or AAV_null (normalized to liver weight) (n=6 per group). Mice were fed indicated diet for 4 weeks and fasted for 4-hrs. prior to sacrifice except for mice in (i). Mice in (i) were fed NASH diet for 8-weeks and fasted 4-hrs. prior to sacrifice. Values are mean ± s.e.m. of 3 (f,g), 4 (b,d), 5 (h), or 6 (a,i) independent biological replicates. P values were calculated using unpaired two-tailed t-test. (a,b,d,h,i). *P<0.05; ** P<0.01; *** P<0.001; **** P<0.0001. The precise n, P values, and details of the statistical testing are provided in the source data file.
Extended Data Fig. 5
Extended Data Fig. 5. Regulation of Mettl14 in response to dietary conditions
a, Quantification of major lipid species identified in lipidomics analysis of male WD-fed WT and Mettl14 L-KO livers (n = 7 WT mice, n = 8 KO mice). b, UCSC browser screenshots showing decreased H3K27ac at Mettl14 promoter under HF diet feeding compared to chow. Mice were fed either standard chow diet (Prolab Isopro RMH 3000, Purina) for 24 weeks or 8 weeks of standard chow diet followed by 16 weeks of HFD (Soltis et al. 2017. Cell Reports). c, UCSC browser screenshots showing regulation of METTL14 promoter by BCL6 and STAT5a in human (Steube et. al 2017. Nat Comm; Gertz et. al 2013. Mol. Cell; respectively). d, UCSC browser screenshots showing ATAC-seq data for Mettl14 promoter region from male mouse liver under different diets and regulation of Mettl14 promoter by BCL6 and STAT5a in male and female mice fed WD (Zhang et. al 2011. Mol Cel Biol). e, qPCR analysis showing fast/refeed regulation of Bcl6 expression in livers of chow-fed males (n=5 per group). The experiment was repeated twice with similar results. f, Quantification of m6A abundance on lipogenic transcripts in fasted (4 hr) or re-fed (fasted overnight and then re-fed 4 hr) male livers as measured by m6A-IP-qPCR (n=4). The experiment was repeated twice with similar results. g, Expression of Mettl3, WTAP in re-fed mice (fasted overnight and then re-fed 4 hr) compared to fasted (4 hr) mice as measured by qPCR analysis (n=5). h, qPCR analysis of Mettl3 expression in male and female liver under various diets (n = 4 chow-fed females, n = 5 all other groups). Mice were fed the indicated diet for 4 weeks and fasted (4 hr) or re-fed (fasted overnight and then refed for 4-hrs. prior to sacrifice). Values are mean ± s.e.m. of 4 (f), 5 (e,g,h) or 7 (a) indpendent biological replicates. P values were calculated using unpaired two-tailed t-test (a,e-g) or one-way analysis of variance (ANOVA) followed by multi-group comparison (Fisher’s) in h. *P<0.05; ** P<0.01; *** P<0.001; **** P<0.0001. The precise n, P values, and details of the statistical testing are provided in the source data file.
Extended Data Fig. 6
Extended Data Fig. 6. Loss of Mettl14 is associated with sexbiased gene expression.
a, Comparison of gene expression fold changes between control and Mettl14 L-KO mice obtained from male (x axis) or female (y axis) samples. b, Comparison of gene expression fold changes between male and female mice obtained from control (x axis) or Mettl14 L-KO (y axis) samples. The linear fit of all fold changes (yellow) has a smaller slope than the Control=KO line (black), highlighting that male/female differences are higher in controls for most genes. c, Hierarchical clustering of samples harvested from liver based on pair-wise distances. Shown is the tree based on the Euclidean distance between all samples (n = 7 WT male mice, n = 8 mice all other groups) based on genome-wide mRNA abundance distributions. d, Expression of XIST and SRY in livers of WT and Mettl14 L-KO mice as measured by qPCR (n = 4). e, Heatmaps of selected differential genes with distinct responses to Mettl14 L-KO. Three specific clusters of genes with sex-specific response to Mettl14 are shown. Highlighted are the name of genes known to be involved in metabolic pathways. Gene names are ordered as in the heatmap. All mice were fed WD for 4 weeks and fasted for 4 hrs. prior to sacrifice. P values were calculated using unpaired two-tailed ttest (d). The precise n, P values, and details of the statistical testing are provided in the source data file.
Fig. 1 |
Fig. 1 |. RNA methylation strongly enriches lipogenic transcripts and is dynamically regulated with diet.
a, Schematic of experimental design. b, Principal component analysis (PCA) of gene expression for mouse liver samples under chow (n = 5 females, 3 males), WD (n = 4 females, 5 males), and HF diet (n = 5 females, 4 males). The first two components (PC1, PC2) are shown along with the percent of gene expression variance explained. Clustering was obtained with data from all detected genes without additional filters. HF=High Fat, WD=Western Diet. Results are representative of 2 independent experiments. c, Major hepatic lipid species analyzed by lipidomics in liver harvested from male and female mice fed chow, WD, or HF (n = 5 per group). Results are representative of 2 independent experiments. d, Pie chart illustrating relative position of m6A on immunoprecipitated transcripts and motif enrichment analysis of m6A-containing RNAs. E-values were computed as the enrichment p-value (Fisher’s Exact Test for enrichment of the motif in the positive sequences) times the number of candidate motifs tested. e, PCA plot for m6A-seq in mouse liver under different conditions. Both input and m6A immunoprecipitated samples are displayed. f, Scatter plot comparing m6A enrichment between chow and WD-fed male livers. Hyper-methylated peaks with significantly higher m6A enrichment (log2m6A > 0) in chow compared to WD are noted with orange dots, and hypo-methylated peaks with significantly lower m6A enrichment (log2m6A<0) in chow compared to WD are noted with blue dots. Genes with no significant difference in m6A enrichment between chow and WD are shown in orange (hypermethylated in chow compared to WD) and purple (hypomethylated in chow compared to WD). g, DAVID functional annotation of top 500 genes with highest m6A enrichment in male mice fed chow versus WD diet. Gene ontology analysis was performed with –log10 (p value) plotted (x axis) as a function of classification meeting a p value of < 0.001. h, UCSC browser screenshots and enrichment of m6A modification on lipogenic transcripts in male liver as determined by m6A-IP-qPCR (n=5 per group). The relative enrichment of m6A in each sample was calculated by normalizing to tenfold input. Results are representative of 2 independent experiments. All mice were fed the indicated diet for 4 weeks and fasted for 4 hrs prior to sacrifice. Values are mean ± s.e.m. of five biological replicates (c,h). P values were calculated using one-way analysis of variance (ANOVA) followed by a multi-group comparison test (Fisher’s) in c and h or unpaired two-tailed t-test in g. *P<0.05; ** P<0.01; *** P<0.001; **** P<0.0001. The precise n, P values, and details of the statistical testing are provided in the source data file.
Fig. 2 |
Fig. 2 |. Liver-specific deletion of the m6A methylase METTL14 increases de-novo lipogenesis and hepatic triglyceride content.
a, Western blot from liver of WT and Mettl14 L-KO chow-fed male mice. Equal amounts of protein were pooled from eight animals and run in triplicate. The experiment was repeated 3 times with similar results. b, Quantification of major lipid species detected in livers of chow-fed male WT and Mettl14 L-KO mice by unbiased lipidomics (n = 8 per group). c, Western blot comparing lipogenic protein levels in WT versus Mettl14 L-KO chow-fed male mice livers (n = 8 per group). Equal amounts of protein were pooled from eight animals per group and run in triplicate. The experiment was repeated 3 times with similar results. d, Unbiased lipidomic measurement from liver of PUFAs (measured by lipidomics) and SCD1 index for WT and Mettl14 L-KO chow-fed male mice (n = 8 per group). e, qPCR analysis of transcript levels in polysome fraction from WT and Mettl14 L-KO chow-fed male livers (n = 4). The experiment was repeated 3 times with similar results. f, mRNA lifetime of lipogenic transcripts in primary hepatocytes harvested from livers of chow-fed WT and Mettl14 L-KO mice (n=3). g, Quantification of transcript abundance by qPCR at 2hr and 4hr after transcription inhibition in primary hepatocytes harvested from WT and Mettl14 L-KO chow-fed male livers (n=3). h, Single-molecule RNA FISH showing localization of SCD1 mRNA in WT and Mettl14 knockdown AML cells. Images are representative of three independent experiments. i, qPCR analysis of lipogenic gene expression in METTL14-knockdown versus control in SCAP-KO HEK293 cells (n=4). The experiment was repeated 2 times with similar results. All mice were fed chow diet for the indicated time period and fasted for 4 hrs prior to sacrifice. Values are mean ± s.e.m. of 3(f,g), 4(e,i), or 8(b,d) independent biological replicates. P values were calculated using unpaired two-tailed t-test (b,d,e,f,g,i). *P<0.05; ** P<0.01; *** P<0.001; **** P<0.0001. The precise n, P values, and details of the statistical testing are provided in the source data file.
Fig. 3 |
Fig. 3 |. METTL14 expression is inversely correlated with fatty liver disease and hepatic triglyceride content.
a, Pearson correlation coefficient and P-value comparing METTL14 expression and NAFLD traits in humans (n=144) from Mexican Obesity Surgery (MOBES) Cohort. b, Correlation between METTL14 expression and NAFLD from Mexican Obesity Surgery (MOBES) cohort. c, Schematic of gene therapy design. d, Gene expression in liver harvested from mice injected with AAV8.tbg.Mettl14, AAV8.tbg.Mettl3 and AAV8.tbg.Wtap ‘writers’ versus equal amount AAV8.tbg.null (n = 6). e, Quantification of m6A abundance on lipogenic mRNAs as measured by m6A-IP-qPCR from livers of mice injected with AAV8.tbg.Mettl14, AAV8.tbg.Mettl3 and AAV8.tbg.Wtap ‘writers’ versus equal amount AAV8.tbg.null (n = 4). The experiment was repeated two times with similar results. f, Western blot comparing lipogenic protein levels in livers of mice overexpressing m6A writers compared to control. Equal amounts of protein were pooled from 6 animals per group and run in triplicate. The experiment was repeated three times with similar results. g, Oil-Red-O staining of frozen liver sections from mice in (f). Images are representative of three independent biological replicates. Scale bar equals 100 microns (left), 50 microns (right). h, qPCR analysis of NASH-related fibrosis and inflammatory gene expression from livers of mice treated with AAV overexpression of m6A writers or null (n = 5). The experiment was repeated two times with similar results. i, Schematic of in-vitro targeted RNA modification (TRM) editor experiment. j, Quantification of m6A abundance at Scd1 by m6A-IP-qPCR following transfection of TRM editors (n = 4 independent biological replicates). Values were normalized to a non-targeted m6A site located in the 3’ UTR of Scd1. k, Western blot comparing SCD1 protein levels in cells transfected with gRNAs targeting A2445 or A2134 versus cells transfected with nontargeting gRNA. Samples were pooled from 3 independent biological replicates and run in duplicate. The experiment was performed three times with similar results. All mice were fed NASH diet for 8 weeks and fasted for 4 hrs prior to sacrifice. Values are mean ± s.e.m. of 4 (e,j), 5 (h), or 6 (d) biological replicates. P values were calculated using one-way analysis of variance (ANOVA) followed by multi-group comparison (Fisher’s) in b or unpaired two-tailed t-test (b,d,e,h,j) *P<0.05; ** P<0.01; *** P<0.001; **** P<0.0001. The precise n, P values, and details of the statistical testing are provided in the source data file.
Fig. 4 |
Fig. 4 |. m6A machinery is dynamically regulated by diet and exhibits sexual dimorphism.
a, Hepatic TAG content determined by lipidomics from WT and Mettl14 L-KO mice under WD feeding (n = 7 WT mice, n = 8 KO mice). b, H&E staining of representative livers from male WD-fed WT or Mettl14 L-KO mice. Images are representative of three independent biological replicates. c, Western blot comparing lipogenic protein levels in WT and Mettl14 L-KO livers from chow and WD-fed male mice. Equal amounts of protein were pooled from five animals per group and run in triplicate. The experiment was repeated three times with similar results. d, Western blot showing Mettl14 protein levels in liver of fasted (4 hr prior to sacrifice) versus re-fed (fasted overnight then re-fed for 4 hr) male mice. Equal amounts of protein were pooled from five animals per group and run in triplicate. The experiment was repeated three times with similar results. e, Western blot showing lipogenic protein levels in livers of male WT and Mettl14 L-KO re-fed mice (fasted overnight then re-fed for 4 hr). Equal amounts of protein were pooled from five animals per group and run in triplicate. The experiment was repeated three times with similar results. f, qPCR analysis of Mettl14 expression in male and female livers under different diets (n=5). g, Western blot showing Mettl14 protein levels in liver harvested from male and female mice fed different diets. Equal amounts of protein were pooled from five animals per group and run in triplicate. The experiment was repeated three times with similar results. h, LC-MS quantification of hepatic m6A levels in male and female mice fed different diets (n=5). One male WD sample and one female chow sample were identified as outliers and formally excluded (Grubbs, alpha = 0.05). Mice were fed the indicated diet for 4 weeks and fasted 4-hrs prior to sacrifice except for mice in (d,e). Mice in (d,e) were fasted overnight and then re-fed for 4-hrs prior to sacrifice. Values are mean ± s.e.m. of 5 (f,h), 7 (a), or 8 (a) independent biological replicates. P values were calculated using unpaired two-tailed t-test (a) or one-way analysis of variance (ANOVA) followed by multi-group comparison (Fisher’s) in f and h. *P<0.05; ** P<0.01; *** P<0.001; **** P<0.0001. The precise n, P values, and details of the statistical testing are provided in the source data file.
Fig. 5 |
Fig. 5 |. m6A machinery undergoes transcriptional regulation by sex-biased transcription factors.
a, qPCR analysis of Mettl14 expression in livers of male and female Apoe−/− mice (n=3) with core four genotypes. b, UCSC browser screenshot of ATAC-seq data for Mettl14 promoter region from male mouse liver under different diets and transcription factor motifs identified at this site. Screenshots are representative of five independent biological replicates. c, qPCR analysis of Bcl6 expression in male mouse livers under different diets (n=4 WD, n=5 chow, HF). The experiment was repeated three times with similar results. d, qPCR analysis of Mettl14 expression in livers of male and female WD-fed WT and Bcl6 L-KO mice (n=5 WT mice,6 Bcl6 KO mice). The experiment was repeated three times with similar results. e, Western blot comparing Mettl14 protein levels in livers of male and female WD-fed Bcl6 KO mice compared to WD-fed WT mice. Equal amounts of protein were pooled from 5 animals per group and run in triplicate. The experiment was repeated two times with similar results. All mice were fed the indicated diet for 4 weeks and were fasted for 4-hrs prior to sacrifice. Values are mean ± s.e.m. of 3 (a), 4 (c), 5 (c, d), or 6 (d) independent biological replicates. P values were calculated using one-way analysis of variance (ANOVA) followed with multi-group comparison (Fisher’s) in c or two-way ANOVA followed with multi-group comparison (Tukey) in a and d. *P<0.05; ** P<0.01; *** P<0.001; **** P<0.0001. The precise n, P values, and details of the statistical testing are provided in the source data file.
Fig. 6 |
Fig. 6 |. Loss of m6A significantly diminishes sex-specific differences in hepatic lipid composition.
a, CIRCOS plot of hepatic lipid content under different diets (n=5 per group). Width of connection indicates higher TAG content. b, Heatmap of lipogenic gene expression in livers of male and female mice under different diets (n=5 per group) based on RNA-seq. c, qPCR analysis of lipogenic gene expression in livers of WD-fed male and female mice (n=4 per group). The experiment was repeated three times with similar results. d, Western blots comparing lipogenic protein levels in WD-fed WT male and female liver. Equal amounts of protein were pooled from eight animals per group and run in triplicate. The experiment was repeated three times with similar results. e, m6A-IP-qPCR validation of m6A enrichment on lipogenic genes in livers of male and female mice (n=4 per group). The experiment was repeated two times with similar results. f, Western blots comparing lipogenic protein levels in WD-fed Mettl14 L-KO male and female liver. Equal amounts of protein were pooled from eight animals per group and run in triplicate. The experiment was repeated three times with similar results. g, Quantification of hepatic TG content by lipidomics in WT and Mettl14 L-KO male and female livers (n = 6 KO chow-fed females, n = 7 WT and KO WD-fed males and females, n = 8 WT and KO chow-fed males and KO chow-fed females. h, Principal component analysis (PCA) of gene expression for male and female mouse livers in control and Mettl14 L-KO samples (n = 7 WT males, n = 8 all other groups). Clustering was obtained with data from all detected genes without additional filters. i, Barplot of functional enrichment adjusted P-values (hypergeometric P-values after Benjamini-Hochberg correction) for genes significantly associated with sex-specific responses to Mettl14-L-KO (interaction genes). Ontology terms are grouped by gene member similarity. All mice were fed the indicated diet for 4 weeks and fasted for 4-hrs prior to sacrifice. Values are mean ± s.e.m. of 4 (c,e) or 6–8 (g) independent biological replicates. P values were calculated using unpaired two-tailed t-test (c,e,g). *P<0.05; ** P<0.01; *** P<0.001; **** P<0.0001. The precise n, P values, and details of the statistical testing are provided in the source data file.

Similar articles

Cited by

References

    1. Horton JD, Goldstein JL & Brown MS SREBPs: activators of the complete program of cholesterol and fatty acid synthesis in the liver. The Journal of clinical investigation 109, 1125–1131, doi:10.1172/JCI15593 (2002). - DOI - PMC - PubMed
    1. Shimomura I et al.Insulin selectively increases SREBP-1c mRNA in the livers of rats with streptozotocin-induced diabetes. Proc Natl Acad Sci U S A 96, 13656–13661, doi:10.1073/pnas.96.24.13656 (1999). - DOI - PMC - PubMed
    1. Shimano H et al.Isoform 1c of sterol regulatory element binding protein is less active than isoform 1a in livers of transgenic mice and in cultured cells. J Clin Invest 99, 846–854, doi:10.1172/JCI119248 (1997). - DOI - PMC - PubMed
    1. Lee KN, Pariza MW & Ntambi JM Differential expression of hepatic stearoyl-CoA desaturase gene 1 in male and female mice. Biochim Biophys Acta 1304, 85–88, doi:10.1016/s0005-2760(96)00145-2 (1996). - DOI - PubMed
    1. Horton JD, Shimano H, Hamilton RL, Brown MS & Goldstein JL Disruption of LDL receptor gene in transgenic SREBP-1a mice unmasks hyperlipidemia resulting from production of lipid-rich VLDL. J Clin Invest 103, 1067–1076, doi:10.1172/JCI6246 (1999). - DOI - PMC - PubMed

Publication types