. 2021 Jun 23:11:678482.
doi: 10.3389/fcimb.2021.678482. eCollection 2021.

Deleterious Effects of SARS-CoV-2 Infection on Human Pancreatic Cells

Affiliations

Deleterious Effects of SARS-CoV-2 Infection on Human Pancreatic Cells

Syairah Hanan Shaharuddin et al. Front Cell Infect Microbiol. .

Abstract

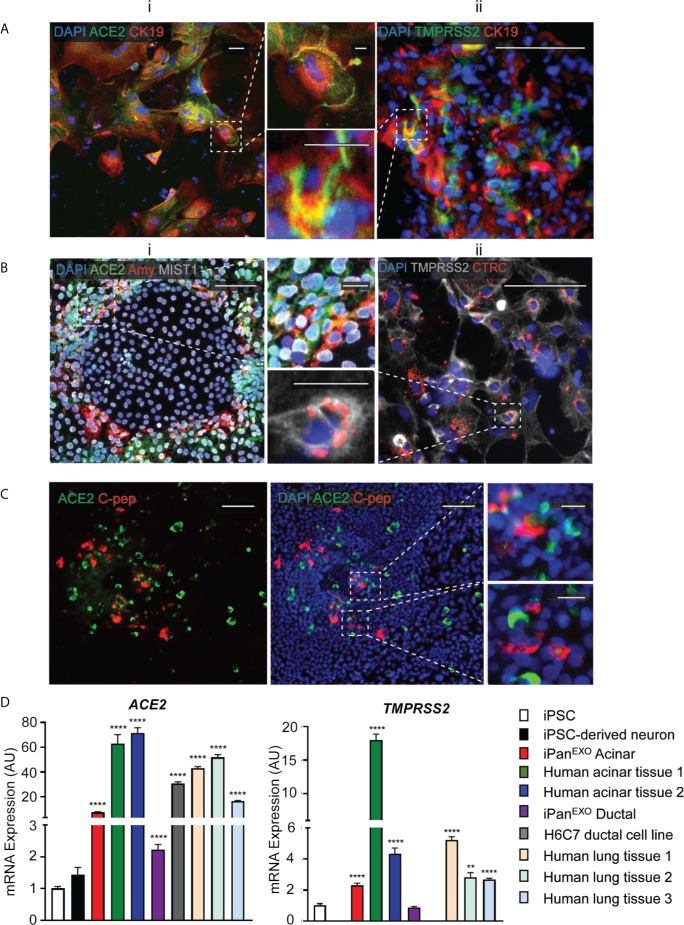
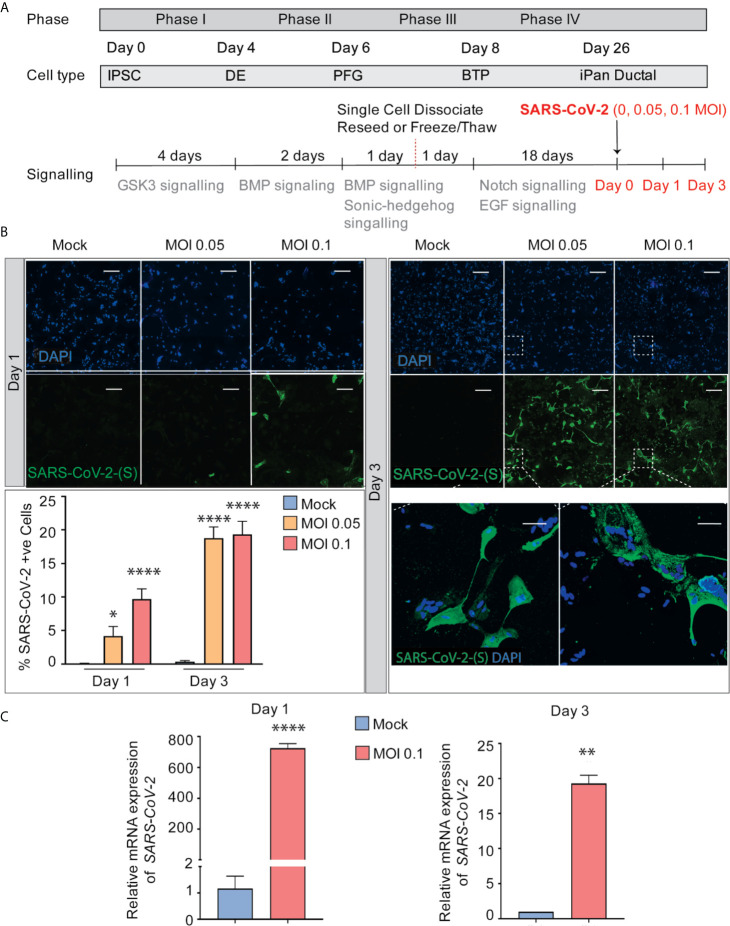
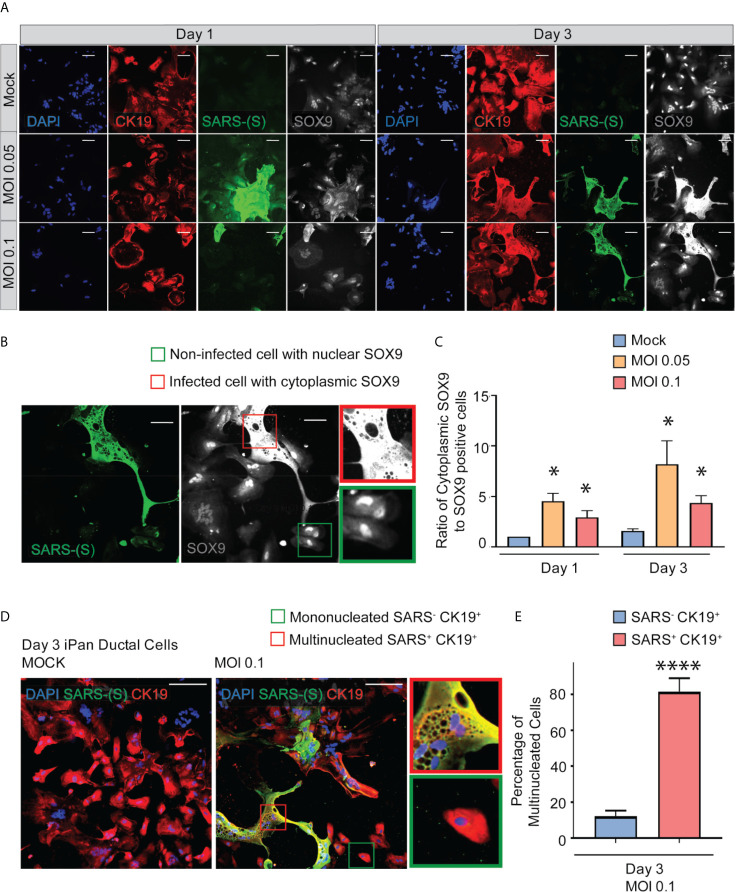
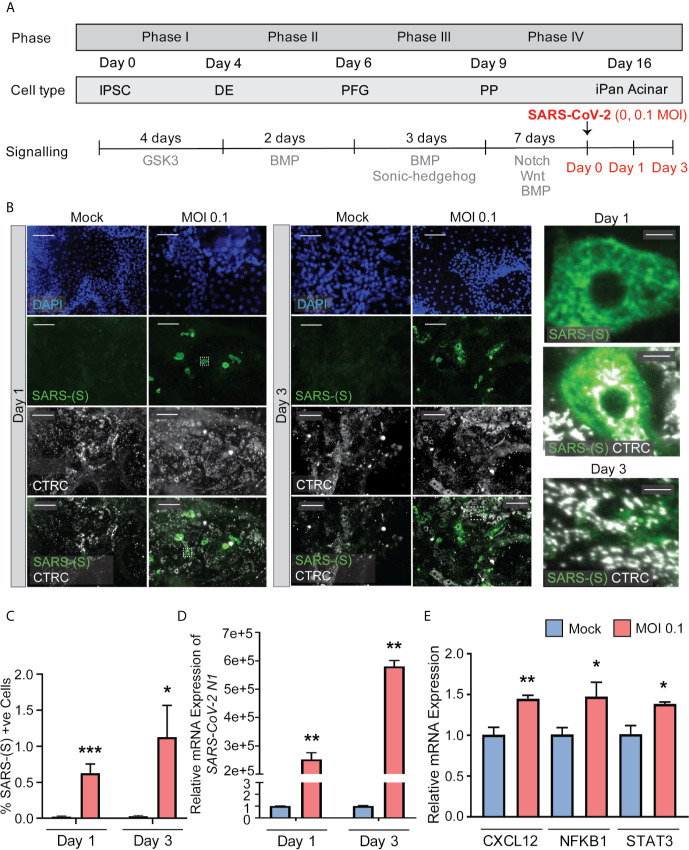
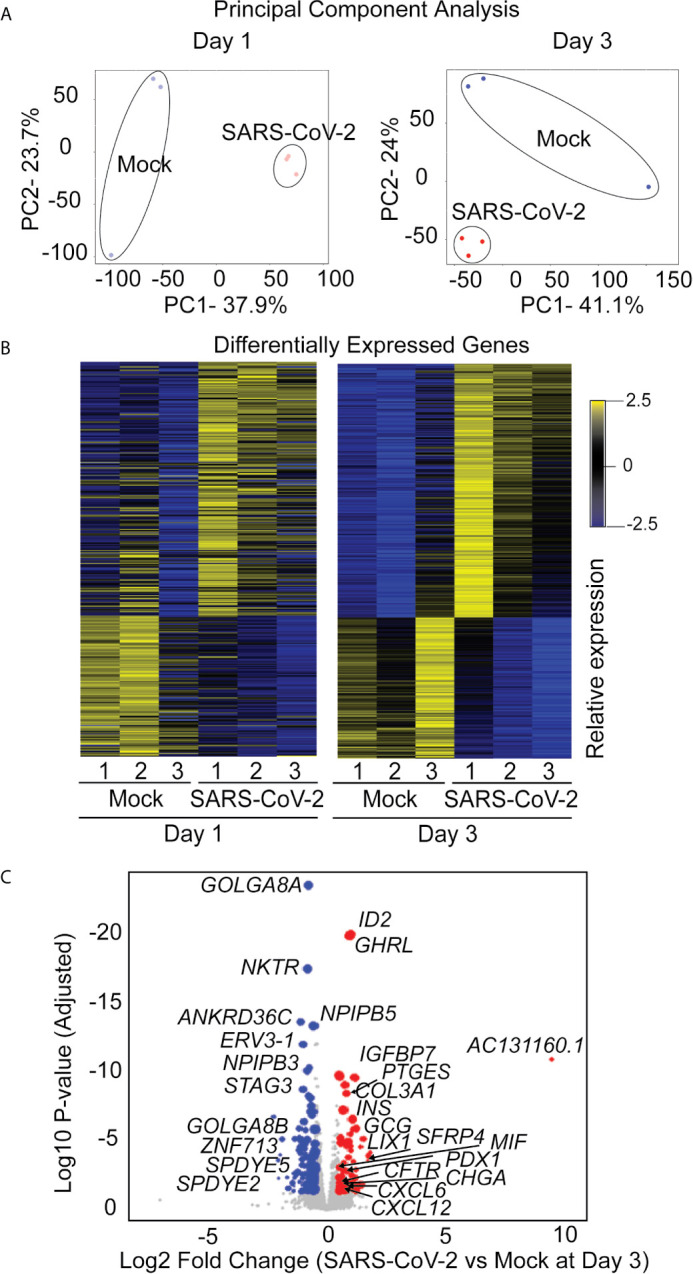
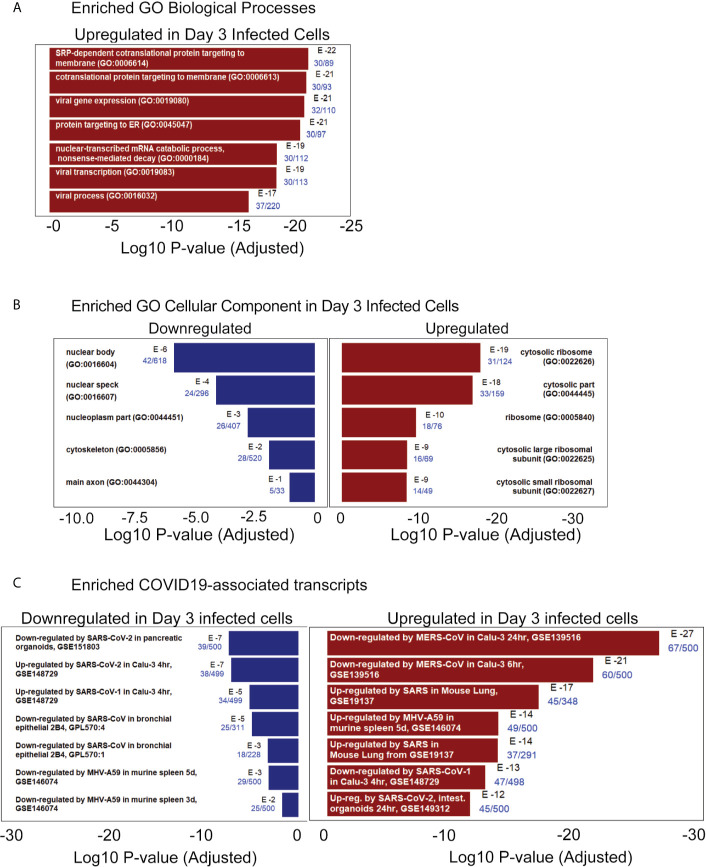
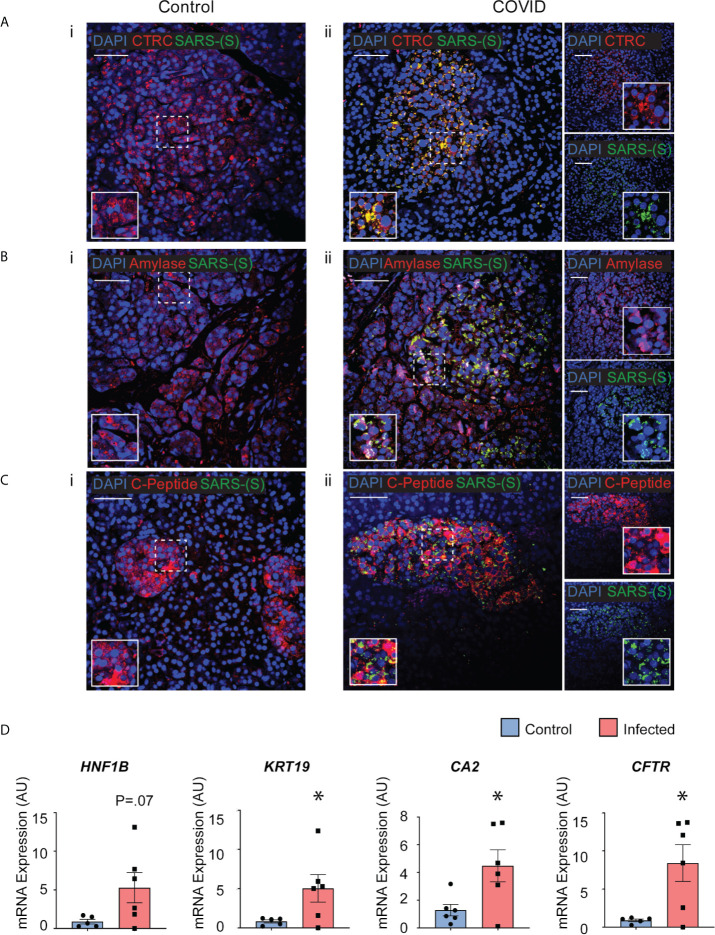
COVID-19 pandemic has infected more than 154 million people worldwide and caused more than 3.2 million deaths. It is transmitted by the Severe Acute Respiratory Syndrome Coronavirus 2 (SARS-CoV-2) and affects the respiratory tract as well as extra-pulmonary systems, including the pancreas, that express the virus entry receptor, Angiotensin-Converting Enzyme 2 (ACE2) receptor. Importantly, the endocrine and exocrine pancreas, the latter composed of ductal and acinar cells, express high levels of ACE2, which correlates to impaired functionality characterized as acute pancreatitis observed in some cases presenting with COVID-19. Since acute pancreatitis is already one of the most frequent gastrointestinal causes of hospitalization in the U.S. and the majority of studies investigating the effects of SARS-CoV-2 on the pancreas are clinical and observational, we utilized human iPSC technology to investigate the potential deleterious effects of SARS-CoV-2 infection on iPSC-derived pancreatic cultures containing endocrine and exocrine cells. Interestingly, iPSC-derived pancreatic cultures allow SARS-CoV-2 entry and establish infection, thus perturbing their normal molecular and cellular phenotypes. The infection increased a key cytokine, CXCL12, known to be involved in inflammatory responses in the pancreas. Transcriptome analysis of infected pancreatic cultures confirmed that SARS-CoV-2 hijacks the ribosomal machinery in these cells. Notably, the SARS-CoV-2 infectivity of the pancreas was confirmed in post-mortem tissues from COVID-19 patients, which showed co-localization of SARS-CoV-2 in pancreatic endocrine and exocrine cells and increased the expression of some pancreatic ductal stress response genes. Thus, we demonstrate that SARS-CoV-2 can directly infect human iPSC-derived pancreatic cells with strong supporting evidence of presence of the virus in post-mortem pancreatic tissue of confirmed COVID-19 human cases. This novel model of iPSC-derived pancreatic cultures will open new avenues for the comprehension of the SARS-CoV-2 infection and potentially establish a platform for endocrine and exocrine pancreas-specific antiviral drug screening.

Keywords: COVID-19; SARS-CoV-2; acinar cells; ductal cells; iPSCs; islets; pancreas; pancreatitis.


Conflict of interest statement

The authors declare that the research was conducted in the absence of any commercial or financial relationships that could be construed as a potential conflict of interest.

Figures

Figure 1
Figure 1
Expression of ACE2 and TMPRSS2 in exocrine pancreatic cells. (A) iPanEXO Ductal cells CK19 (red) exhibiting i. ACE2 (green) and ii. TMPRSS2 (green) expression. (B) iPanEXO Acinar cells Amylase (red), MIST1 (gray) exhibit i. ACE2 (green) expression and ii. iPanEXO Acinar CTRC (red) exhibit TMPRSS2 (green). (C) iPanEXO Acinar and iPanENDO cultures contain some endocrine C-peptide expressing cells, which also co-stain with ACE2. (D) iPSC-derived pancreatic exocrine cells as well as human acinar tissues and human ductal cell line H6C7 express ACE2 and TMPRSS2. Data is shown as mean ± SEM with statistical significance determined by unpaired two-tailed t-test. **p < 0.01 and ****p < 0.0001. Scale bar represents 100 µm, and 20 µm for zoomed panels adjacent to main images. ICC images shown here are representative results from 27 independent sites acquired. RNA was extracted from aggregates of 2-3 biological replicates (using 12 well-plates), and qPCR was run with 3 technical replicates per sample. These results were pooled from 2 independent rounds of infection experiments.
Figure 2
Figure 2
SARS-CoV-2 can infect iPanEXO Ductal Cells. (A) Differentiation scheme of pancreatic ductal cells and infection of SARS-CoV-2 on Day 26. (B) Immunocytochemistry staining of SARS-(S) at Day 1 and Day 3 (Scale bar is 200 µm). (C) RT-qPCR showing upregulation of SARS-CoV-2 N1 from mock to infected cells at different days. Data is shown as mean ± SEM with statistical significance determined by unpaired two-tailed t-test. *p < 0.05, **p < 0.01, ****p < 0.0001. Scale bar represents 200 µm. ICC images shown here are representative results from 36 independent sites acquired. RNA was extracted from aggregates of 6-15 biological replicates (using 96 well-plates), and qPCR was run in 3 technical replicates per sample. These results were pooled from 2 independent rounds of infection experiments.
Figure 3
Figure 3
SARS-CoV-2 elicits abnormal cellular phenotypes in iPanEXO Ductal cultures. (A) Day 1 and Day 3 of post infected iPanEXO Ductal cells. Immunocytochemistry staining of ductal cell markers CK19 (red), SOX9 (gray), and SARS-CoV-2 infected cells (green) on Day 1 and Day 3 with varying titers of virus (Mock, MOI 0.05, and 0.1). (B) SOX9 translocation in infected cells. (Scale bar is 200 µm). (C) Histogram is showing the ratio of cells with mis localized cytoplasmic SOX9 over total nuclear SOX9 positive cells in the culture, comparing mock vs SARS-CoV-2 infected ductal cultures at MOI 0.05 and 0.1. Data is shown as mean ± SEM with statistical significance determined by unpaired two-tailed t-test. *p < 0.05. Scale bar represents 200 µm. Zoomed panels adjacent to main images are 2.3x larger. ICC images shown here are representative results from 36 independent sites acquired. These results were pooled from 2 independent rounds of infection experiments. (D) Immunocytochemistry staining of SARS-(S) at Day 3 Mock and MOI 0.1. Zoom in panels indicate mononucleated SARS- CK19+ cell (green box) and multinucleated SARS+ CK19+ cell (red box). Scale bar represents 200 µm. ICC images shown here are representative results from 9 independent sites acquired. (E) Histogram is showing the percentage of multinucleated cells in non-infected SARS- CK19+ population and infected SARS+ CK19+ population. Data is shown as mean ± SEM with statistical significance determined by unpaired two-tailed t-test. ****p < 0.0001.
Figure 4
Figure 4
iPanEXO Acinar cultures can be infected with SARS-CoV-2 and result in upregulation of some proinflammatory genes. (A) Differentiation and infection timeline for the iPanEXO Acinar cells. Cells were grown 16 days before being infected. Cells were fixed or lysed on the first and third days of infection. (B) Immunocytochemistry staining of SARS-(S) on Day 1 and 3 of mock and infected cells. (C) Quantification of immunocytochemistry images shows significant increase in SARS-(S) positive cells in the population treated with the virus at MOI 0.1. (D) qPCR shows upregulation of SARS-CoV-2 N1 in infected cells. (E) qPCR of inflammation markers CXCL12, NFKB1, and STAT3 show significant upregulation between mock and infected cells on day 3 of infection. Data is shown as mean ± SEM with statistical significance determined by unpaired two-tailed t-test. *p < 0.05, **p < 0.01, ***p < 0.001. Scale bar represents 130 µm, and 10 µm for zoomed panels adjacent to main images. ICC images shown here are representative results from 27 independent sites acquired. RNA was extracted from an aggregate of 6-16 biological replicates (using 96-well plates), and qPCR was run in 3 technical replicates per sample. These results were pooled from 2 independent rounds of infection experiments.
Figure 5
Figure 5
RNAseq analysis of infected iPanEXO cells on days 1 and 3 post infection. (A) Principal Component Analysis of infected and mock samples collected on day 1 and day 3, respectively. (B) Differentially Expressed Genes Heat map showing the relative expression levels of transcripts differentially expressed with adjusted p-values less than 0.01. (C) Volcano plot of the log10 adjusted p-value of each expressed transcript on day 3 versus the log2 fold change. Transcripts that did not demonstrate differential expression with an adjusted p-value of less than 0.05 and a log2 fold-change in either direction greater than 0.5 are plotted in grey. Those that did were sized proportionally to their mean expression level, and genes of interest have been labeled.
Figure 6
Figure 6
RNAseq pathway and cellular component analysis of infected iPanEXO cells on day 3 post infection. (A) Enriched GO Biological Processes: Upregulated biological processes were predicted based on the statistical overrepresentation of upregulated transcripts. The 500 most upregulated genes were submitted to Enrichr, and the Biological Processes in the Gene Ontology database which contained a statistically unlikely fraction of upregulated transcripts were plotted based on the probability of the observed enrichment. The fraction of genes in the gene set which were present in the 500 transcripts under analysis are listed in blue text. (B) Enriched GO Cellular Component: Upregulated and downregulated cellular components were predicted based on the statistical over representation of transcripts associated with these components. Nuclear bodies were predicted to be downregulated based on the presence of 42 out of 618 genes associated with this component in the list of 500 most downregulated transcripts in day 3 infected samples. Cytosolic ribosomes were predicted to be upregulated based on the presence of 31 out of 124 genes associated with this component among the 500 most upregulated transcripts on day 3 when compared to the Gene Expression Omnibus’ cellular component gene sets (Barrett et al., 2013) (C) Enriched COVID19-associated transcripts: Gene sets identified as potentially similar to day 3 infected samples were plotted based on the statistical overrepresentation of the top 500 upregulated and downregulated transcripts.
Figure 7
Figure 7
Post-mortem human pancreas shows SARS-CoV-2 infectivity and co-localization with multiple pancreatic cell types. Immunohistochemistry results from pancreatic tissues of patients with COVID-19 show SARS-CoV-2-Spike S1 staining in green and pancreatic acinar markers in red, such as (A) ii. Chymotrypsin, (B) ii. Amylase; and pancreatic endocrine marker (C) ii. C-peptide. (A–C) i. Corresponding sets of staining on non-COVID patients indicate no SARS-CoV-2-Spike S1 staining. (D) Pancreatic tissues from COVID-19 patients (n=5) and Control subjects (n=6) were utilized for RNA extraction. Real-time qPCR results show increased mRNA expression of ductal markers CA2, CFTR, KRT19 and CFTR. Data is shown as mean ± SEM with statistical significance determined by unpaired two-tailed t-test. *p < 0.05. Scale bar represents 50 µM. IHC was performed in 3 non-COVID controls and 3 COVID patients. The results shown here are representative results from 3-10 independent sites acquired per patient. RNA was extracted from 6 non-COVID controls and 5 COVID patients, and qPCR was run in 3 technical replicates per sample.

Similar articles

Cited by

References

    1. Amin M.. (2021). COVID-19 and the Liver: Overview. Eur. J. Gastroenterol. Hepatol. 68, 309–311. 10.1097/MEG.0000000000001808 - DOI - PMC - PubMed
    1. Apicella M., Campopiano M. C., Mantuano M., Mazoni L., Coppelli A., Del Prato S. (2020) Covid-19 in People With Diabetes: Understanding the Reasons for Worse Outcomes. Lancet Diabetes Endocrinol. 8, 782–792. 10.1016/S2213-8587(20) - DOI - PMC - PubMed
    1. Barrett T., Wilhite S. E., Ledoux P., Evangelista C., Kim I. F., Tomashevsky M., et al. . (2013). Ncbi GEO: Archive for Functional Genomics Data Sets - Update. Nucleic Acids Res. 41, 991–995 10.1093/nar/gks1193 - DOI - PMC - PubMed
    1. Braga L., Ali H., Secco I., Chiavacci E., Neves G., Goldhill D., et al. . (2021). Drugs That Inhibit TMEM16 Proteins Block SARS-CoV-2 Spike-Induced Syncytia. Nature. 10.1038/s41586-021-03491-6 - DOI - PMC - PubMed
    1. Buchrieser J., Dufloo J., Hubert M., Monel B., Planas D., Rajah M. M., et al. . (2020). Syncytia Formation by SARS-CoV-2-Infected Cells. EMBO J. 39, e106267. 10.15252/embj.2020106267 - DOI - PMC - PubMed

Publication types