[Preprint]. 2021 Jul 15:rs.3.rs-664507.
doi: 10.21203/rs.3.rs-664507/v1.

Myeloid cell interferon responses correlate with clearance of SARS-CoV-2

Affiliations

Myeloid cell interferon responses correlate with clearance of SARS-CoV-2

Dhiraj Singh et al. Res Sq. .

Update in

Abstract

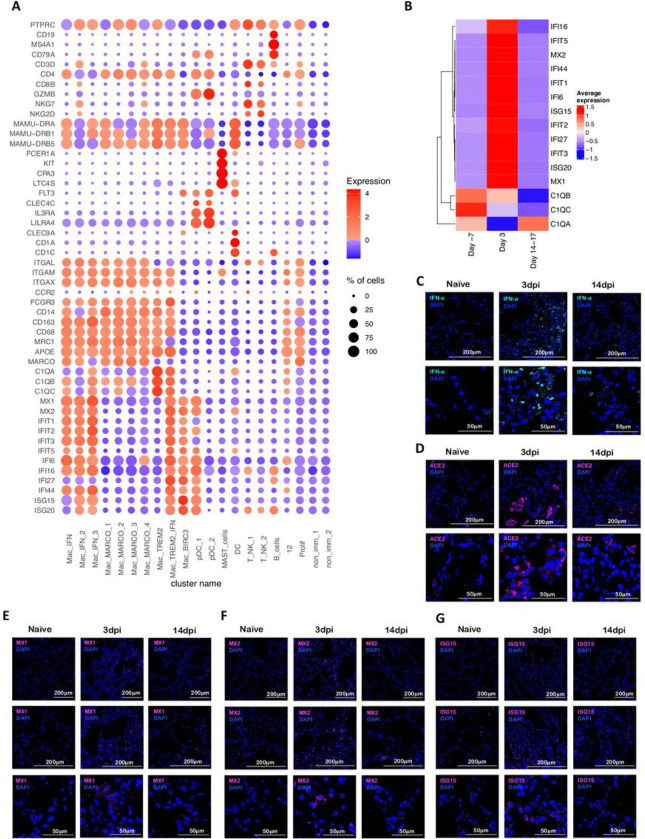
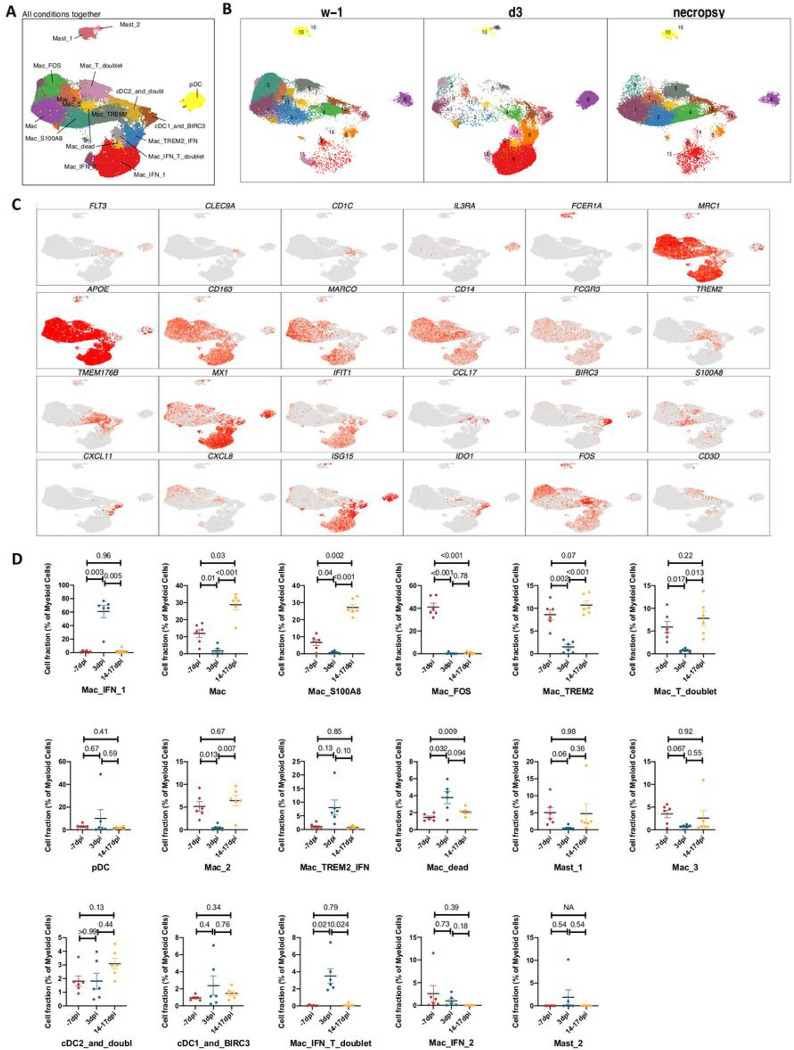
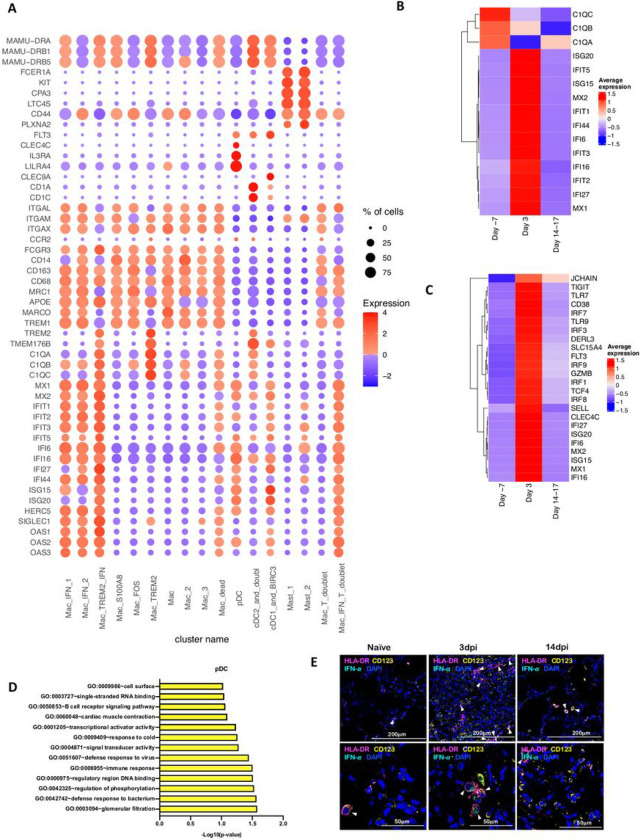
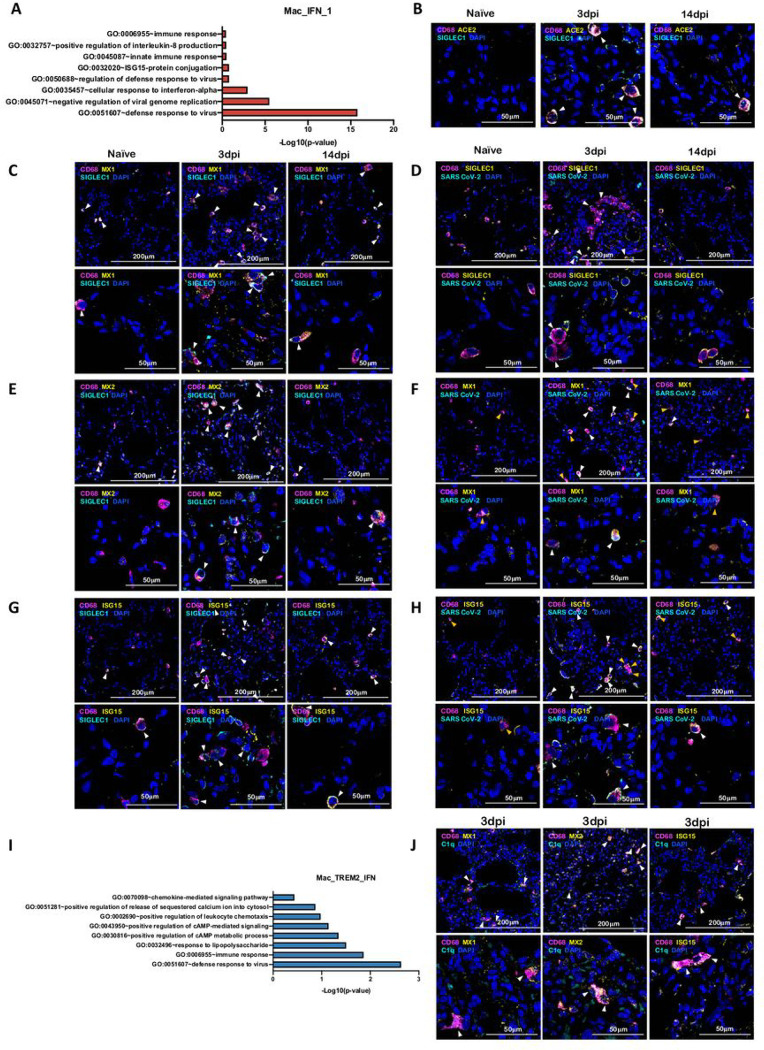
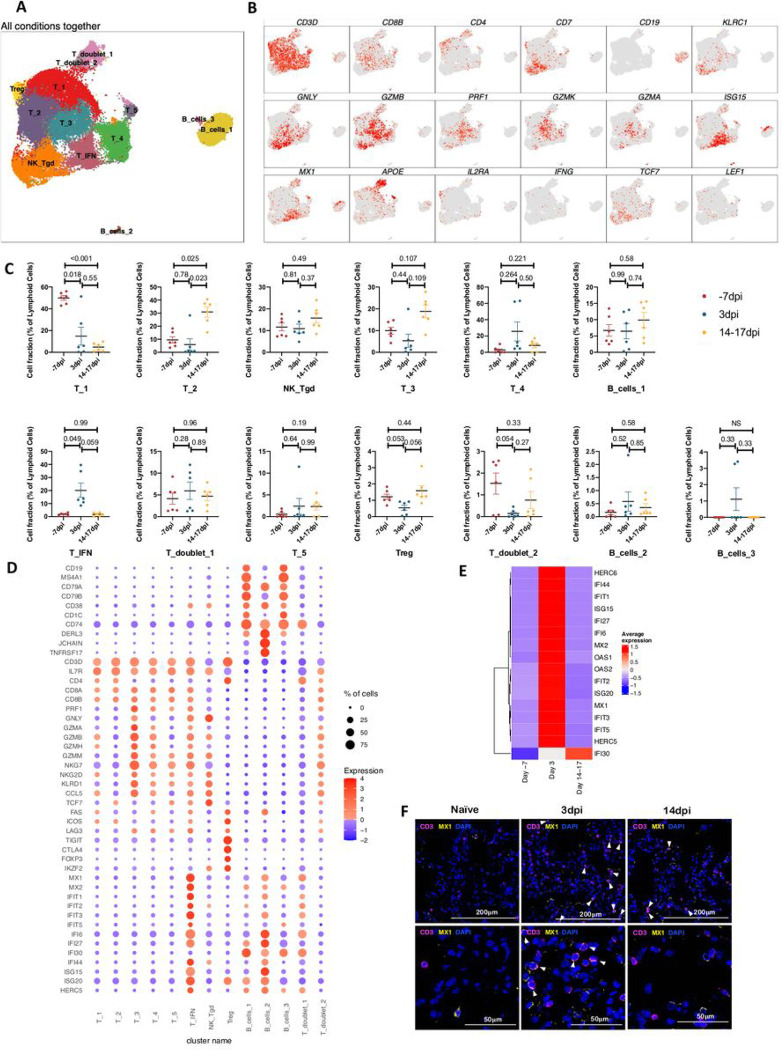
The emergence of mutant SARS-CoV-2 strains associated with an increased risk of COVID-19-related death necessitates better understanding of the early viral dynamics, host responses and immunopathology. While studies have reported immune profiling using single cell RNA sequencing in terminal human COVID-19 patients, performing longitudinal immune cell dynamics in humans is challenging. Macaques are a suitable model of SARS-CoV-2 infection. We performed longitudinal single-cell RNA sequencing of bronchoalveolar lavage (BAL) cell suspensions from adult rhesus macaques infected with SARS-CoV-2 (n=6) to delineate the early dynamics of immune cells changes. The bronchoalveolar compartment exhibited dynamic changes in transcriptional landscape 3 days post- SARS-CoV-2-infection (3dpi) (peak viremia), relative to 14-17dpi (recovery phase) and pre-infection (baseline). We observed the accumulation of distinct populations of both macrophages and T-lymphocytes expressing strong interferon-driven inflammatory gene signature at 3dpi. Type I IFN response was highly induced in the plasmacytoid dendritic cells. The presence of a distinct HLADR+CD68+CD163+SIGLEC1+ macrophage population exhibiting higher angiotensin converting enzyme 2 (ACE2) expression was also observed. These macrophages were significantly recruited to the lungs of macaques at 3dpi and harbored SARS-CoV-2, while expressing a strong interferon-driven innate anti-viral gene signature. The accumulation of these responses correlated with decline in viremia and recovery. The recruitment of a myeloid cell-mediated Type I IFN response is associated with the rapid clearance of SARS-CoV-2 infection in macaques.


Figures

Figure 1
Figure 1
Immune landscape of BAL in SARS-CoV-2 infected macaques. Study outline of scRNAseq analysis of BAL cells from rhesus macaques infected with SARS-CoV-2. BAL single cell suspensions from 6 young rhesus macaques infected with SARS-CoV-2 from pre-infection (−7dpi), 3dpi and endpoint (14–17dpi) were subjected to scRNAseq (A). Immunofluorescence confocal images of the lungs stained with nucleocapsid (N)-specific antibodies (turquoise) and 4,6-diamidino-2-phenylindole (DAPI) (blue). Shown are the images at 10x, 20x and 63x magnification from naïve lungs (uninfected) as well as lungs infected with SARS-CoV-2 at Day 3 and Day 14 post infection (B). UMAP plots of cells from all scRNAseq samples together, colored according to cluster classification (C) or respective timepoints (D). (E) UMAP plots with the expression of markers, characterizing main immune populations. n = 6.
Figure 2
Figure 2
SARS-CoV-2 infection induces IFN responsive gene signature in rhesus macaques. (A) Bubble plot showing the fold change of genes in identified cell clusters and the fraction of cells expressing the gene of interest. (B) Heatmap of key interferon responsive genes at different timepoints. Confocal images validating in vivo expression of IFN-a (turquoise) (C), ACE2 (magenta) (D), MX1 (magenta) (E), MX2 (magenta) (F) and ISG15 (magenta) (G) with DAPI (blue) in the lung sections of Naïve rhesus macaques and SARS-CoV-2 infected lungs at Day 3 and Day 14 post infection.
Figure 3
Figure 3
Myeloid single cell landscape in SARS-CoV-2 infected macaques. BAL myeloid cell dynamics in macaques infected with SARS-CoV-2 by scRNA-seq demonstrates the presence of IFN response in pDCs and IFN-responsive macrophage compartments. (A) UMAP plot of myeloid cells from all scRNA-seq samples together, colored according to (A) cluster classification or respective (B) timepoints. (C) UMAP plots with the expression of markers, characterizing main myeloid populations in macaques. (D) Cell proportion of each cluster per condition. n = 6.
Figure 4
Figure 4
Macrophages and pDCs are the dominant cells driving Type I IFN response in lungs of SARS-CoV-2 infected macaques. (A) Bubble plot showing the fold change of genes in identified myeloid cell clusters and the fraction of cells expressing the gene of interest. (B) Heatmap of key interferon responsive genes at different timepoints in macrophage clusters. (C) Heatmap of key interferon responsive genes at different timepoints in plasmacytoid dendritic cells sub-clusters. (D) GO pathways enriched in upregulated genes in pDCs. (E) Multilabel immunofluorescence confocal images validating in vivo expression of IFN-a (turquoise) in pDCs marked by HLA-DR (magenta) and CD123 (yellow) in Naïve Rhesus macaque lungs as well as at Day 3 and Day 14 post infection with SARS CoV-2. Shown are the images at 20x and 63x magnification.
Figure 5
Figure 5
IFN induced viral defense response in lung macrophages of SARS-CoV-2 infected macaques. (A) GO pathways enriched in upregulated genes in Mac_IFN_1 subcluster. Multilabel immunofluorescence confocal images validating in vivo expression of (B) ACE2 (yellow) and SIGLEC1 (turquoise), and (C) MX1 (yellow) and SIGLEC1 (turquoise) in macrophages (magenta), (D) CD68 (magenta) and SIGLEC1 (yellow) positive macrophages harboring SARS CoV-2 (turquoise), (E) Macrophages (magenta) expressing MX2 (yellow) and SIGLEC1 (turquoise), (F) MX1 (yellow) positive macrophages (magenta) with SARS CoV-2 (turquoise), (G) Macrophages (magenta) expressing ISG15 (yellow) and SIGLEC1 (turquoise), (H) SARS CoV-2 (turquoise) harbored in ISG15 (yellow) expressing macrophages (magenta) in lungs of Naïve and 3 and 14 days post infection of SARS CoV-2 infected macaques. Nuclei stained with DAPI are shown in blue. White arrows represent macrophages expressing ACE2 and SIGLEC1 in (B); MX1 and SIGLEC1 in (C); MX2 and SIGLEC1 in (E); ISG15 and SIGLEC1 in (G). In (D), (F) and (H), white arrows mark the presence of SARS CoV-2 in macrophages expressing SIGLEC1, MX1 and ISG15 respectively; whereas, orange arrows are used to mark SIGLEC1, MX1 and ISG15 expressing macrophages with no SARS CoV-2. (I) GO pathways enriched in upregulated genes in Mac_TREM2_IFN subcluster. (J) Multilabel confocal immunofluorescence images validating in vivo expression of MX1, MX2 and ISG15 (shown in yellow) in TREM2 macrophages in lungs of SARS-CoV-2 infected macaques at 3dpi.
Figure 6
Figure 6
Macrophage interactome model in SARS-CoV-2 infected lungs. Macrophage-Immunocytes interactome. Circos plots showing the ligand-receptor interactions between most abundant macrophage populations and different immune cell in the three conditions studies. (A) Circos plot depicting interaction of Mac_IFN_1 with ambient immunocytes based on ligand-receptor transcript reads at 3dpi. (B) Circos plot depicting interaction of Mac_S100A8 with ambient immunocytes based on ligand-receptor transcript reads at 14–17dpi. (C) Circos plot depicting interaction of Mac_FOS with ambient immunocytes based on ligand-receptor transcript reads at −7dpi.
Figure 7
Figure 7
Lymphoid single cell landscape in SARS-CoV 2 infected macaques. BAL lymphoid cell dynamics in macaques infected with SARS-CoV-2 by scRNA-seq demonstrates the presence of IFN responsive T cells. (A) UMAP plot of lymphoid cells from all scRNA-seq samples together, colored according to cluster classification. (B) UMAP plots with the expression of markers, characterizing main lymphoid populations in macaques. (C) Cell proportion of each cluster per condition. n = 6. (D) Bubble plot showing the fold change of genes in identified lymphoid cell clusters and the fraction of cells expressing the gene of interest. (E) Heatmap of key interferon responsive genes at different timepoints in lymphoid sub clusters. (F) Multilabel immunofluorescence confocal images validating in vivo expression of MX1 (yellow) in T-cells marked by CD3 (magenta) and nuclei (blue) in Naïve as well as SARS CoV-2 infected lungs at 3dpi and 14dpi. White arrows represent T cells expressing MX1.

References

    1. Monaco G. et al. RNA-Seq Signatures Normalized by mRNA Abundance Allow Absolute Deconvolution of Human Immune Cell Types. Cell reports 26, 1627–1640 e1627, doi:10.1016/j.celrep.2019.01.041 (2019). - DOI - PMC - PubMed
    1. Wilson J. A. et al. RNA-Seq analysis of chikungunya virus infection and identification of granzyme A as a major promoter of arthritic inflammation. PLoS pathogens 13, e1006155, doi:10.1371/journal.ppat.1006155 (2017). - DOI - PMC - PubMed
    1. Xiong Y. et al. Transcriptomic characteristics of bronchoalveolar lavage fluid and peripheral blood mononuclear cells in COVID-19 patients. Emerging microbes & infections 9, 761–770, doi:10.1080/22221751.2020.1747363 (2020). - DOI - PMC - PubMed
    1. Singh D. K. et al. Responses to acute infection with SARS-CoV-2 in the lungs of rhesus macaques, baboons and marmosets. Nat Microbiol 6, 73–86, doi:10.1038/s41564-020-00841-4 (2021). - DOI - PMC - PubMed
    1. Rosa B. A. et al. IFN signaling and neutrophil degranulation transcriptional signatures are induced during SARS-CoV-2 infection. Commun Biol 4, 290, doi:10.1038/s42003-021-01829-4 (2021). - DOI - PMC - PubMed

Publication types