. 2021 Nov 16;224(9):1489-1499.
doi: 10.1093/infdis/jiab375.

Kinetics of the Severe Acute Respiratory Syndrome Coronavirus 2 Antibody Response and Serological Estimation of Time Since Infection

Affiliations

Kinetics of the Severe Acute Respiratory Syndrome Coronavirus 2 Antibody Response and Serological Estimation of Time Since Infection

Stéphane Pelleau et al. J Infect Dis. .

Abstract

Background: Infection with severe acute respiratory syndrome coronavirus 2 (SARS-CoV-2) induces a complex antibody response that varies by orders of magnitude between individuals and over time.

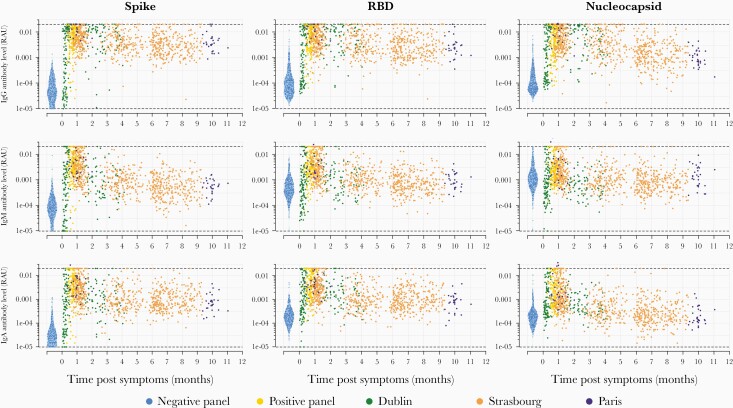
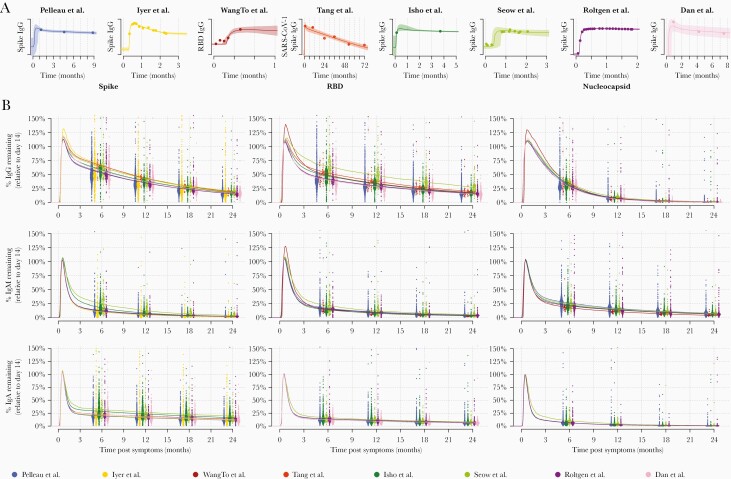
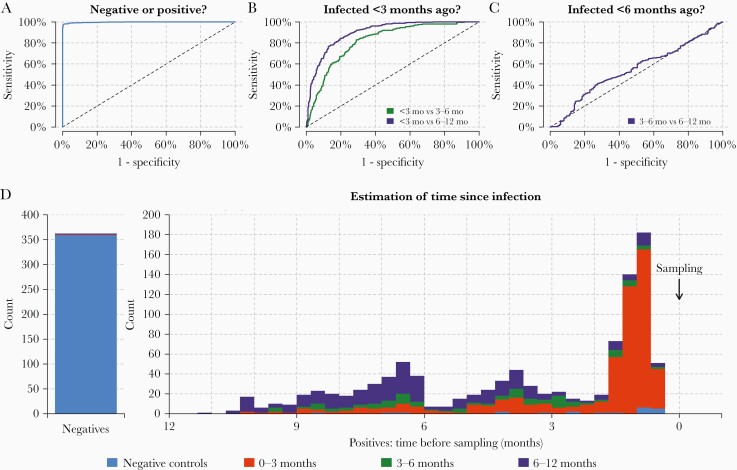
Methods: We developed a multiplex serological test for measuring antibodies to 5 SARS-CoV-2 antigens and the spike proteins of seasonal coronaviruses. We measured antibody responses in cohorts of hospitalized patients and healthcare workers followed for up to 11 months after symptoms. A mathematical model of antibody kinetics was used to quantify the duration of antibody responses. Antibody response data were used to train algorithms for estimating time since infection.

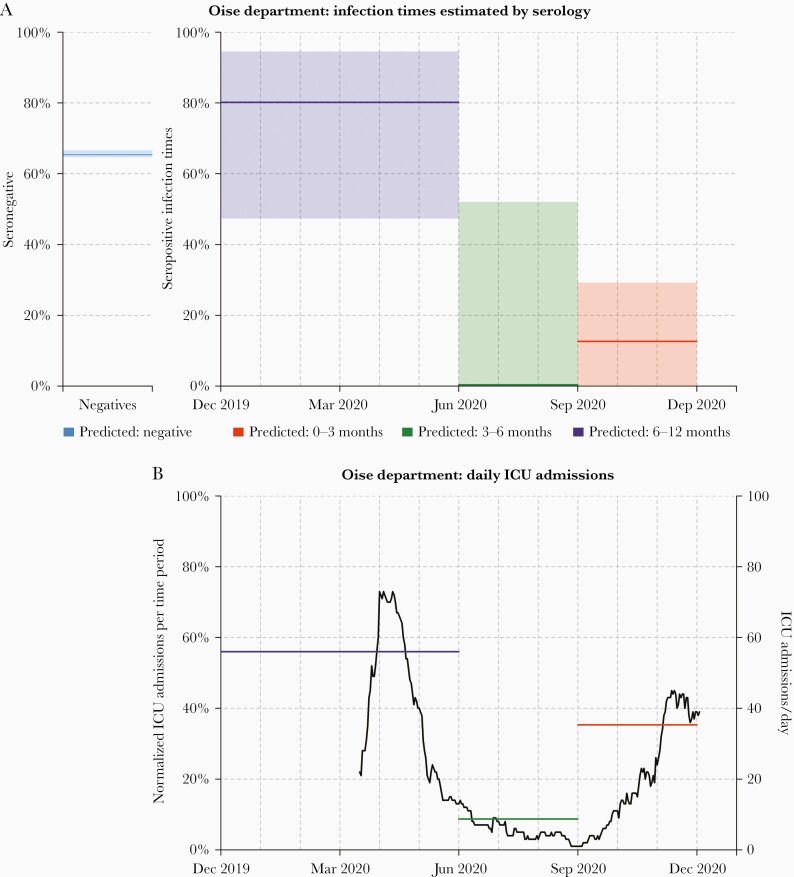
Results: One year after symptoms, we estimate that 36% (95% range, 11%-94%) of anti-Spike immunoglobulin G (IgG) remains, 31% (95% range, 9%-89%) anti-RBD IgG remains, and 7% (1%-31%) of anti-nucleocapsid IgG remains. The multiplex assay classified previous infections into time intervals of 0-3 months, 3-6 months, and 6-12 months. This method was validated using data from a seroprevalence survey in France, demonstrating that historical SARS-CoV-2 transmission can be reconstructed using samples from a single survey.

Conclusions: In addition to diagnosing previous SARS-CoV-2 infection, multiplex serological assays can estimate the time since infection, which can be used to reconstruct past epidemics.

Keywords: SARS-SoV-2; antibody kinetics; seroprevalence; surveillance; time since infection.


Figures

Figure 1.
Figure 1.
Antibody kinetics in the first year following infection with severe acute respiratory syndrome coronavirus 2 (SARS-CoV-2). A bead-based multiplex Luminex assay was used to measure antibodies of multiple isotypes (immunoglobulins G, M, and A) to multiple antigens in serum samples from individuals with polymerase chain reaction–confirmed SARS-CoV-2 infection and prepandemic negative controls. Abbreviations: IgA, immunoglobulin A; IgG, immunoglobulin G; IgM, immunoglobulin M; RAU, relative antibody unit; RBD, receptor-binding domain.
Figure 2.
Figure 2.
Modeled severe acute respiratory syndrome coronavirus 2 (SARS-CoV-2) antibody kinetics. A mathematical model of SARS-CoV-2 antibody kinetics was simultaneously fitted to data from 7 studies of SARS-CoV-2 [6-11] and 1 study of severe acute respiratory syndrome coronavirus (SARS-CoV-1) [12]. A, top row, Examples of the model fit to the data for 1 individual from each study. Data are represented as points, posterior median model prediction as lines, and 95% credible intervals as shaded areas. B, middle and bottom rows, Model-predicted duration of antibodies within the first 2 years following infection. Antibody levels are shown relative to the expected antibody level at day 14 post–symptom onset. Each point represents the prediction from an individual at 6, 12, 18, and 24 months post–symptom onset. The median predictions for each of the 8 studies are presented as lines. Abbreviations: IgA, immunoglobulin A; IgG, immunoglobulin G; IgM, immunoglobulin M; RBD, receptor-binding domain; SARS-CoV-1, severe acute respiratory syndrome coronavirus.
Figure 3.
Figure 3.
Classification of time since previous severe acute respiratory syndrome coronavirus 2 infection. A cross-validated multiway classification algorithm was trained to estimate time since infection. A, The algorithm can differentiate between positive and negative samples. B, The algorithm can classify individuals infected within the previous 3 months. C, There is limited diagnostic power to distinguish between infections that occurred 3–6 months ago vs 6–12 months ago. D, Breakdown of classification performance according to time since previous infection. Colors represent model predicted classification. More than 99% of negative samples are correctly classified as negative (blue). For the positive samples, the distribution shows the time since previous infection. Samples with time since infection <3 months are mostly classified in the category 0–3 months (red). Samples with time since infection >6 months ago are mostly classified in the category 6–12 months (purple). There is a substantial degree of misclassification of samples with time since infection 3–6 months ago. This is due to the temporal imbalance in the training data.
Figure 4.
Figure 4.
Serological reconstruction of past coronavirus disease 2019 transmission in Oise Department, Franch. A, Of 725 samples collected from residents of Oise Department between 13 November and 17 December 2020, 65% (474/725) were severe acute respiratory syndrome coronavirus 2 seronegative. For the 251 seropositive individuals, we estimated that 80.2% (95% confidence interval [CI], 47.3%–94.5%) were infected in the 6 months from December 2019 to May 2020, 0.0% (95% CI, .0%–52.1%) were infected in the 3 months from June to August 2020, and 12.6% (95% CI, .0%–29.2%) were infected in the 3 months from September to November 2020. Proportions are presented as median estimates and do not necessarily sum to 100%. B, Reported intensive care unit (ICU) admissions in Oise Department between 18 March 2020 and 1 December 2020. Of the ICU admissions, 56.0% were reported in the 3 months from March to May, 8.7% were reported in the 3 months from June to August, and 35.3% were reported in the 3 months from September to November.

Similar articles

Cited by

References

    1. Salje H, Tran Kiem C, Lefrancq N, et al. . Estimating the burden of SARS-CoV-2 in France. Science 2020; 369:208–11. - PMC - PubMed
    1. Le Vu S, Jones G, Anna F, et al. . Prevalence of SARS-CoV-2 antibodies in France: results from nationwide serological surveillance. Nat Commun 2021; 12:3025. - PMC - PubMed
    1. Ward H, Cooke G, Atchison C, et al. . Declining prevalence of antibody positivity to SARS-CoV-2: a community study of 365,000 adults. medRxiv [Preprint]. Posted online 27 October 2020. doi:10.1101/2020.10.26.20219725. - DOI
    1. Kagucia EW, Gitonga JN, Kalu C, et al. . Seroprevalence of anti-SARS-CoV-2 IgG antibodies among truck drivers and assistants in Kenya. medRxiv [Preprint]. Posted online 17 February 2021. doi:10.1101/2021.02.12.21251294. - DOI
    1. Rosado J, Pelleau S, Cockram C, et al. . Multiplex assays for the identification of serological signatures of SARS-CoV-2 infection: an antibody-based diagnostic and machine learning study. Lancet Microbe 2021; 2:e60–9. - PMC - PubMed

Publication types

MeSH terms