

Performance of COPD population screener questionnaire in COPD screening: a validation study and meta-analysis
- PMID: 34282697
- PMCID: PMC8293944
- DOI: 10.1080/07853890.2021.1949486
Performance of COPD population screener questionnaire in COPD screening: a validation study and meta-analysis
Abstract
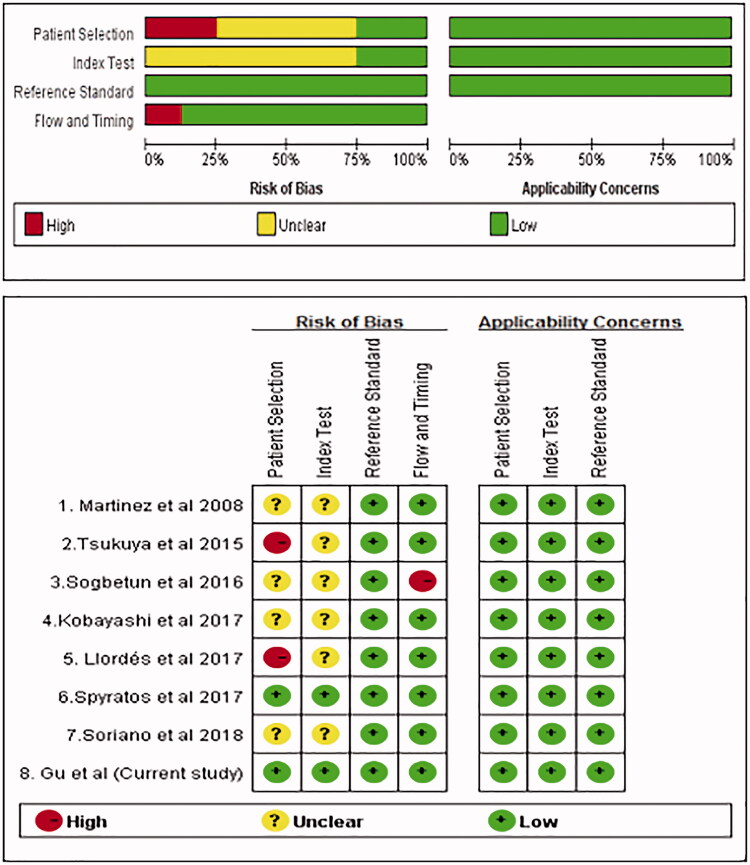
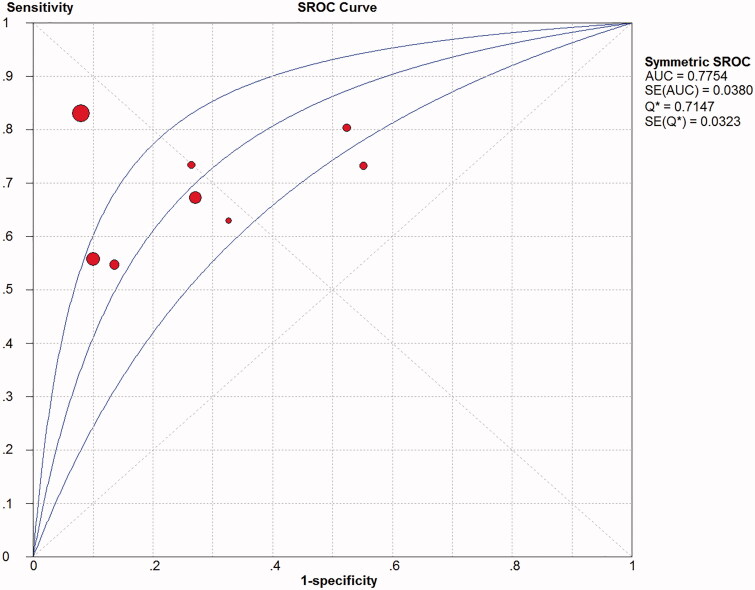
This study aimed to validate the chronic obstructive pulmonary disease (COPD) Population Screener (COPD-PS) questionnaire as a screening tool in a cohort of Chinese subjects who underwent a health examination, and to summarise its overall performance through a meta-analysis. We enrolled 997 subjects aged ≥40 years who underwent a health examination, both lung function and COPD-PS data were collected. The screening performance of COPD-PS was evaluated with a receiver operating characteristic (ROC) curve analysis, using the area under the curve (AUC) to assess the screening accuracy. A standard diagnostic meta-analysis was used to summarise the screening performance of COPD-PS for COPD. Of the 997 subjects, 157 were identified as having COPD. The COPD-PS score was significantly higher in COPD patients than controls (5.03 ± 5.11 vs. 2.72 ± 1.80, p < .001). At a cut-off of 4, the sensitivity and specificity of COPD-PS for identifying COPD were 74.52 and 70.24%, respectively, with an AUC of 0.79. Eight studies (including this study) were included in this meta-analysis. The pooled estimates for COPD-PS were as follows: sensitivity of 0.66 (95% CI: 0.47-0.63), specificity of 0.86 (95% CI: 0.84-0.89), positive likelihood ratio of 3.00 (95% CI: 1.65-5.47), negative likelihood ratio of 0.43 (95% CI: 0.35-0.52) and diagnostic odds ratio of 7.24 (95% CI: 3.91-13.40). The AUC of the summary ROC curve was 0.78. COPD-PS appears to be a useful tool for screening individuals with a high risk of COPD and guiding the selection of individuals for subsequent spirometry examination.KEY MESSAGESCOPD-PS is a simple and useful method to screen COPD.The combination of COPD-PS with other tools may improve the screen performance.
Keywords: chronic obstructive pulmonary disease population screener; Chronic obstructive pulmonary disease; meta-analysis; screening.
Conflict of interest statement
The authors report no conflicts of interest.
Figures


Similar articles
-
Validation of a COPD screening questionnaire and establishment of diagnostic cut-points in a Japanese general population: the Hisayama study.Allergol Int. 2015 Jan;64(1):49-53. doi: 10.1016/j.alit.2014.06.002. Epub 2014 Dec 17. Allergol Int. 2015. PMID: 25572558
-
Comparing the Performance of Two Screening Questionnaires for Chronic Obstructive Pulmonary Disease in the Chinese General Population.Int J Chron Obstruct Pulmon Dis. 2023 Apr 10;18:541-552. doi: 10.2147/COPD.S403603. eCollection 2023. Int J Chron Obstruct Pulmon Dis. 2023. PMID: 37065634 Free PMC article.
-
Comparison of the COPD Population Screener and International Primary Care Airway Group questionnaires in a general Japanese population: the Hisayama study.Int J Chron Obstruct Pulmon Dis. 2016 Aug 16;11:1903-9. doi: 10.2147/COPD.S110429. eCollection 2016. Int J Chron Obstruct Pulmon Dis. 2016. PMID: 27574414 Free PMC article.
-
Accuracy of portable spirometers in the diagnosis of chronic obstructive pulmonary disease A meta-analysis.NPJ Prim Care Respir Med. 2022 Apr 19;32(1):15. doi: 10.1038/s41533-022-00275-x. NPJ Prim Care Respir Med. 2022. PMID: 35440665 Free PMC article. Review.
-
Predictive validity of the Developmental Coordination Disorder Questionnaire as a screening tool to identify motor skill problems: A systematic review and meta-analysis.Res Dev Disabil. 2024 Jul;150:104748. doi: 10.1016/j.ridd.2024.104748. Epub 2024 May 13. Res Dev Disabil. 2024. PMID: 38744072
Cited by
-
Current Progress of COPD Early Detection: Key Points and Novel Strategies.Int J Chron Obstruct Pulmon Dis. 2023 Jul 19;18:1511-1524. doi: 10.2147/COPD.S413969. eCollection 2023. Int J Chron Obstruct Pulmon Dis. 2023. PMID: 37489241 Free PMC article. Review.
-
Chronic obstructive pulmonary disease burden, grades and erythrocytosis at a tertiary hospital in western Uganda.BMC Pulm Med. 2024 Mar 6;24(1):119. doi: 10.1186/s12890-024-02944-8. BMC Pulm Med. 2024. PMID: 38448860 Free PMC article.
-
Machine learning-assisted construction of COPD self-evaluation questionnaire (COPD-EQ): a national multicentre study in China.J Glob Health. 2025 Jan 3;15:04052. doi: 10.7189/jogh.15.04052. J Glob Health. 2025. PMID: 39749754 Free PMC article.
-
The Relationship Between BMI and Lung Function in Populations with Different Characteristics: A Cross-Sectional Study Based on the Enjoying Breathing Program in China.Int J Chron Obstruct Pulmon Dis. 2022 Oct 18;17:2677-2692. doi: 10.2147/COPD.S378247. eCollection 2022. Int J Chron Obstruct Pulmon Dis. 2022. PMID: 36281228 Free PMC article.
-
Treatment patterns for chronic obstructive pulmonary disease under the tiered medical system.Sci Rep. 2025 Jan 4;15(1):844. doi: 10.1038/s41598-024-85010-x. Sci Rep. 2025. PMID: 39755745 Free PMC article.
References
-
- Rabe KF, Watz H.. Chronic obstructive pulmonary disease. Lancet. 2017;389(10082):1931–1940. - PubMed
-
- Wang C, Xu J, Yang L, et al. Prevalence and risk factors of chronic obstructive pulmonary disease in China (the China Pulmonary Health [CPH] study): a national cross-sectional study. Lancet. 2018;391(10131):1706–1717. - PubMed
-
- Singh D, Agusti A, Anzueto A, et al. Global strategy for the diagnosis, management, and prevention of chronic obstructive lung disease: the GOLD science committee report 2019. Eur Respir J. 2019;53(5):1900164. - PubMed
-
- Zheng J. A nationwide questionnaire survey on clinical application of pulmonary function testing in China. Zhonghua Jie He He Hu Xi Za Zhi. 2002;25(2):69–73. - PubMed
Publication types
MeSH terms
LinkOut - more resources
Full Text Sources
Other Literature Sources
Medical