. 2022 Apr;18(4):726-744.
doi: 10.1080/15548627.2021.1954348. Epub 2021 Jul 20.

CAMK2/CaMKII activates MLKL in short-term starvation to facilitate autophagic flux

Affiliations

CAMK2/CaMKII activates MLKL in short-term starvation to facilitate autophagic flux

Qionghui Zhan et al. Autophagy. 2022 Apr.

Abstract

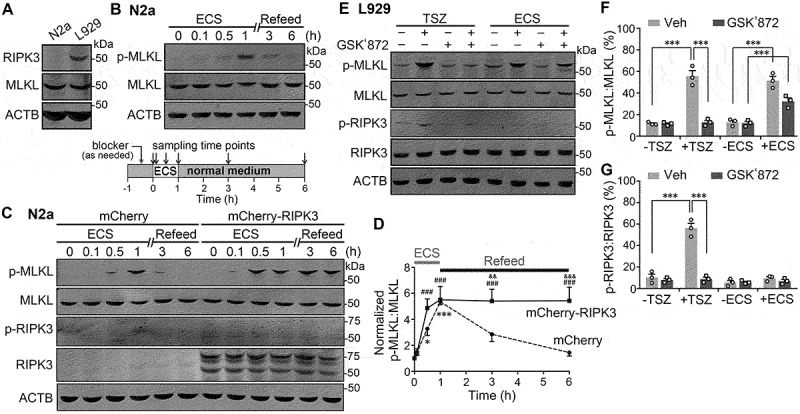
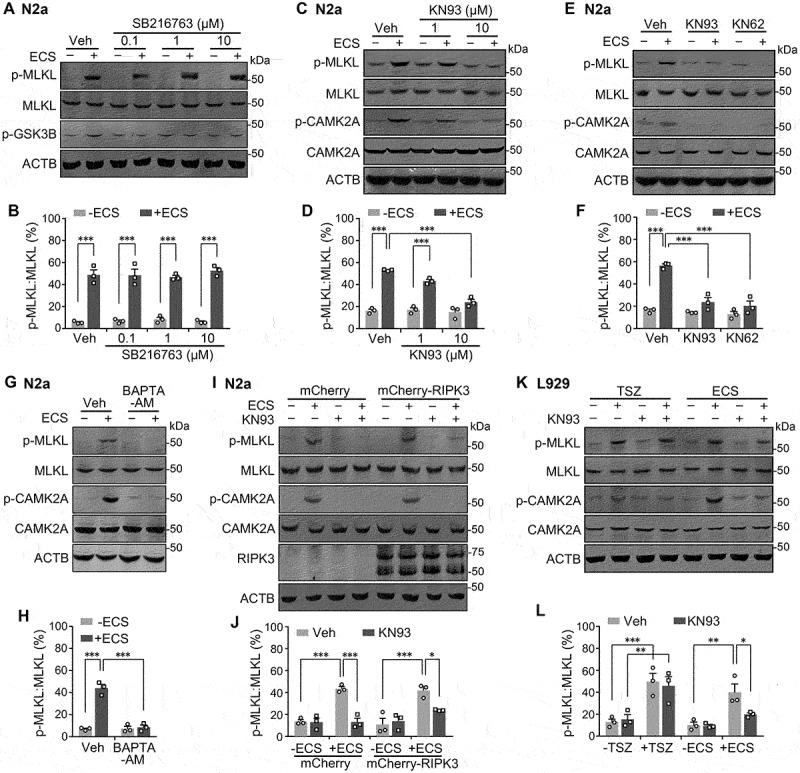
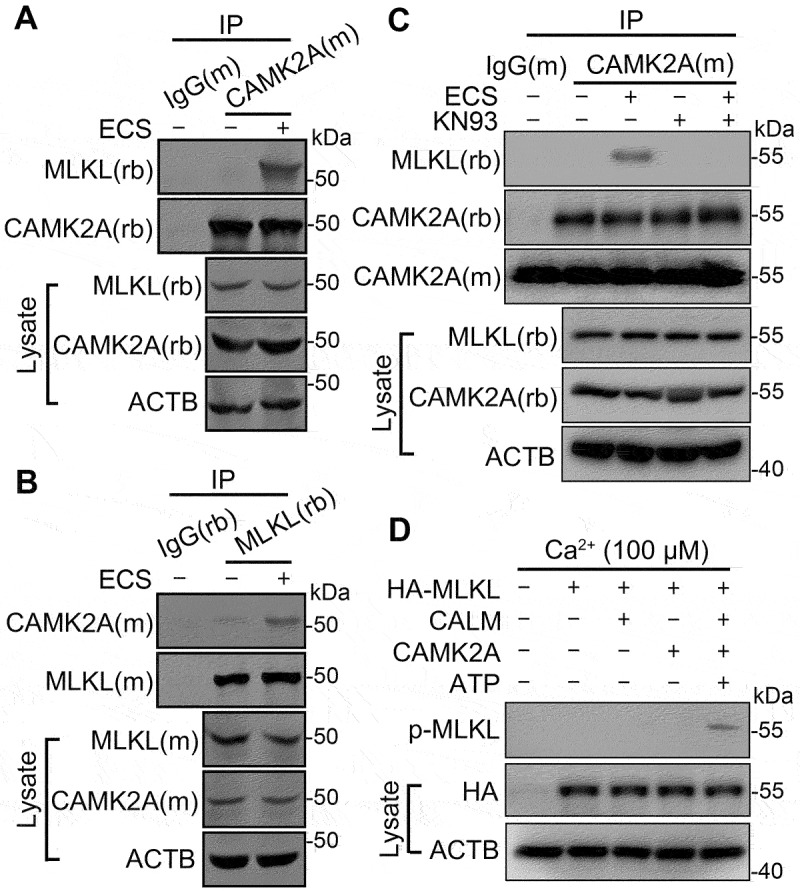
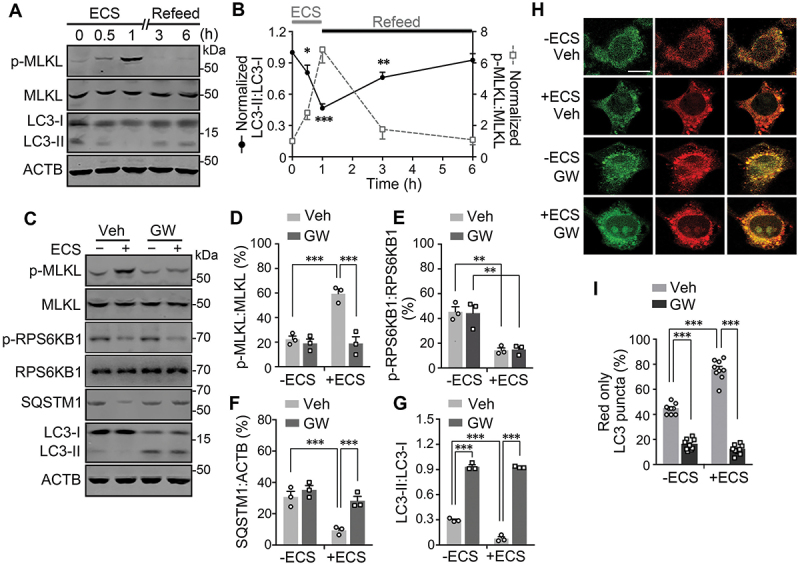
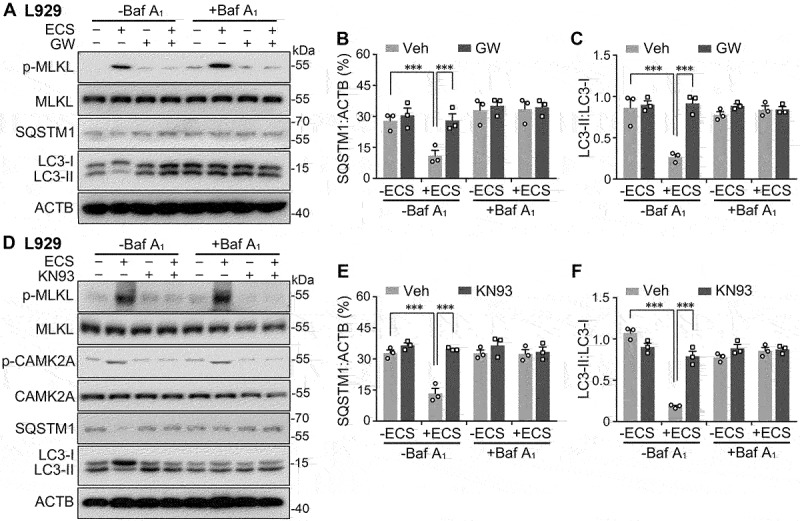
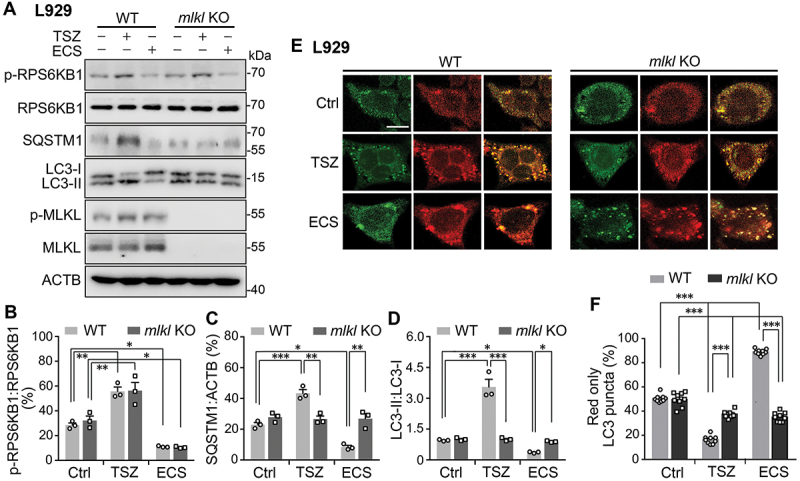
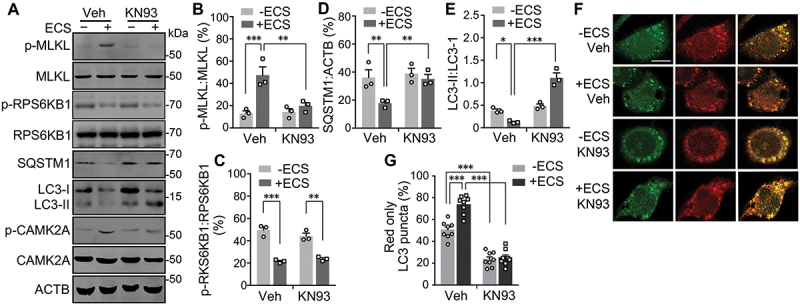
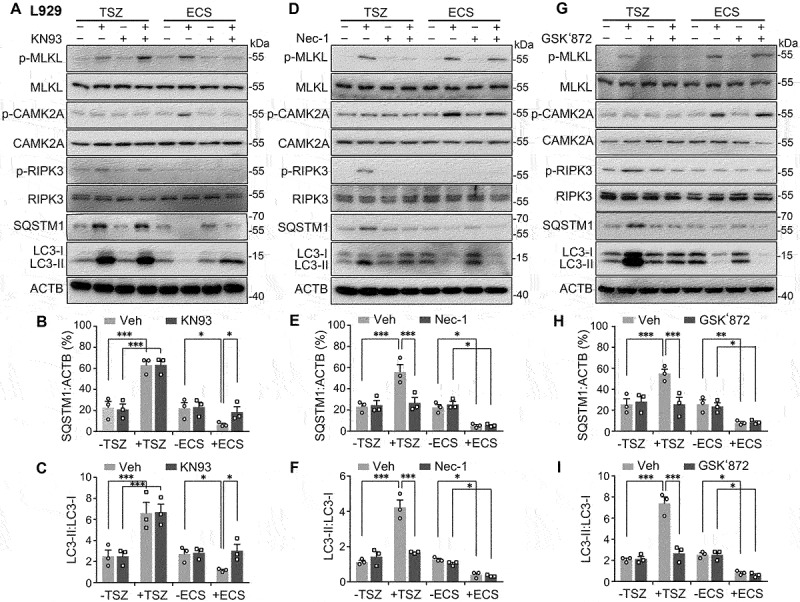
MLKL (mixed lineage kinase domain like pseudokinase) is a well-known core component of necrosome that executes necroptotic cell death upon phosphorylation by RIPK3 (receptor interacting serine/threonine kinase 3). Recent studies also implicate a role of MLKL in endosomal trafficking, which is not always dependent on RIPK3. Using mouse Neuro-2a and L929 as well as human HEK293 and HT29 cells, we show here that MLKL is phosphorylated in response to serum and amino acid deprivation from the culture medium, in a manner that depends on CAMK2/CaMKII (calcium/calmodulin dependent protein kinase II) but not RIPK3. The starvation-induced increase in MLKL phosphorylation was accompanied by decreases in levels of lipidated MAP1LC3B/LC3B (microtubule associated protein 1 light chain 3 beta; LC3-II) and SQSTM1/p62 (sequestosome 1), markers of autophagosomes. These changes were prevented by disrupting either MLKL or CAMK2 by pharmacology and genetic manipulations. Moreover, disrupting MLKL or CAMK2 also inhibited the incorporation of LC3-II into autolysosomes, demonstrating a role of the CAMK2-MLKL pathway in facilitating autophagic flux during short-term starvation, in contrast to necroptosis which suppressed autophagic flux. Furthermore, unlike the necroptotic pathway, the starvation-evoked CAMK2-mediated MLKL phosphorylation protected cells from starvation-induced death. We propose that upon nutrient deprivation, MLKL is activated by CAMK2, which in turn facilitates membrane scission needed for autophagosome maturation, allowing the proper fusion of the autophagosome with lysosome and the subsequent substance degradation. This novel function is independent of RIPK3 and is not involved in necroptosis, implicating new roles for this pseudokinase in cell survival, signaling and metabolism.Abbreviations: CAMK2/CaMKII: calcium/calmodulin dependent protein kinase II; DIABLO/SMAC: direct inhibitor of apoptosis-binding protein with low pI/second mitochondria-derived activator of caspase; ECS: extracellular solution; ESCRT: endosomal sorting complexes required for transport; FBS: fetal bovine serum; GSK3B: glycogen synthase kinase 3 beta; HBSS: Hanks' balanced salt solution; KO: knockout; LC3-II: lipidated microtubule associated protein 1 light chain 3 beta; LDH: lactate dehydrogenase; MLKL: mixed lineage kinase domain like pseudokinase; MTOR: mechanistic target of rapamycin kinase; MTORC1: MTOR complex 1; N2a: Neuro-2a neuroblastoma; Nec-1: necrostatin-1; NSA: necrosulfonamide; PBS: phosphate-buffered saline; PI: propidium iodide; PK-hLC3: pHluorin-mKate2-human LC3; RIPK1: receptor interacting serine/threonine kinase 1; RIPK3: receptor interacting serine/threonine kinase 3; ROS: reactive oxygen species; RPS6KB1/S6K: ribosomal protein S6 kinase B1; shRNA: short hairpin RNA; siRNA: small interference RNA; SQSTM1/p62: sequestosome 1; TBS: Tris-buffered saline; TNF/TNF-α: tumor necrosis factor; TSZ, treatment with TNF + DIABLO mimetics + z-VAD-FMK.

Keywords: Autophagosome; Ca2+/calmodulin-dependent kinase II; RIPK3; lysosome; macroautophagy; necroptosis; nutrient deprivation.


Conflict of interest statement

No potential conflict of interest was reported by the author(s).

Figures

Figure 1.
Figure 1.
Starvation causes MLKL phosphorylation independently of RIPK3. (A) Western blots showing endogenous expression of RIPK3 and MLKL in N2a and L929 cells, with ACTB used as the loading control. Cell lysates from N2a and L929 cells were used. (B) Western blots for levels of phospho-MLKL (p-MLKL) and total MLKL in N2a cells treated with extracellular solution (ECS), representing serum and amino acid deprivation, for 0, 0.1, 0.5 and 1 h. After the 1-h starvation, the cells were returned to the regular culture medium (Refeed) for 2 and 5 h, indicated as 3 and 6 total hours, respectively, counting from the beginning of the ECS treatment (see inset below blots for protocol). (C) Similar to (B) but N2a cells were transiently transfected with either mCherry (control) or mCherry-RIPK3. The phospho-RIPK3 (p-RIPK3) and total RIPK3 levels were also assessed by western blotting. Note the cleavage products of mCherry-RIPK3 are about the size of untagged RIPK3 (~55 kD) and detected in all samples from mCherry-RIPK3-transfected cells but not those from mCherry-transfected cells. p-RIPK3 was very weakly detected in mCherry-RIPK3-transfected cells but not mCherry-transfected ones. (D) Time courses of normalized p-MLKL:MLKL ratios during starvation (ECS) and nutrient refeed in N2a cells that expressed mCherry (dashed lines) or mCherry-RIPK3 (solid lines). Data are presented as means ± SEM from n = 3 independent experiments. * P < 0.05, *** P < 0.001 vs. time zero for mCherry-transfected, ### P < 0.001 vs. time zero for mCherry-RIPK3 transfected, && P < 0.01, &&& P < 0.001 vs. mCherry-transfected at the corresponding time points, by two-way ANOVA followed by Bonferroni’s multiple comparisons test. (E) Western blots for levels of p-MLKL, MLKL, p-RIPK3, and total RIPK3 in L929 cells untreated (-) or treated (+) with either necroptosis inducers, TNF, SMAC mimetic, and z-VAD-FMK (TSZ) for 6 h, or ECS for 3 h. For some samples, GSK’872 (3 µM), a RIPK3 inhibitor, was added 0.5 h before and present during the treatment. (F and G) p-MLKL:MLKL (F) and p-RIPK3:RIPK3 (G) ratios for conditions shown in (E). Individual data points and means ± SEM of n = 3 experiments are shown. Veh, vehicle control for GSK’872. *** P < 0.001.
Figure 2.
Figure 2.
CAMK2 is involved in starvation-induced MLKL phosphorylation. (A) Western blots for levels of p-MLKL, MLKL, and phospho-GSK3B (p-GSK3B) in N2a cells unstarved (-ECS) or starved in ECS for 1 h. GSK3B inhibitor, SB216763 (0.1, 1 and 10 µM), was added at 0.5 h before and present during the starvation. Note, all three SB216763 concentrations suppressed the starvation-induced increase in p-GSK3B, but not p-MLKL. (B) p-MLKL:MLKL ratios for conditions shown in (A). Individual data points and means ± SEM of n = 3 experiments are shown. *** P < 0.001. (C) Western blots for levels of p-MLKL, MLKL, phospho-CAMK2A (p-CAMK2A), and total CAMK2A in N2a cells unstarved (-ECS) or starved in ECS for 1 h. CAMK2 inhibitor, KN93 (1 and 10 µM), was added at 0.5 h before and present during the starvation. (D) p-MLKL:MLKL ratios for conditions shown in (C). Individual data points and means ± SEM of n = 3 experiments are shown. *** P < 0.001. (E and F) Similar to (C and D), but CAMK2 inhibitors, KN93 and KN62 (both 10 µM), were used. (G and H) Similar to (C and D), but BAPTA-AM (200 µM) was used in place of KN93. (I) Western blots for levels of p-MLKL, MLKL, p-CAMK2A, CAMK2A, and RIPK3 in N2a cells transiently transfected with mCherry or mCherry-RIPK3. Cells were unstarved (-ECS) or starved in ECS for 1 h in the absence or presence of KN93 (10 µM), added at 0.5 h before and present during the starvation. (J) p-MLKL:MLKL ratios for conditions shown in (I). Individual data points and means ± SEM of n = 3 experiments are shown. * P < 0.05, *** P < 0.001. (K) Western blots for levels of p-MLKL, MLKL, p-CAMK2A, and CAMK2A in L929 cells untreated (-) or treated (+) with either TSZ for 6 h or ECS for 3 h, in the absence or present of KN93 (10 µM), added at 0.5 h before and present during the TSZ and ECS treatment. (L) p-MLKL:MLKL ratios for conditions shown in (K). Individual data points and means ± SEM of n = 3 experiments are shown. * P < 0.05, ** P < 0.01, *** P < 0.001.
Figure 3.
Figure 3.
Starvation induces CAMK2A-MLKL association in a protein complex. (A and B) Cell lysates from N2a cells untreated or treated with ECS for 1 h were subject to immunoprecipitation (IP) by IgG, or anti-CAMK2A (A) or anti-MLKL (B) antibody, followed by western blotting for MLKL and CAMK2A. (M) and (rb) denote the antibody host species as mouse and rabbit, respectively. The reciprocal co-immunoprecipitation showed increased association between CAMK2 and MLKL following starvation. (C) As in (A) but the cells were treated with KN93 (10 µM) as indicated. The blot by the mouse anti-CAMK2A antibody (CAMK2A[m]) shows the presence of antibody heavy chain in IP products from both IgG(m) and CAMK2A(m). However, the rabbit anti-CAMK2A antibody (CAMK2A[rb]) only revealed bands in this area for IP products from CAMK2A(m), but not that from IgG(m), indicating no cross reactivity of the secondary antibody. (D) In vitro kinase assay showing MLKL phosphorylation by recombinant CAMK2A. HA-MLKL purified by IP from transfected N2a cells was incubated with CALM, CAMK2A and ATP as indicated in a kinase buffer. The samples were subject to western blotting by the p-MLKL antibody. HA and ACTB were also measured from the cell lysates.
Figure 4.
Figure 4.
MLKL activation facilitates starvation-induced substance degradation. (A) Western blots for levels of p-MLKL, MLKL, LC3-I and LC3-II in N2a cells treated with ECS for 0, 0.5 and 1 h. After the 1 h starvation, the cells were returned to the regular culture medium (Refeed) for 2 and 5 h, indicated as 3 and 6 total hours, respectively, counting from the beginning of the ECS treatment. (B) Time courses of normalized LC3-II:LC3-I (solid black) and p-MLKL:MLKL (dashed gray) ratios during starvation (ECS) and nutrient refeed in N2a cells. Data are presented as means ± SEM from n = 3 independent experiments. * P < 0.05, ** P < 0.01, *** P < 0.001 vs. zero time point for LC3-II:LC3-I, by one-way ANOVA followed by Dunnett’s multiple comparisons test. (C) Western blots for levels of p-MLKL, MLKL, phospho- RPS6KB1 (p-RPS6KB1), total RPS6KB1, SQSTM1, LC3-I, and LC3-II in N2a cells untreated (-) or treated (+) with ECS for 1 h. Vehicle (Veh) or GW806742X (GW, 1 µM) was added at 0.5 h before and present during the treatment. (D-G) p-MLKL:MLKL (D), p-RPS6KB1:RPS6KB1 (E), SQSTM1:ACTB (F), and LC3-II:LC3-I (G) ratios for conditions shown in (C). Individual data points and means ± SEM of n = 3 experiments are shown. ** P < 0.01, *** P < 0.001. (H) Representative single z-section confocal fluorescence images of N2a cells expressing PK-hLC3. The cells were unstarved (-ECS) or starved in ECS for 1 h in the absence (Veh) or presence of 1 µM GW. Scale bar: 10 µm. (I) % LC3 puncta displaying only red fluorescence signals for cells treated as in (H). Shown are individual data points and means ± SEM of n = 9 cells from 3 independent experiments, each with 3 cells. *** P < 0.001.
Figure 5.
Figure 5.
Starvation enhances autophagic flux in a manner that depends on MLKL and CAMK2A activity. (A) Western blots for levels of p-MLKL, MLKL, SQSTM1, LC3-I, and LC3-II, in L929 cells untreated (-) or treated (+) with ECS for 3 h. Vehicle (Veh), bafilomycin A1 (Baf A1, 0.1 µM), and GW806742X (GW, 1 µM) were added at 0.5 h before and present during the treatment. (B and C) SQSTM1:ACTB (B) and LC3-II:LC3-I (C) ratios for conditions shown in (A). Individual data points and means ± SEM of n = 3 experiments are shown. * P < 0.05, *** P < 0.001. (D) Western blots for levels of p-MLKL, MLKL, p-CAMK2A, CAMK2A, SQSTM1, LC3-I, and LC3-II in L929 cells untreated (-) or treated (+) with ECS for 3 h. Vehicle (Veh), Baf A1 (0.1 µM), and KN93 (10 µM) were added at 0.5 h before and present during the treatment. (E and F) SQSTM1:ACTB (E) and LC3-II:LC3-I (F) ratios for conditions shown in (D). Individual data points and means ± SEM of n = 3 experiments are shown. *** P < 0.001.
Figure 6.
Figure 6.
Necroptosis inhibits autophagic flux while starvation enhances it, and both are abolished by the knockout of MLKL from L929 cells. (A). Western blots for levels of p-RPS6KB1, RPS6KB1, SQSTM1, LC3-I, LC3-II, p-MLKL, and MLKL in wild type (WT) and mlkl knockout (KO) L929 cells. Cells were untreated (Ctrl) or treated with either TSZ for 6 h or ECS for 3 h. Note the complete lack of p-MLKL and MLKL immunoreactivity in mlkl KO cells. (B-D) p-RPS6KB1:RPS6KB1 (B), SQSTM1:ACTB (C), and LC3-II:LC3-I (D) ratios for conditions shown in (A). Note the increases induced by TSZ and decreases caused by ECS in WT cells. The lack of MLKL abolished the effects on SQSTM1 and LC3-II:LC3-I ratio by both TSZ and ECS but had no impact on the changes in the p-RPS6KB1:RPS6KB1 ratio. Individual data points and means ± SEM of n = 3 experiments are shown. * P < 0.05; ** P < 0.01, *** P < 0.001. (E) Representative single z-section confocal fluorescence images of WT and mlkl KO L929 cells transfected with PK-hLC3. The cells were untreated (Ctrl) or treated with either TSZ for 6 h or ECS for 3 h. Scale bar: 10 µm. (F) % LC3 puncta displaying only red fluorescence signals for cells treated as in (E). Shown are individual data points and means ± SEM of n = 9 cells from 3 independent experiments, each with 3 cells. *** P < 0.001.
Figure 7.
Figure 7.
CAMK2 activity is required for starvation-induced substance degradation. (A) Western blots for levels of p-MLKL, MLKL, p-RPS6KB1, RPS6KB1, SQSTM1, LC3-I, LC3-II, p-CAMK2A, and CAMK2A in N2a cells untreated (-) or treated (+) with ECS for 1 h. Vehicle (Veh) or KN93 (10 µM) was added at 0.5 h before and present during the starvation. (B-E) p-MLKL:MLKL (B), p-RPS6KB1:RPS6KB1 (C), SQSTM1:ACTB (D), and LC3-II:LC3-I (E) ratios for conditions shown in (A). Individual data points and means ± SEM of n = 3 experiments are shown. * P < 0.05, ** P < 0.01, *** P < 0.001. (F) Representative single z-section confocal fluorescence images of N2a cells unstarved (-ECS) or starved in ECS for 1 h in the absence (Veh) or presence of 10 µM KN93. Scale bar: 10 µm. (G) % LC3 puncta displaying only red fluorescence signals for cells treated as in (F). Shown are individual data points and means ± SEM of n = 9 cells from 3 independent experiments, each with 3 cells. *** P < 0.001.
Figure 8.
Figure 8.
Necroptosis and starvation exert opposite effects on autophagic flux in L929 cells via MLKL phosphorylation by using two distinct pathways. (A, D, and G) Western blots for levels of p-MLKL, MLKL, p-CAMK2A, CAMK2A, p-RIPK3, RIPK3, SQSTM1, LC3-I, and LC3-II in L929 cells. Cells were untreated (-) or treated (+) with either TSZ for 6 h or ECS for 3 h. KN93 (10 µM, A), Nec-1 (30 µM, D), or GSK’872 (3 µM, G) was added at 0.5 h before and present during the treatment. For each set, vehicle (Veh) was added as a negative control. Note KN93 only blocked the changes induced by ECS, whereas Nec-1 and GSK’872 just suppressed that caused by TSZ. (B and C) SQSTM1:ACTB (B) and LC3-II:LC3-I (C) ratios for conditions shown in (A). (E and F) SQSTM1:ACTB (E) and LC3-II:LC3-I (F) ratios for conditions shown in (D). (H and I) SQSTM1:ACTB (H) and LC3-II:LC3-I (I) ratios for conditions shown in (G). Individual data points and means ± SEM of n = 3 experiments are shown. * P < 0.05; ** P < 0.01, *** P < 0.001.
Figure 9.
Figure 9.
Starvation-induced MLKL phosphorylation does not cause cell death. (A) Western blots for levels of p-MLKL and MLKL in wild type (WT) L929 cells untreated or treated with either TSZ for 6 h or ECS for 3 h. GW806742X (GW, 1 µM) was included in some samples as indicated 0.5 h before and during the treatment. (B) p-MLKL:MLKL ratios for conditions shown in (A). Individual data points and means ± SEM of n = 3 experiments are shown. Veh, vehicle control for GW. *** P < 0.001. (C) Representative phase-contrast and fluorescence images of WT L929 cells untreated (Ctrl) or treated with either TSZ or ECS as in (A). After the treatment, cells were cultured for 6 h in normal culture medium and then stained with propidium iodide (PI) to label necrotic cells (red). Scale bar: 50 µm. (D) Percent of PI-positive L929 cells treated as in (C). Shown are individual data points and means ± SEM of n = 9 fields of view from 3 independent experiments, each with 3 fields. *** P < 0.001. (E) Lactate dehydrogenase (LDH) activity (mU/ml) measured from cells treated as in (C), except no PI staining was performed. Shown are individual data points and means ± SEM of n = 9 experiments. *** P < 0.001. (F-H) Similar to (C-E), but with the use of ripk1 KO L929 cells. * P < 0.05. (I-K) Similar to (C-E), but with the use of ripk3 KO L929 cells. ** P < 0.01. (L-N) Similar to (C-E), but with the use of mlkl KO L929 cells. *** P < 0.001. Note, in the absence of MLKL, starvation increased cell death and the effect was not blocked by GW806742X.

Similar articles

Cited by

References

    1. Sun L, Wang H, Wang Z, et al. Mixed lineage kinase domain-like protein mediates necrosis signaling downstream of RIP3 kinase. Cell. 2012;148:213–227. - PubMed
    1. Murphy JM, Czabotar PE, Hildebrand JM, et al. The pseudokinase MLKL mediates necroptosis via a molecular switch mechanism. Immunity. 2013;39:443–453. - PubMed
    1. Wang H, Sun L, Su L, et al. Mixed lineage kinase domain-like protein MLKL causes necrotic membrane disruption upon phosphorylation by RIP3. Mol Cell. 2014;54:133–146. - PubMed
    1. Dondelinger Y, Declercq W, Montessuit S, et al. MLKL compromises plasma membrane integrity by binding to phosphatidylinositol phosphates. Cell Rep. 2014;7:971–981. - PubMed
    1. Tanzer MC, Matti I, Hildebrand JM, et al. Evolutionary divergence of the necroptosis effector MLKL. Cell Death Differ. 2016;23:1185–1197. - PMC - PubMed

Publication types

MeSH terms