

Medical Debt in the US, 2009-2020
- PMID: 34283184
- PMCID: PMC8293024
- DOI: 10.1001/jama.2021.8694
Medical Debt in the US, 2009-2020
Abstract
Importance: Medical debt is an increasing concern in the US, yet there is limited understanding of the amount and distribution of medical debt, and its association with health care policies.
Objective: To measure the amount of medical debt nationally and by geographic region and income group and its association with Medicaid expansion under the Affordable Care Act.
Design, setting, and participants: Data on medical debt in collections were obtained from a nationally representative 10% panel of consumer credit reports between January 2009 and June 2020 (reflecting care provided prior to the COVID-19 pandemic). Income data were obtained from the 2014-2018 American Community Survey. The sample consisted of 4.1 billion person-month observations (nearly 40 million unique individuals). These data were used to estimate the amount of medical debt (nationally and by geographic region and zip code income decile) and to examine the association between Medicaid expansion and medical debt (overall and by income group).
Exposures: Geographic region (US Census region), income group (zip code income decile), and state Medicaid expansion status.
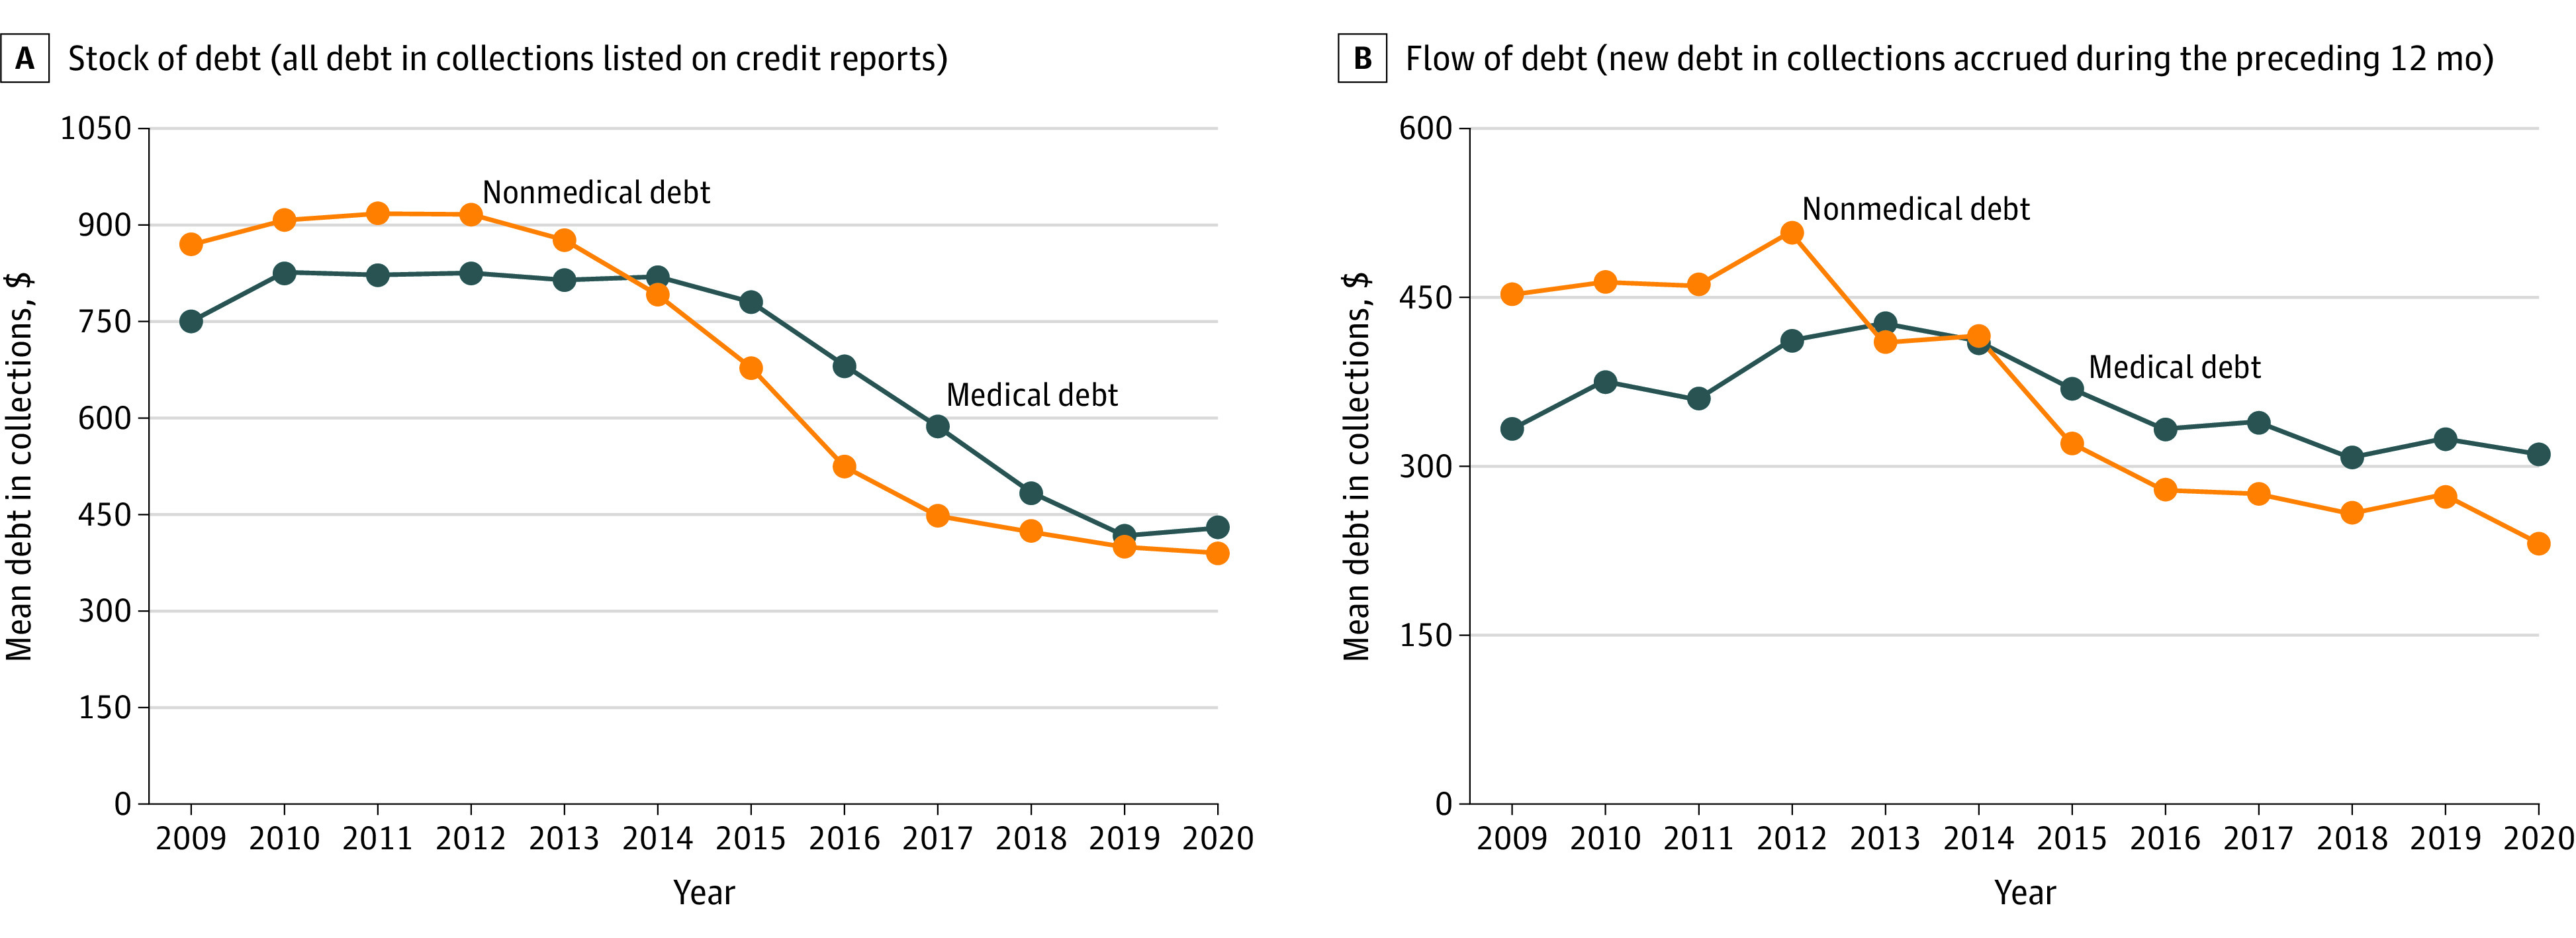
Main outcomes and measures: The stock (all unpaid debt listed on credit reports) and flow (new debt listed on credit reports during the preceding 12 months) of medical debt in collections that can be collected on by debt collectors.
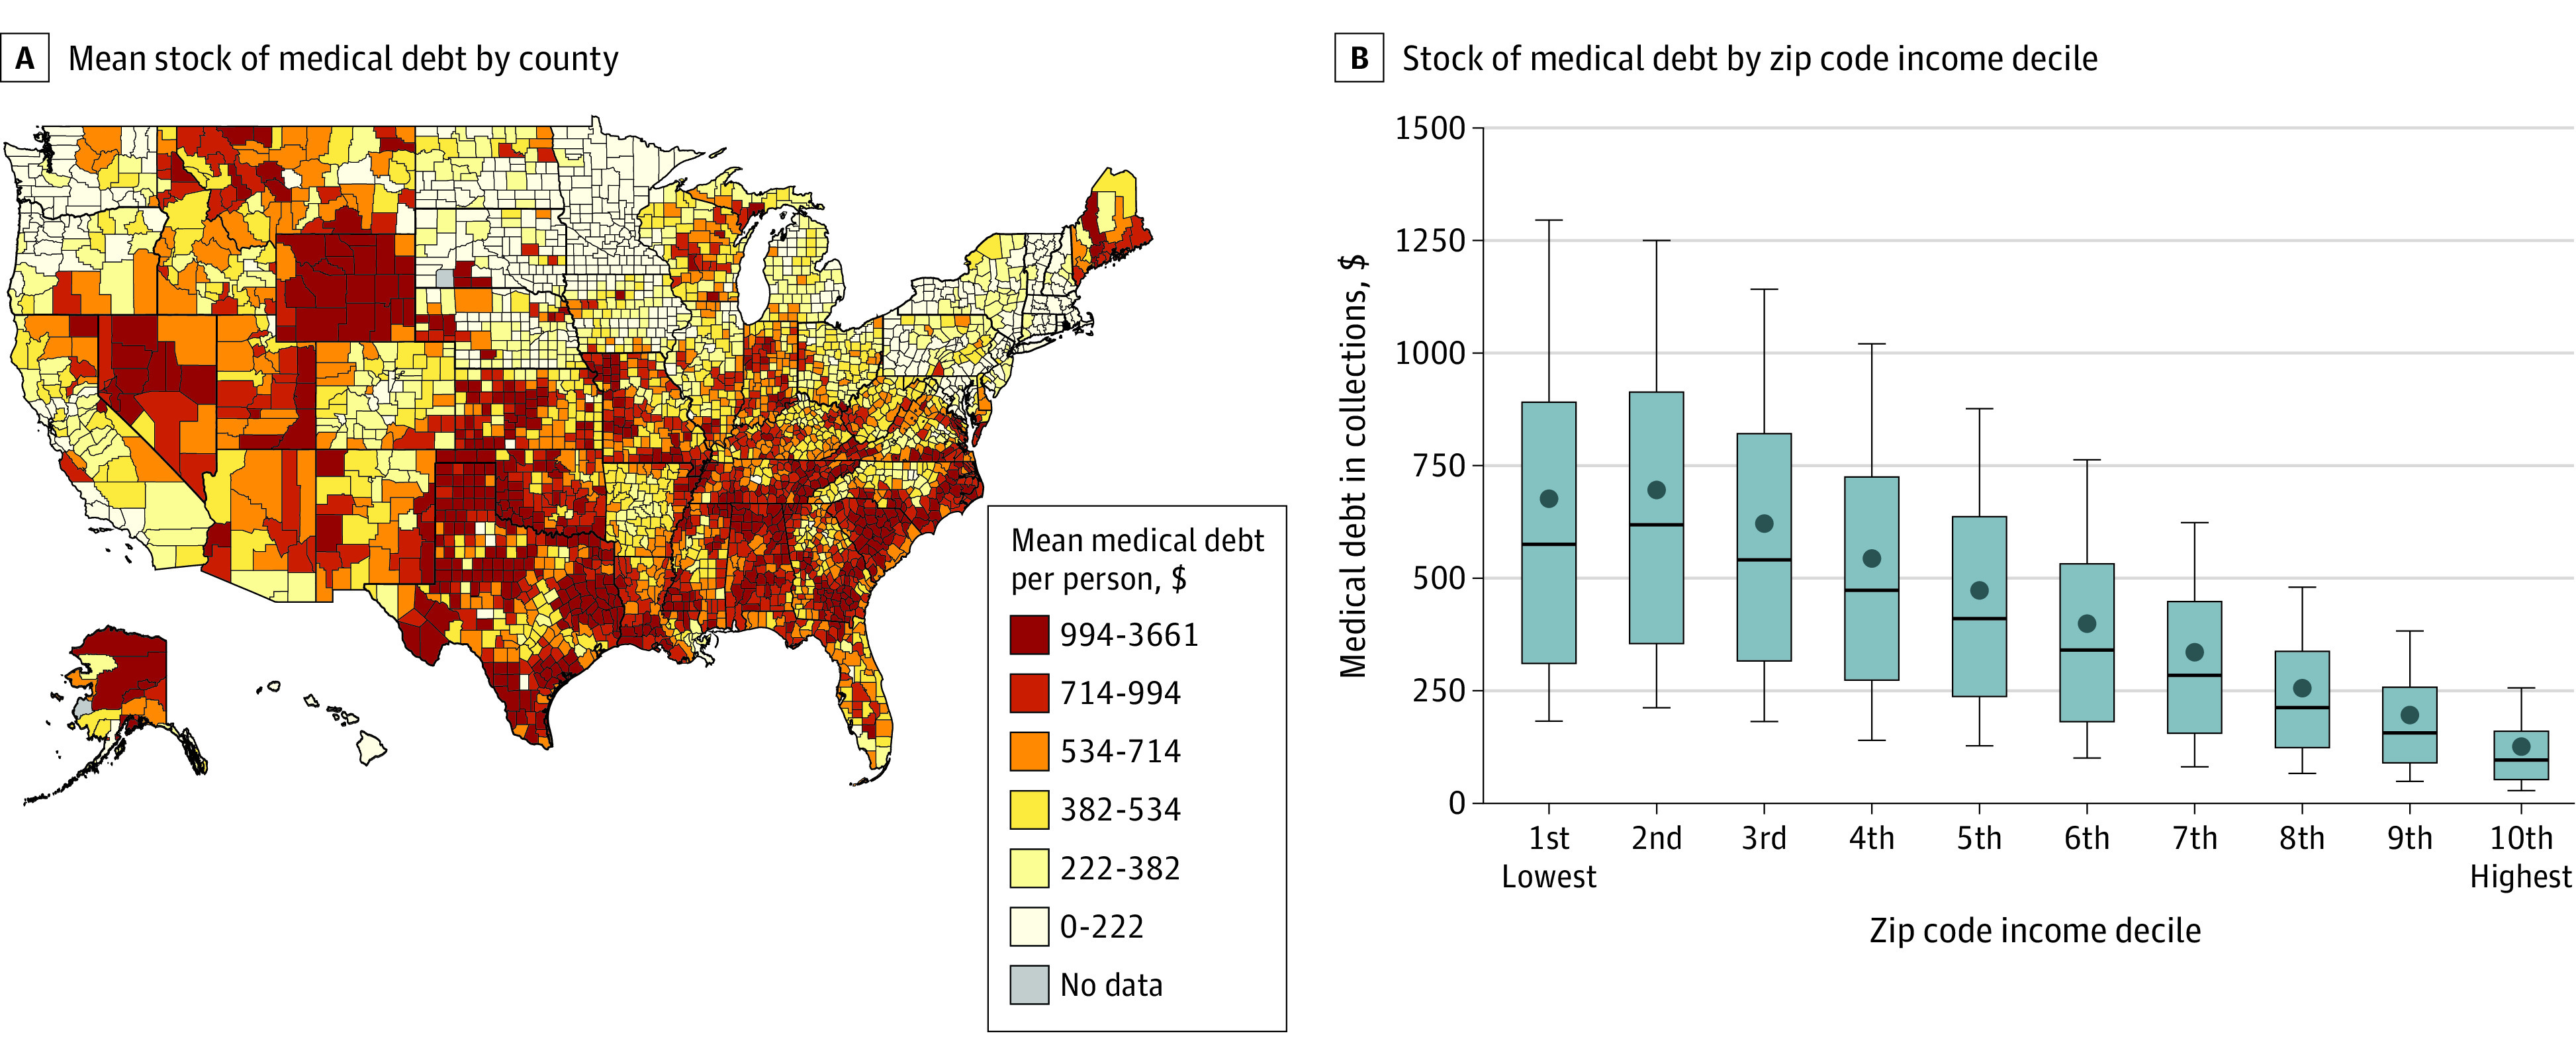
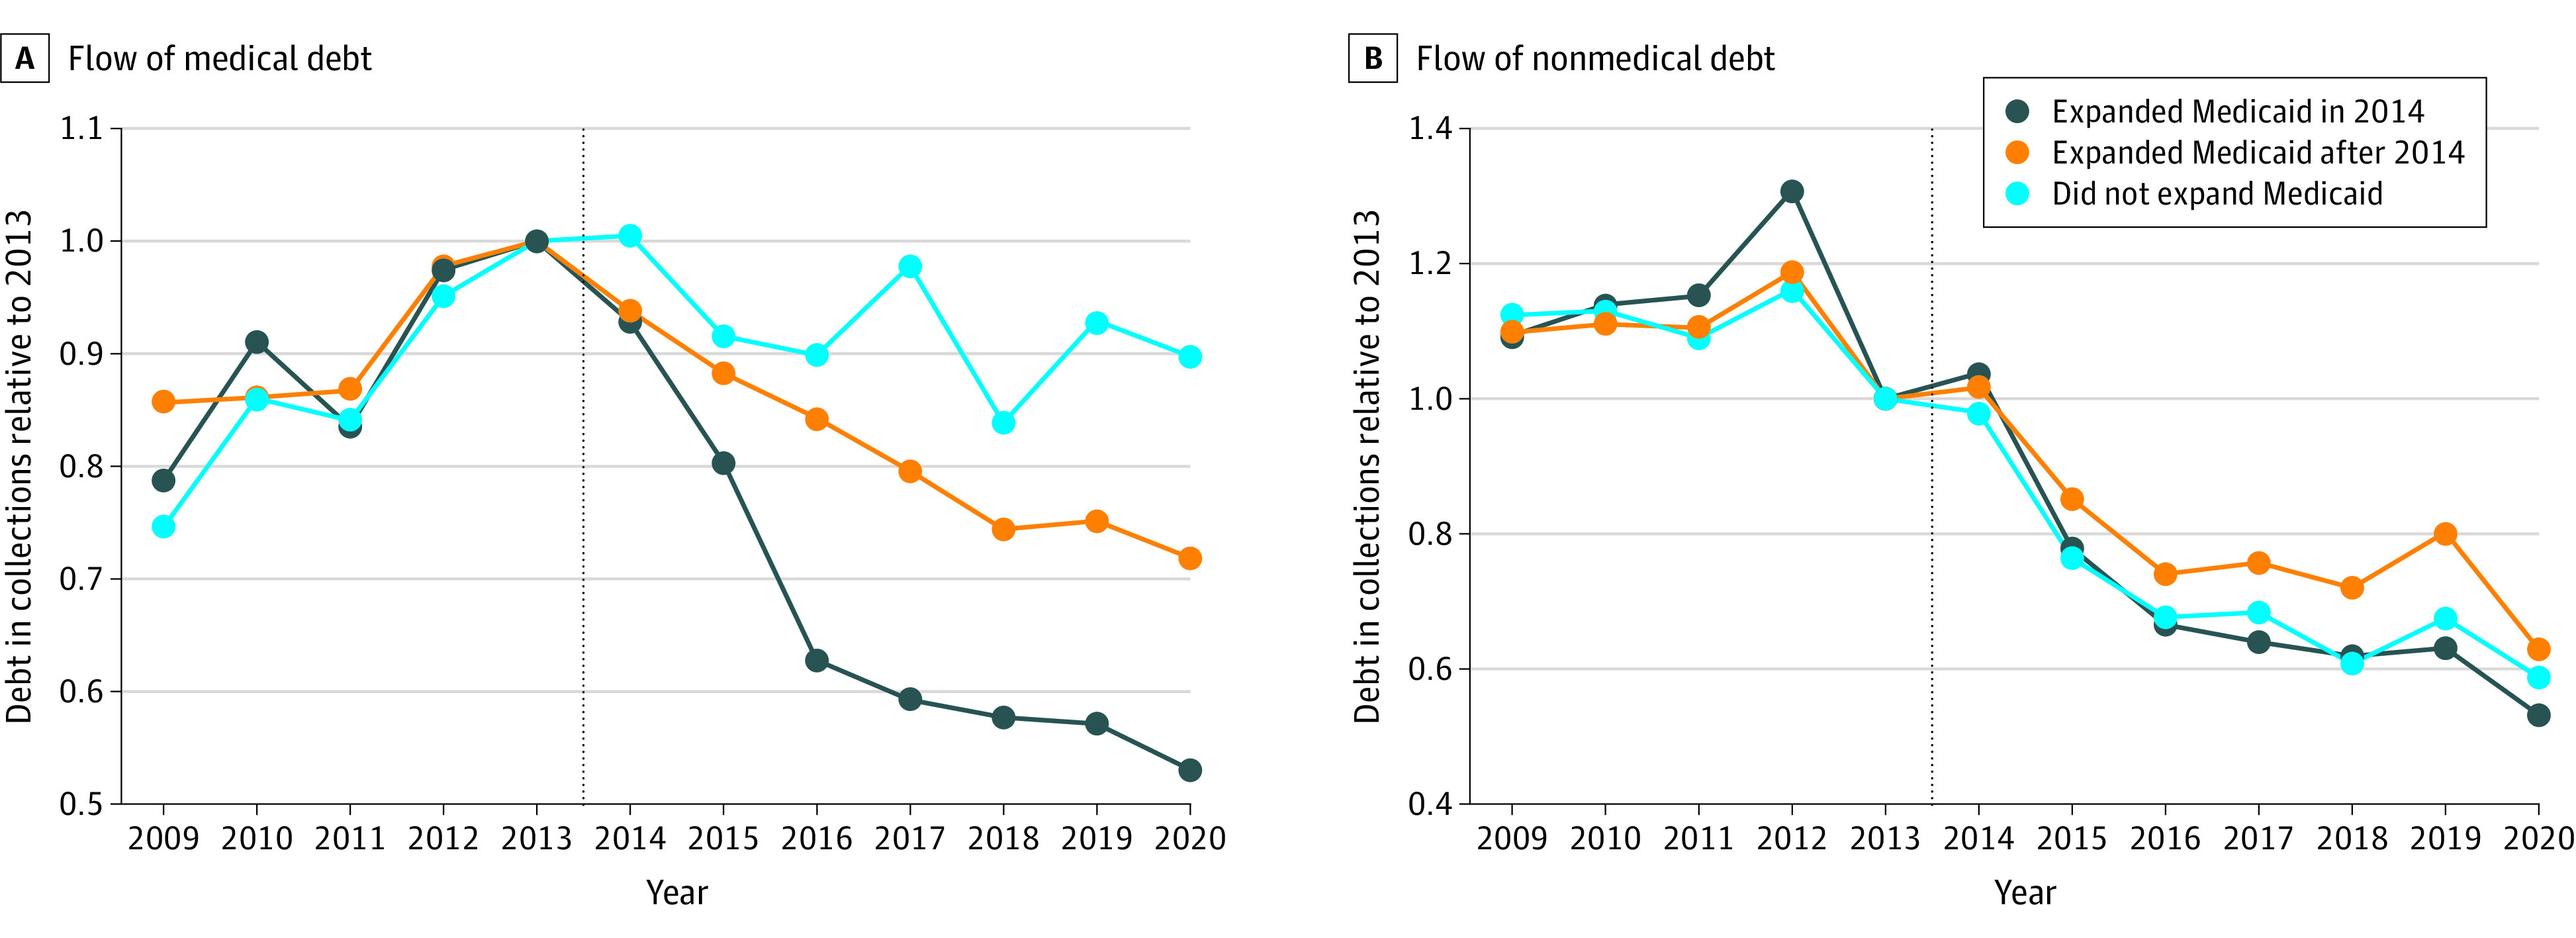
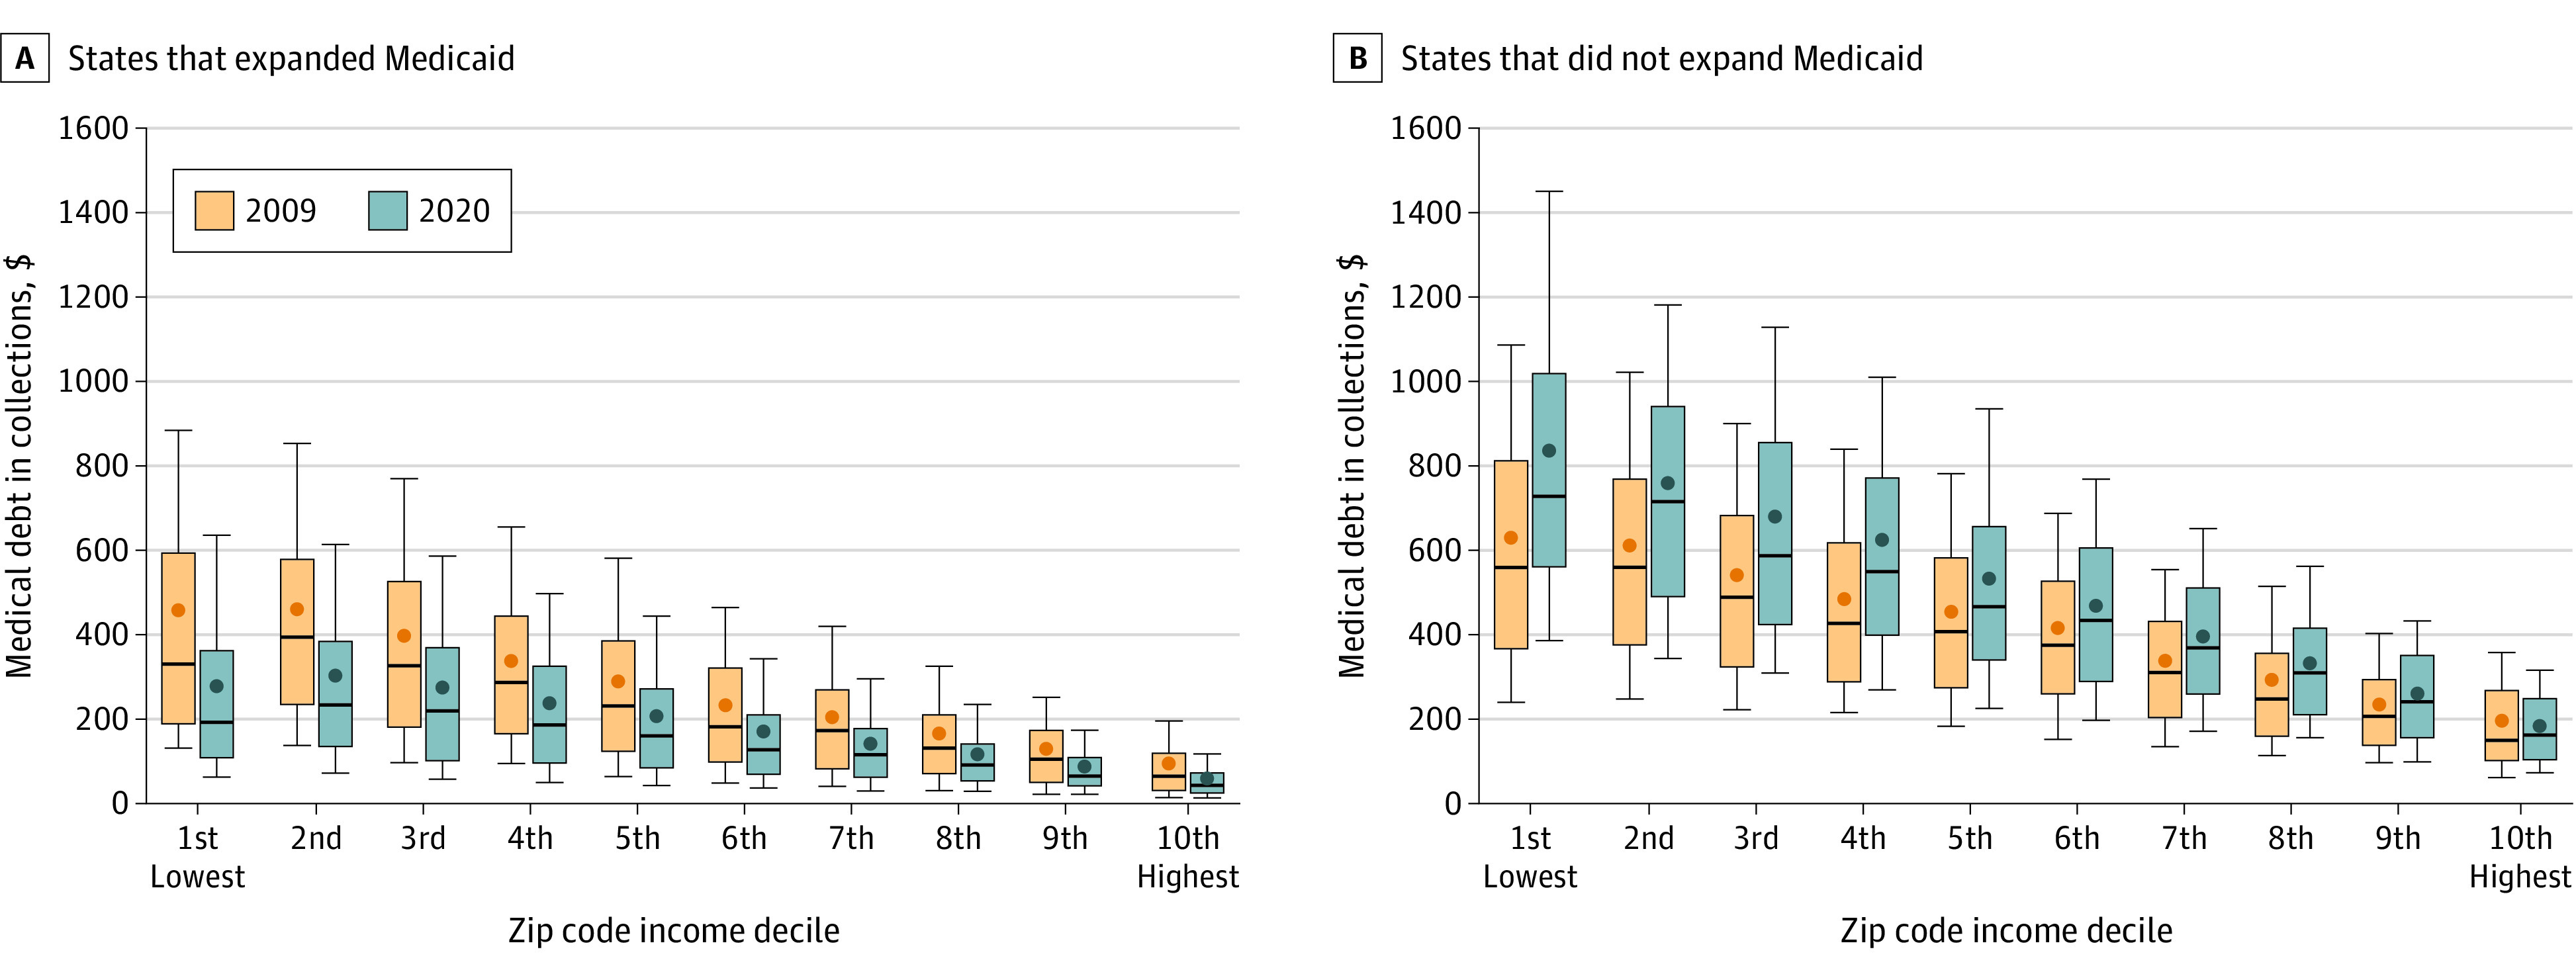
Results: In June 2020, an estimated 17.8% of individuals had medical debt (13.0% accrued debt during the prior year), and the mean amount was $429 ($311 accrued during the prior year). The mean stock of medical debt was highest in the South and lowest in the Northeast ($616 vs $167; difference, $448 [95% CI, $435-$462]) and higher in poor than in rich zip code income deciles ($677 vs $126; difference, $551 [95% CI, $520-$581]). Between 2013 and 2020, the states that expanded Medicaid in 2014 experienced a decline in the mean flow of medical debt that was 34.0 percentage points (95% CI, 18.5-49.4 percentage points) greater (from $330 to $175) than the states that did not expand Medicaid (from $613 to $550). In the expansion states, the gap in the mean flow of medical debt between the lowest and highest zip code income deciles decreased by $145 (95% CI, $95-$194) while the gap increased by $218 (95% CI, $163-$273) in the nonexpansion states.
Conclusions and relevance: This study provides an estimate of the amount of medical debt in collections in the US based on consumer credit reports from January 2009 to June 2020, reflecting care delivered prior to the COVID-19 pandemic, and suggests that the amount of medical debt was highest among individuals living in the South and in lower-income communities. However, further study is needed regarding debt related to COVID-19.
Conflict of interest statement
Figures
Comment in
-
Medical Debt as a Social Determinant of Health.JAMA. 2021 Jul 20;326(3):228-229. doi: 10.1001/jama.2021.9011. JAMA. 2021. PMID: 34283197 No abstract available.
-
Medical Debt in the US From 2009 to 2020.JAMA. 2021 Nov 9;326(18):1873. doi: 10.1001/jama.2021.16061. JAMA. 2021. PMID: 34751715 No abstract available.
References
-
- Health Care Cost Institute . 2017 health care cost and utilization report. Accessed March 14, 2020. https://www.healthcostinstitute.org/images/pdfs/HCCI_2017_%20Health_%20C...
-
- Kaiser Family Foundation . 2018 employer health benefits survey. Accessed March 14, 2020. https://www.kff.org/report-section/2018-employer-health-benefits-survey-...
-
- Keisler-Starkey K, Bunch LN. Health insurance coverage in the United States: 2019. Accessed March 14, 2020. https://www.census.gov/content/dam/Census/library/publications/2020/demo...
-
- Centers for Medicare & Medicaid Services . National health expenditure fact sheet. Accessed March 14, 2020. https://www.cms.gov/Research-Statistics-Data-and-Systems/Statistics-Tren...
Publication types
MeSH terms
Grants and funding
LinkOut - more resources
Full Text Sources
Miscellaneous
