. 2021 Aug 4;13(30):35545-35560.
doi: 10.1021/acsami.1c09850. Epub 2021 Jul 20.

Sequential and Switchable Patterning for Studying Cellular Processes under Spatiotemporal Control

Affiliations

Sequential and Switchable Patterning for Studying Cellular Processes under Spatiotemporal Control

Themistoklis Zisis et al. ACS Appl Mater Interfaces. .

Abstract

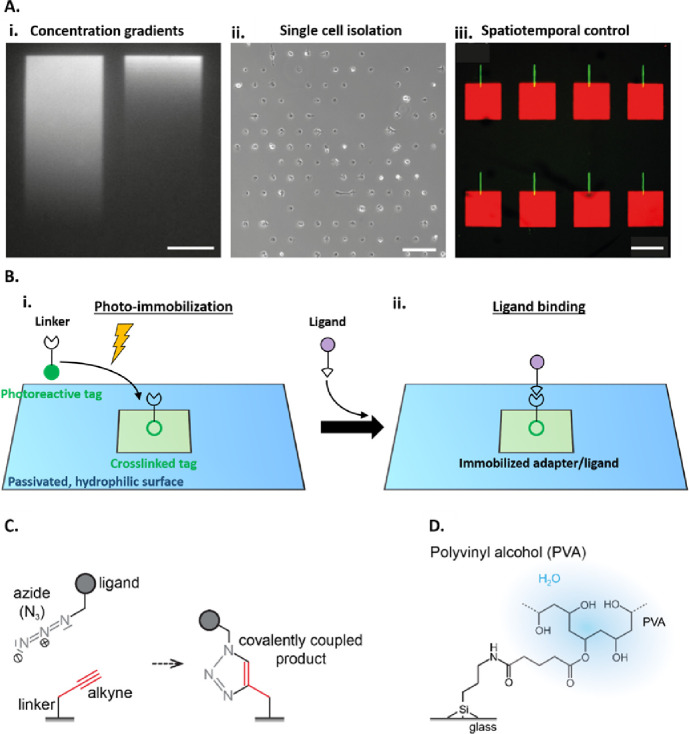
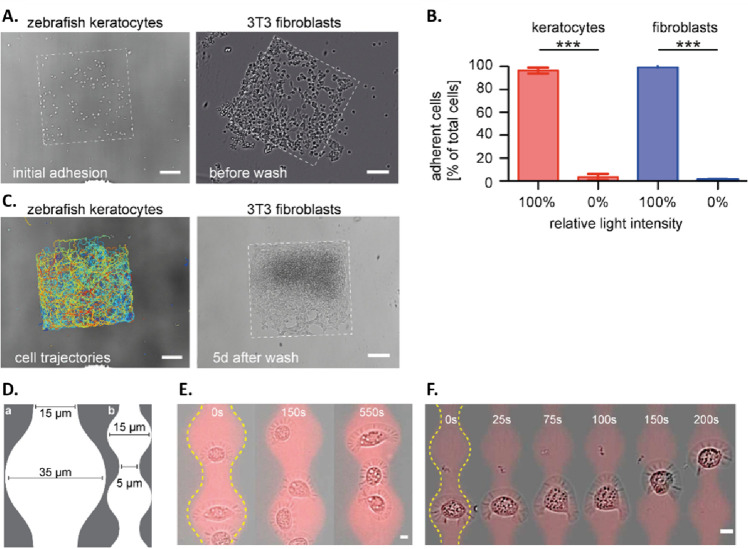
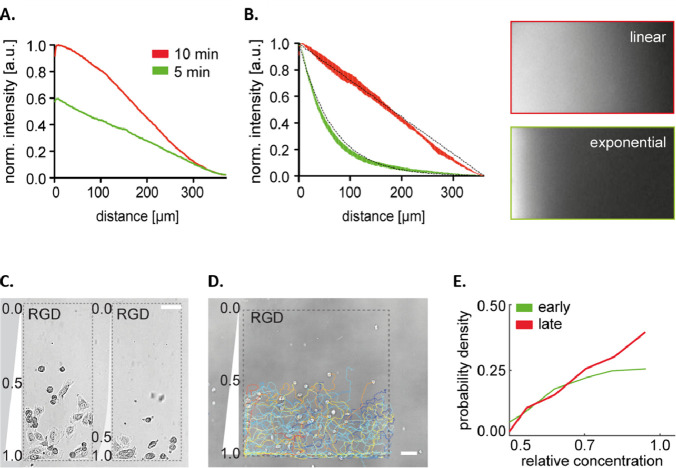
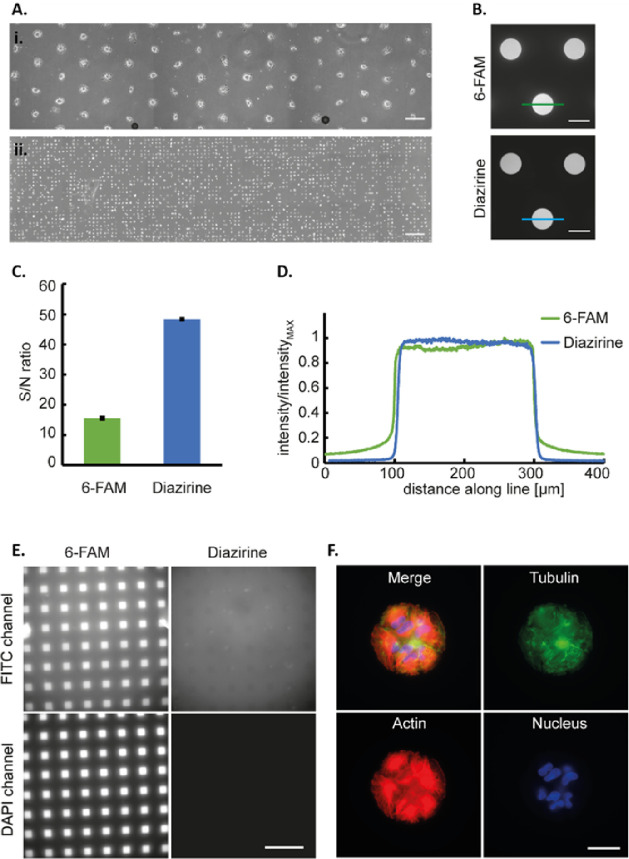
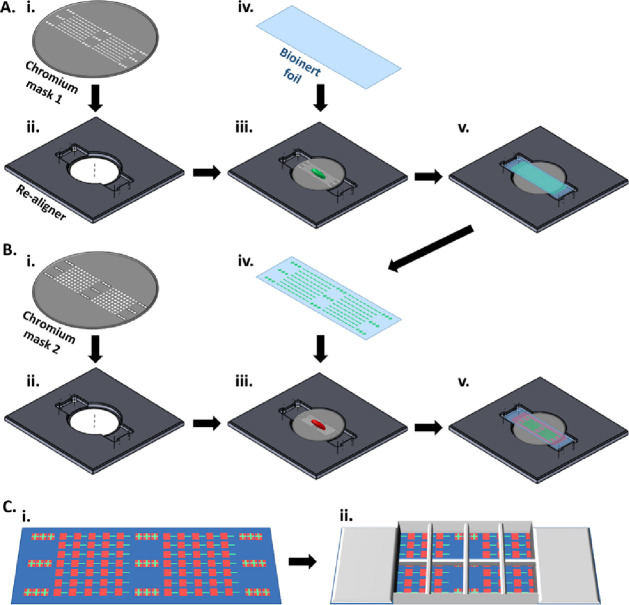
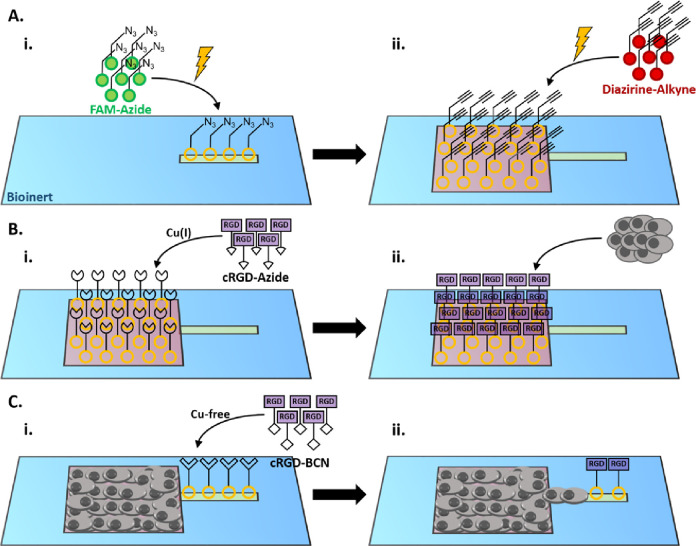
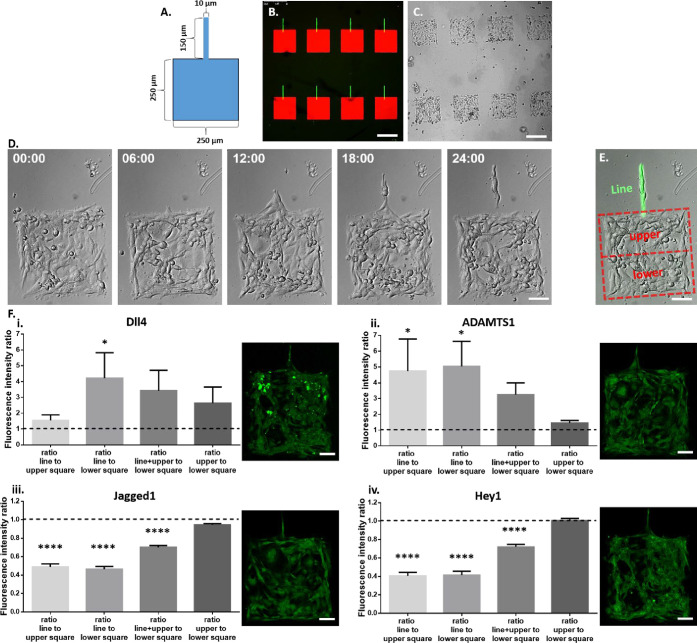
Attachment of adhesive molecules on cell culture surfaces to restrict cell adhesion to defined areas and shapes has been vital for the progress of in vitro research. In currently existing patterning methods, a combination of pattern properties such as stability, precision, specificity, high-throughput outcome, and spatiotemporal control is highly desirable but challenging to achieve. Here, we introduce a versatile and high-throughput covalent photoimmobilization technique, comprising a light-dose-dependent patterning step and a subsequent functionalization of the pattern via click chemistry. This two-step process is feasible on arbitrary surfaces and allows for generation of sustainable patterns and gradients. The method is validated in different biological systems by patterning adhesive ligands on cell-repellent surfaces, thereby constraining the growth and migration of cells to the designated areas. We then implement a sequential photopatterning approach by adding a second switchable patterning step, allowing for spatiotemporal control over two distinct surface patterns. As a proof of concept, we reconstruct the dynamics of the tip/stalk cell switch during angiogenesis. Our results show that the spatiotemporal control provided by our "sequential photopatterning" system is essential for mimicking dynamic biological processes and that our innovative approach has great potential for further applications in cell science.

Keywords: click chemistry; integrin; microcontact printing; photopatterning; surface engineering.


Conflict of interest statement

The authors declare no competing financial interest.

Figures

Figure 1
Figure 1
Covalent protein patterning by photobleaching. (A) Application examples for 2D surface modification by micropatterning. (i) Control on adhesion influenced haptotactic cell migration on gradients of adhesion cues. Scale bar: 100 μm. (ii) Control on the cell number, shape, and density by single-cell adhesion grids. Scale bar: 200 μm. (iii) Spatiotemporal control of cell migration by two-step surface adhesion. Scale bar: 250 μm. (B) Schematic of building-block-based photopatterning. (i) Surface immobilization of photo-cross-linker-labeled linker molecules by photoimmobilization. (ii) Immobilization of ligands via the adapter system. (C) Cu(I)-catalyzed 1,3 dipolar cycloaddition as an adapter system of soluble, ligand-bearing azides (N3) and photoimmobilized alkynes for covalent ligand binding. A small, ∼70 Da, triazole adapter is present between the surface and immobilized dye. (D) Passivating hydrogel layer (polyvinyl alcohol (PVA)). The PVA polymer covalently binds to the amino-silanized glass surface, forming a hydrated passivating layer.
Figure 2
Figure 2
Characterization of RGD-HF555 photopatterning on passivating PVA coating as a tool for probing cell migration. (A) Bright-field images of zebrafish keratocytes and 3T3 fibroblasts (t = 3 h after seeding (before wash)) adhering and growing on square patches of RGD-HF555. Scale bar: 100 μm. (B) Fraction of zebrafish keratocytes (red bars, p < 0.0001) or 3T3 fibroblasts (blue bars, p < 0.0001) adhering on (100% intensity) or next to (0% intensity) 450 × 450 μm2 square patches of RGD-HF555. (C) Zebrafish keratocytes migrating on a patch of RGD-HF555 printed on the PVA background. Cell trajectories after t = 2 h. Scale bar: 100 μm. (D) Bright-field image of 3T3 fibroblasts on square patches of RGD-HF555 grown for 5 days. Scale bar: 100 μm. (E) Template for alternating wide and narrow adhesive areas influencing cell shape changes during migration. (F) Zebrafish keratocyte migrating on 35-μm-wide areas of RGD-HF555 with 15 μm constrictions. Scale bar: 5 μm. (G) Zebrafish keratocyte migrating on 15-μm-wide areas of RGD-HF555 with 5 μm constrictions. Scale bar: 5 μm.
Figure 3
Figure 3
Photopatterning of concentration gradients of surface-immobilized RGD-HF555 on passivating PVA coating as a tool for probing haptotactic cell migration. (A) Normalized intensity profiles of linear gradients of RGD-HF555. Gradient steepness dependent on the 470 nm LED exposure time. Green profile: 5 min exposure time. Red profile: 10 min exposure time. (B) Normalized intensity profiles of linear and exponential-like gradients of RGD-HF555. Green profile: 5 min exposure time and exponential mask. Red profile: 5 min exposure time and linear mask. In (C)–(E), relative RGD-HF555 concentration is given as relative light intensity. (C) Bright-field image of 3T3 fibroblasts adhering and migrating on linear (left) and exponential (right) gradients of RGD-HF555. Scale bar: 50 μm. (D) Bright-field image of zebrafish keratocytes migrating on a linear gradient of RGD-HF555. Scale bar: 50 μm. (E) Time-dependent zebrafish keratocyte trajectory distribution within a linear gradient of RGD-HF555. Early: t = 0–60 min and late: t = 61–120 min (n = 5 independent experiments).
Figure 4
Figure 4
Use of a diazirine linker to generate large patterned areas with very low background immobilization and advanced fluorescence properties. (A) Cells ((i) RCC and (ii) NIH 3T3)) seeded in a microchannel of an ibidi μ-Slide VI0.4 Bioinert where the whole channel is patterned with adhesion spots of (i) 200 μm and (ii) 35 μm diameter using a collimated LED and a photomask. Images were taken (i) 3 days and (ii) 4 h after seeding. Scale bar: 400 μm. (B) Fluorescence images of sulfo-Cy3-azide coupled to either a photopatterned 6-FAM-alkyne or a diazirine-alkyne spot. Green and blue lines indicate the position of the fluorescence intensity profile from (D). Scale bar: 200 μm. (C) Signal-to-noise ratio of the 200 μm pattern generated either with 6-FAM-alkyne or diazirine-alkyne and visualized by functionalizing the pattern with a sulfo-Cy3-azide. (D) Sulfo-Cy3-azide intensity profile across a 200 μm wide pattern spot generated by structured illumination of either 6-FAM-alkyne or diazirine-alkyne (profile along the green/blue line shown in Figure 3B). (E) Autofluorescence in the FITC or DAPI channel of the pattern of 30 μm wide squares generated by either structured illumination of 6-FAM-alkyne or diazirine-alkyne. Scale bar: 200 μm. (F) Immunofluorescence staining of RCC cells on the 100 μm circular pattern: green phalloidin staining, red tubulin staining, and blue DAPI staining. Scale bar: 50 μm.
Figure 5
Figure 5
Schematic illustration of the sequential photopatterning process of the “dynamic” system. (A) Photopatterning of the tip area. (i) Chromium mask etched in a line patterned manner, with cross-shaped alignment markers on either side of the main patterns. (ii) Custom-made realigner designed to coordinate the two masks. (iii) Added dye linker (6-FAM-azide) solution, here shown in green and (iv) ibidi’s Bioinert foil. (v) Configuration of first mask-dye-foil, illuminated from underneath, producing the desired pattern on the foil. (B) Photopatterning of the stalk area. (i) Second chromium mask etched in a square-patterned manner, with square-shaped alignment markers on either side of the main patterns. (ii) Custom-made realigner coordinating the two masks. (iii) Second added dye linker (diazirine-alkyne) solution, here shown in red. (iv) Line-patterned foil resulting from illumination through the first mask. (v) Final configuration of second mask-dye-foil, illuminated from underneath. Crossover square alignment markers were used to precisely align the foil’s existing pattern with the pattern of the second mask. (C) (i) Resulting final line (tip) and square (stalk) photopatterned surface on the Bioinert foil, shown in green and red, respectively. Crossover square alignment markers shown on either side of the mail patterns. (ii) Attachment of an adhesive 8-well bottomless μ-Slide on the patterned surface of the foil, enabling later addition of click reaction solutions and cell seeding.
Figure 6
Figure 6
Detailed illustration of the photobleaching process and click chemistry reactions to produce sequentially cell-adhesive areas. (A) Photobleaching for creating the tip and stalk area. (i) 6-FAM-azide conjugates (left), which, upon illumination through the lines left uncovered by the first mask, attach to the surface (right). (ii) Diazirine-alkyne conjugates (right), which, upon illumination through the squares left uncovered by the second mask, attach to the surface (left). (B) Click chemistry reaction for activation of the stalk areas. (i) Addition of the first click reaction solution containing RGD peptides with azide functional groups. The azide groups form triazole links with the alkyne groups of the diazirine-alkyne conjugates that are already attached to the square areas. These areas are now activated with RGD and adhesive to cells. (ii) HMECs are seeded on the square areas forming the initial stalk cell population. (C) Click chemistry reaction for activation of the tip areas. (i) Addition of the second click reaction solution containing RGD peptides with BCN functional groups. The BCN groups link to the azide groups of the 6-FAM-azide conjugates that are already attached to the line areas. These areas are now also activated with RGD and adhesive to cells (timepoint 0). (ii) Endothelial cells from the stalk areas migrate to the tip areas.
Figure 7
Figure 7
Cell adhesion on the “dynamic” system created by sequential photopatterning and evaluation of tip/stalk protein marker expression. (A) Schematic illustration of the geometry and dimensions of the “dynamic” system generated using sequential photopatterning. (B) Confocal images of diazirine-patterned square areas labeled with DBCO-Sulfo-Cy5 (red) and residual intensity of 6-FAM-patterned line areas (green). Scale bar: 250 μm. (C) Bright-field microscopy image of HMECs adhering on the patterned surfaces. (D) Time lapse of cell migration to the tip. (E) Overlay of the bright-field microscopy image and the fluorescence microscopy image showing the residual fluorescence of the line area (green). The red dashed outline shows the upper and lower square (stalk) compartments, and the green fluorescent line shows the line (tip) compartment. (F) Left panels: Quantitative analysis of the expression of the tip-related markers Dll4 (i) and ADAMTS1 (ii) and the stalk-related markers Jagged1 (iii) and Hey1 (iv). Here, for each marker, the fluorescence intensity ratios between the different compartments of the patterned area (line, upper square, line + upper square, lower square) were determined. Bars represent the mean ratios of the “dynamic” system +SEM. Statistical significance was assessed using one-way ANOVA followed by uncorrected Fisher’s LSD test. (i) Dll4: line/uppermean = 1.54, p = 0.71; line/lowermean = 4.2. p = 0.03; line + upper/lowermean = 3.42, p = 0.1; and upper/lowermean = 2.63, p = 0.27 (n = 9). (ii) ADAMTS1: line/uppermean = 4.74, p = 0.03; line/lowermean = 5.03, p = 0.02; line + upper/lowermean = 3.24, p = 0.19; and upper/lowermean = 1.44, p = 0.79 (n = 7). (iii) Jagged1: line/uppermean = 0.49, p < 0.0001; line/lowermean = 0.46, p < 0.0001; line + upper/lowermean = 0.70, p < 0.0001; and upper/lowermean = 0.94, p = 0.08 (n = 15). (iv) Hey1: line/uppermean = 0.40, p < 0.0001; line/lowermean = 0.41, p < 0.0001; line + upper/lowermean = 0.72, p < 0.0001; and upper/lowermean = 1.00, p = 0.90 (n = 24). n.s.: nonsignificant, *p < 0.05, and ****p < 0.0001. Right panels: Exemplary fluorescence microscopy images of cells stained for the corresponding marker that is quantified in the left panel. Scale bar: 50 μm.

Similar articles

Cited by

References

    1. Ricoult S. G.; Kennedy T. E.; Juncker D. Substrate-Bound Protein Gradients to Study Haptotaxis. Front. Bioeng. Biotechnol. 2015, 3, 4010.3389/fbioe.2015.00040. - DOI - PMC - PubMed
    1. Segerer F. J.; Thüroff F.; Piera Alberola A.; Frey E.; Rädler J. O. Emergence and Persistence of Collective Cell Migration on Small Circular Micropatterns. Phys. Rev. Lett. 2015, 114, 22810210.1103/PhysRevLett.114.228102. - DOI - PubMed
    1. Yoon S. H.; Kim Y. K.; Han E. D.; Seo Y. H.; Kim B. H.; Mofrad M. R. K. Passive Control of Cell Locomotion Using Micropatterns: The Effect of Micropattern Geometry on the Migratory Behavior of Adherent Cells. Lab Chip 2012, 12, 2391–2402. 10.1039/c2lc40084g. - DOI - PubMed
    1. Jiang X.; Bruzewicz D. A.; Wong A. P.; Piel M.; Whitesides G. M. Directing Cell Migration with Asymmetric Micropatterns. Proc. Natl. Acad. Sci. U.S.A. 2005, 102, 975–978. 10.1073/pnas.0408954102. - DOI - PMC - PubMed
    1. Parker K. K.; Brock A. L.; Brangwynne C.; Mannix R. J.; Wang N.; Ostuni E.; Geisse N. A.; Adams J. C.; Whitesides G. M.; Ingber D. E. Directional Control of Lamellipodia Extension by Constraining Cell Shape and Orienting Cell Tractional Forces. FASEB J. 2002, 16, 1195–1204. 10.1096/fj.02-0038com. - DOI - PubMed

Publication types

MeSH terms